. 2021 Oct 27;41(43):8972-8990.
doi: 10.1523/JNEUROSCI.0037-21.2021. Epub 2021 Sep 16.

Cognitive and Neural State Dynamics of Narrative Comprehension

Affiliations

Cognitive and Neural State Dynamics of Narrative Comprehension

Hayoung Song et al. J Neurosci. .

Abstract

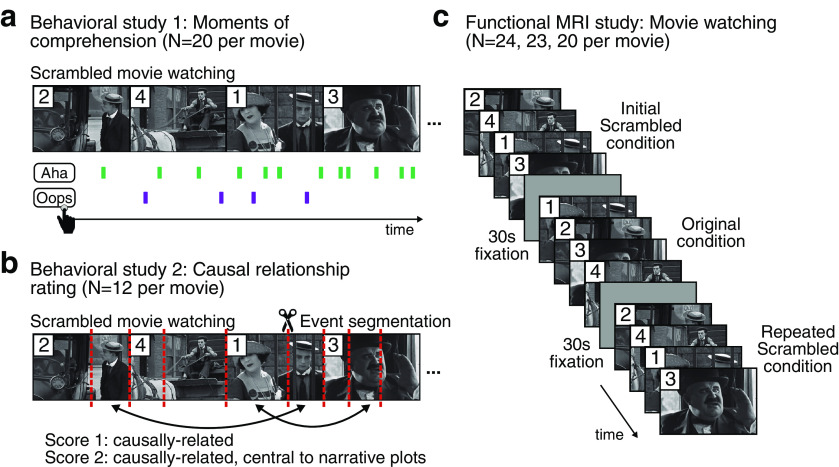
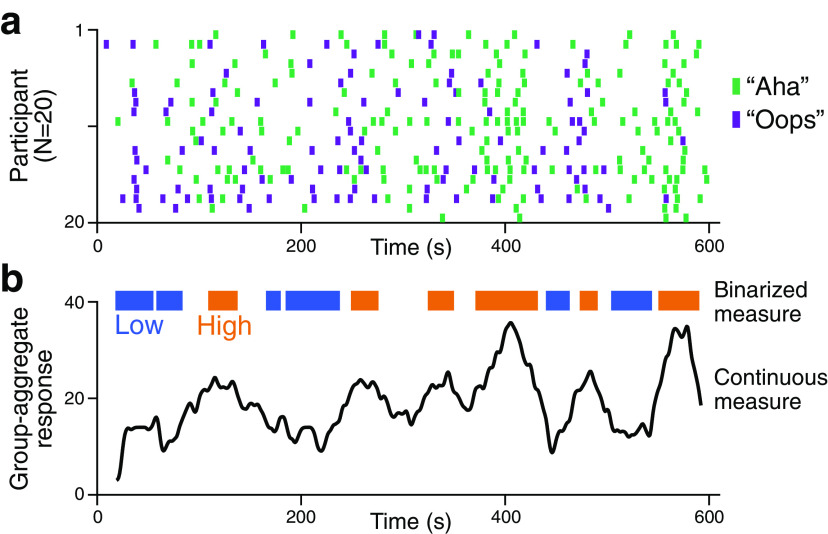
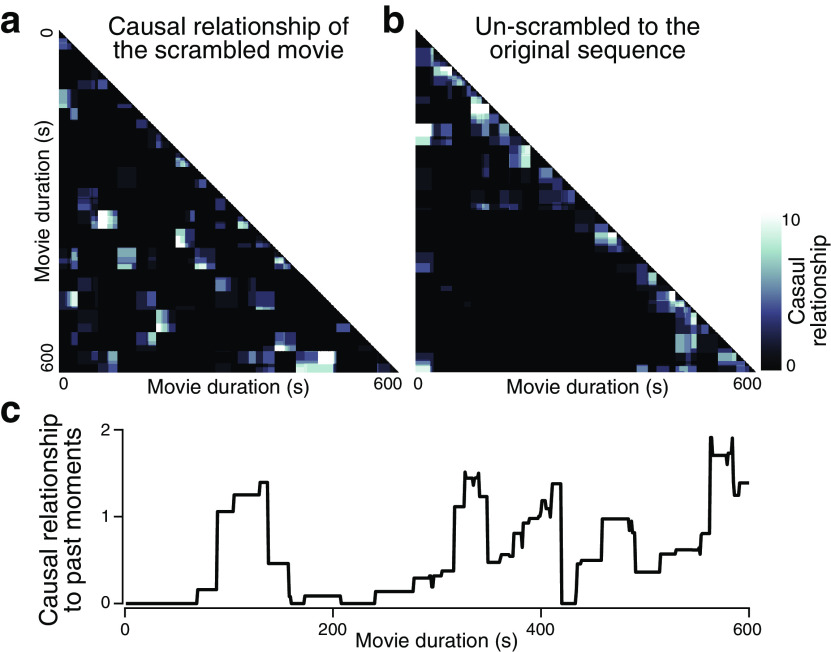
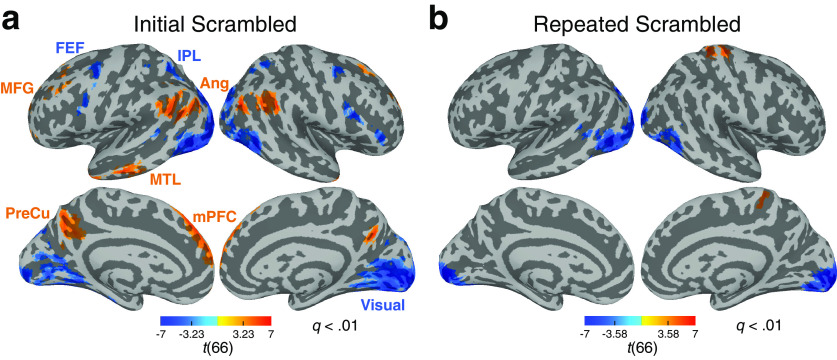
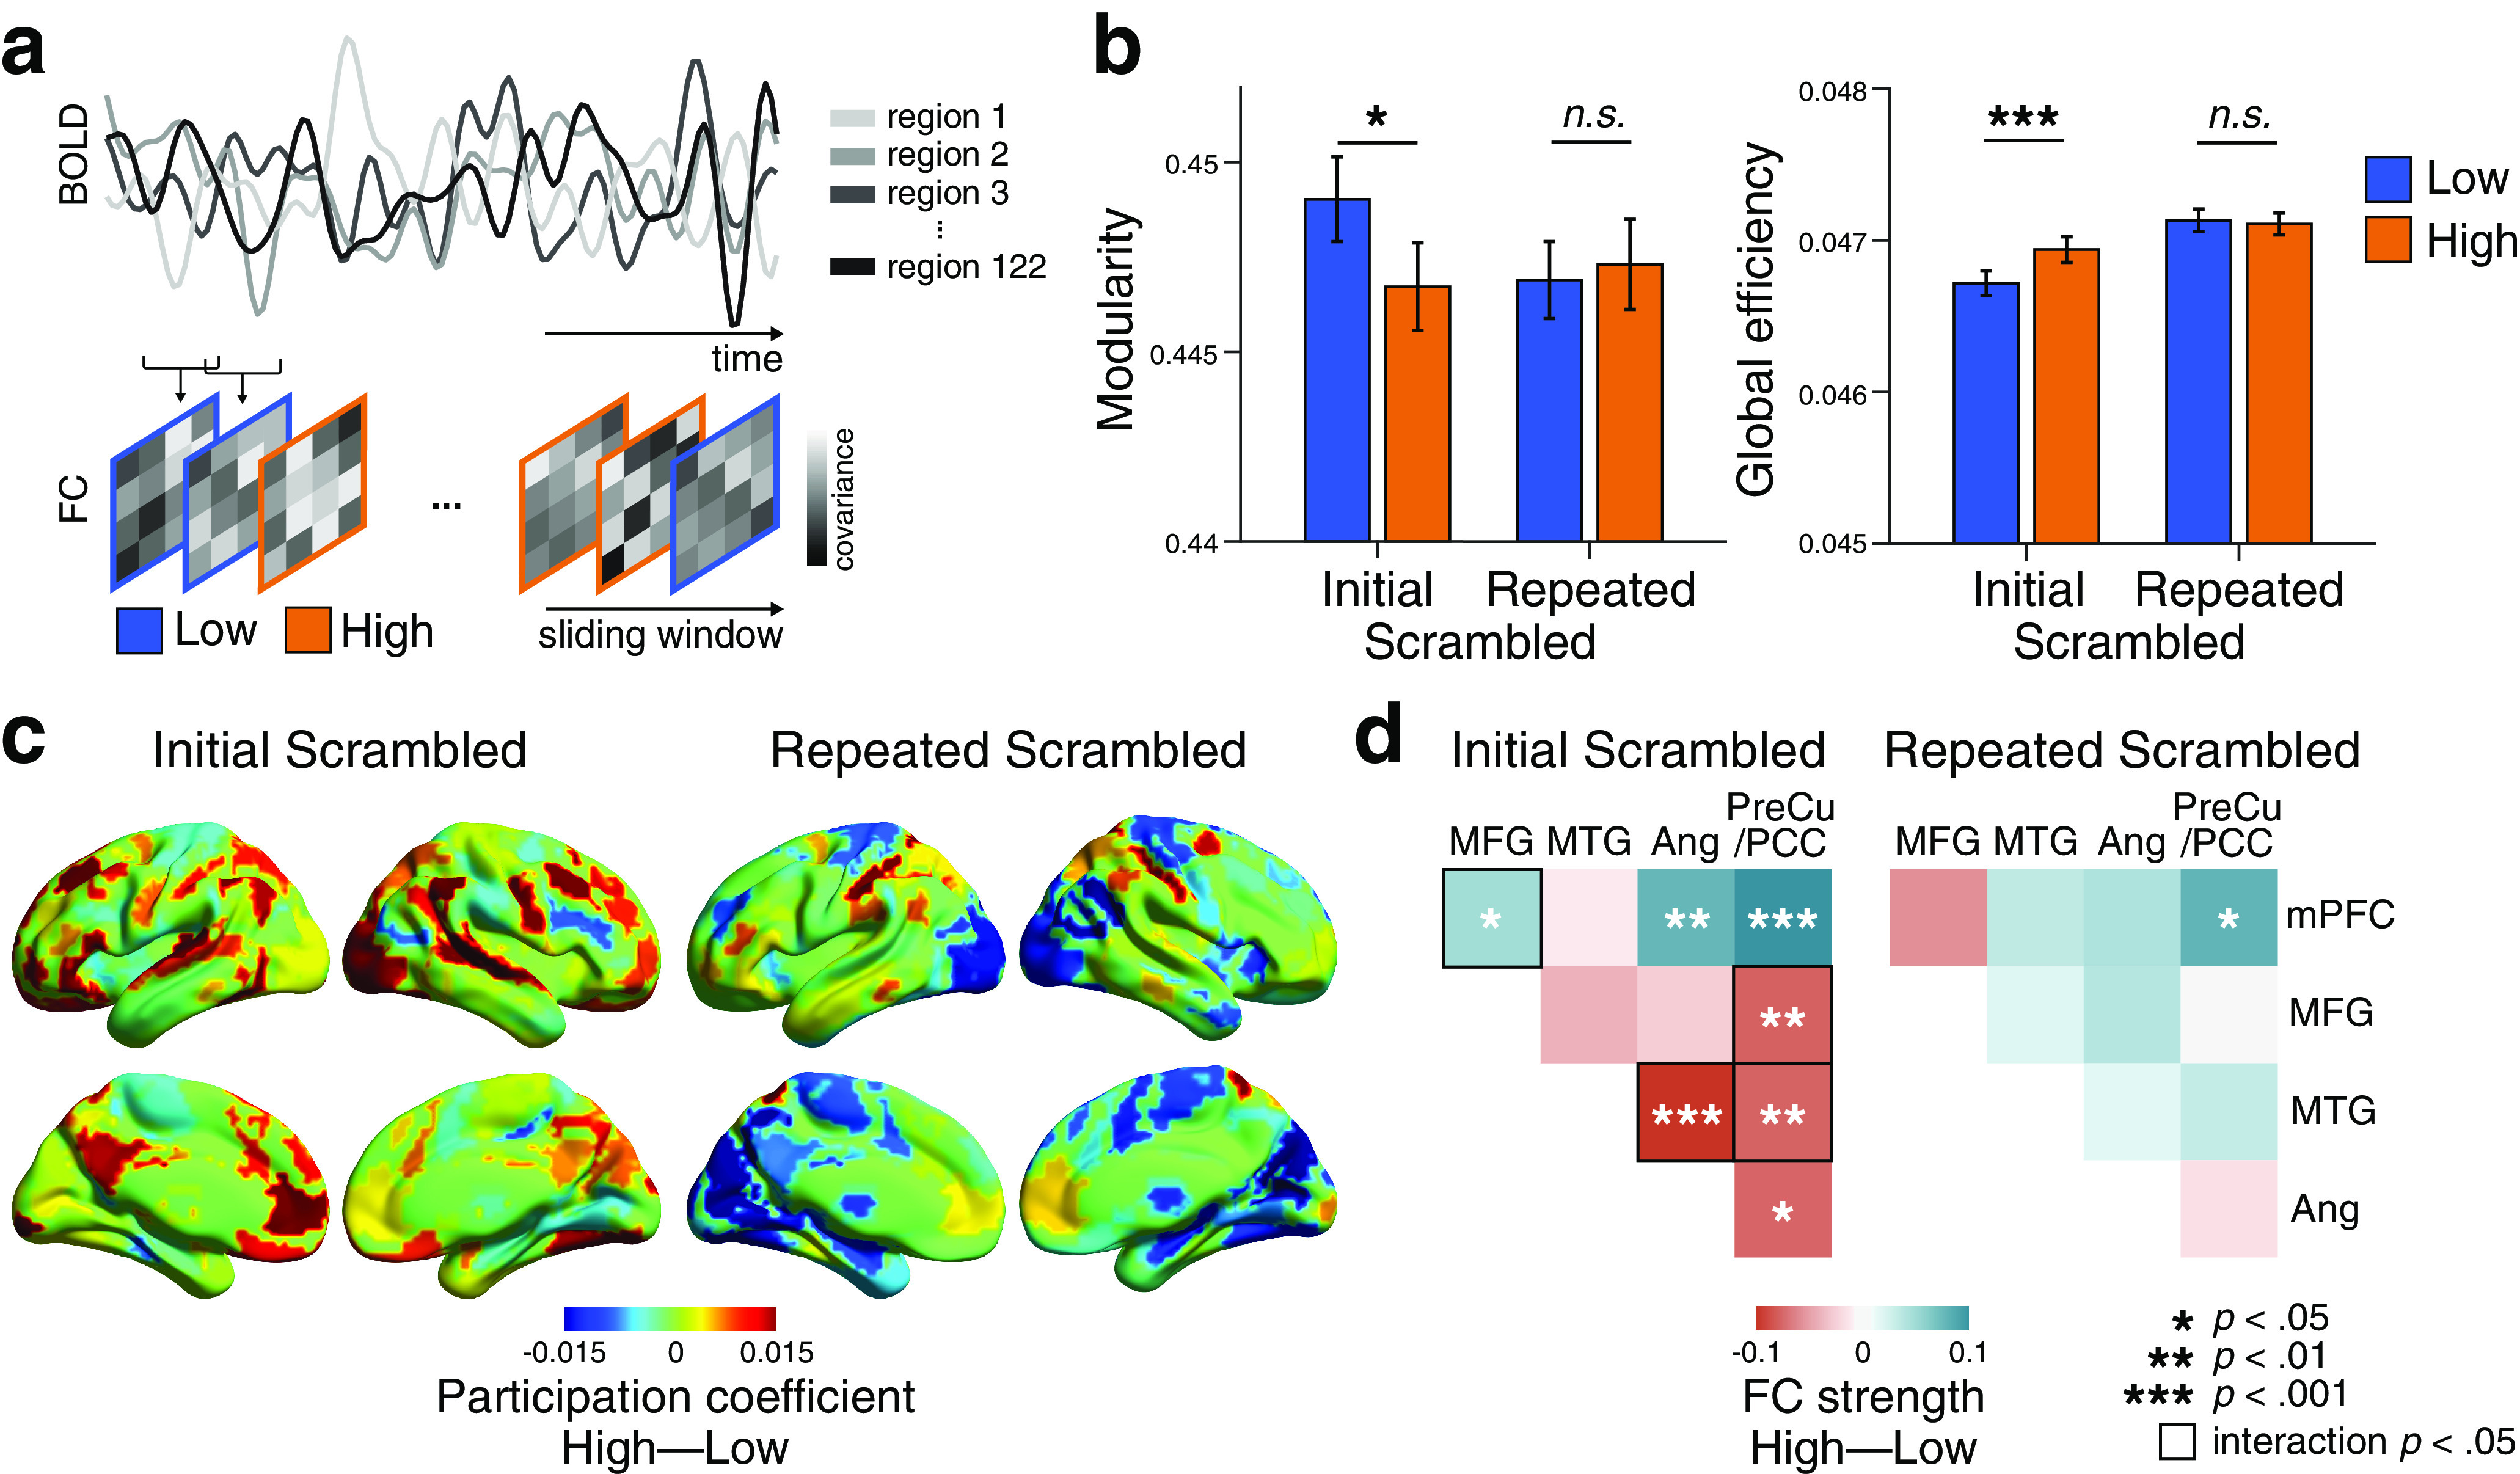
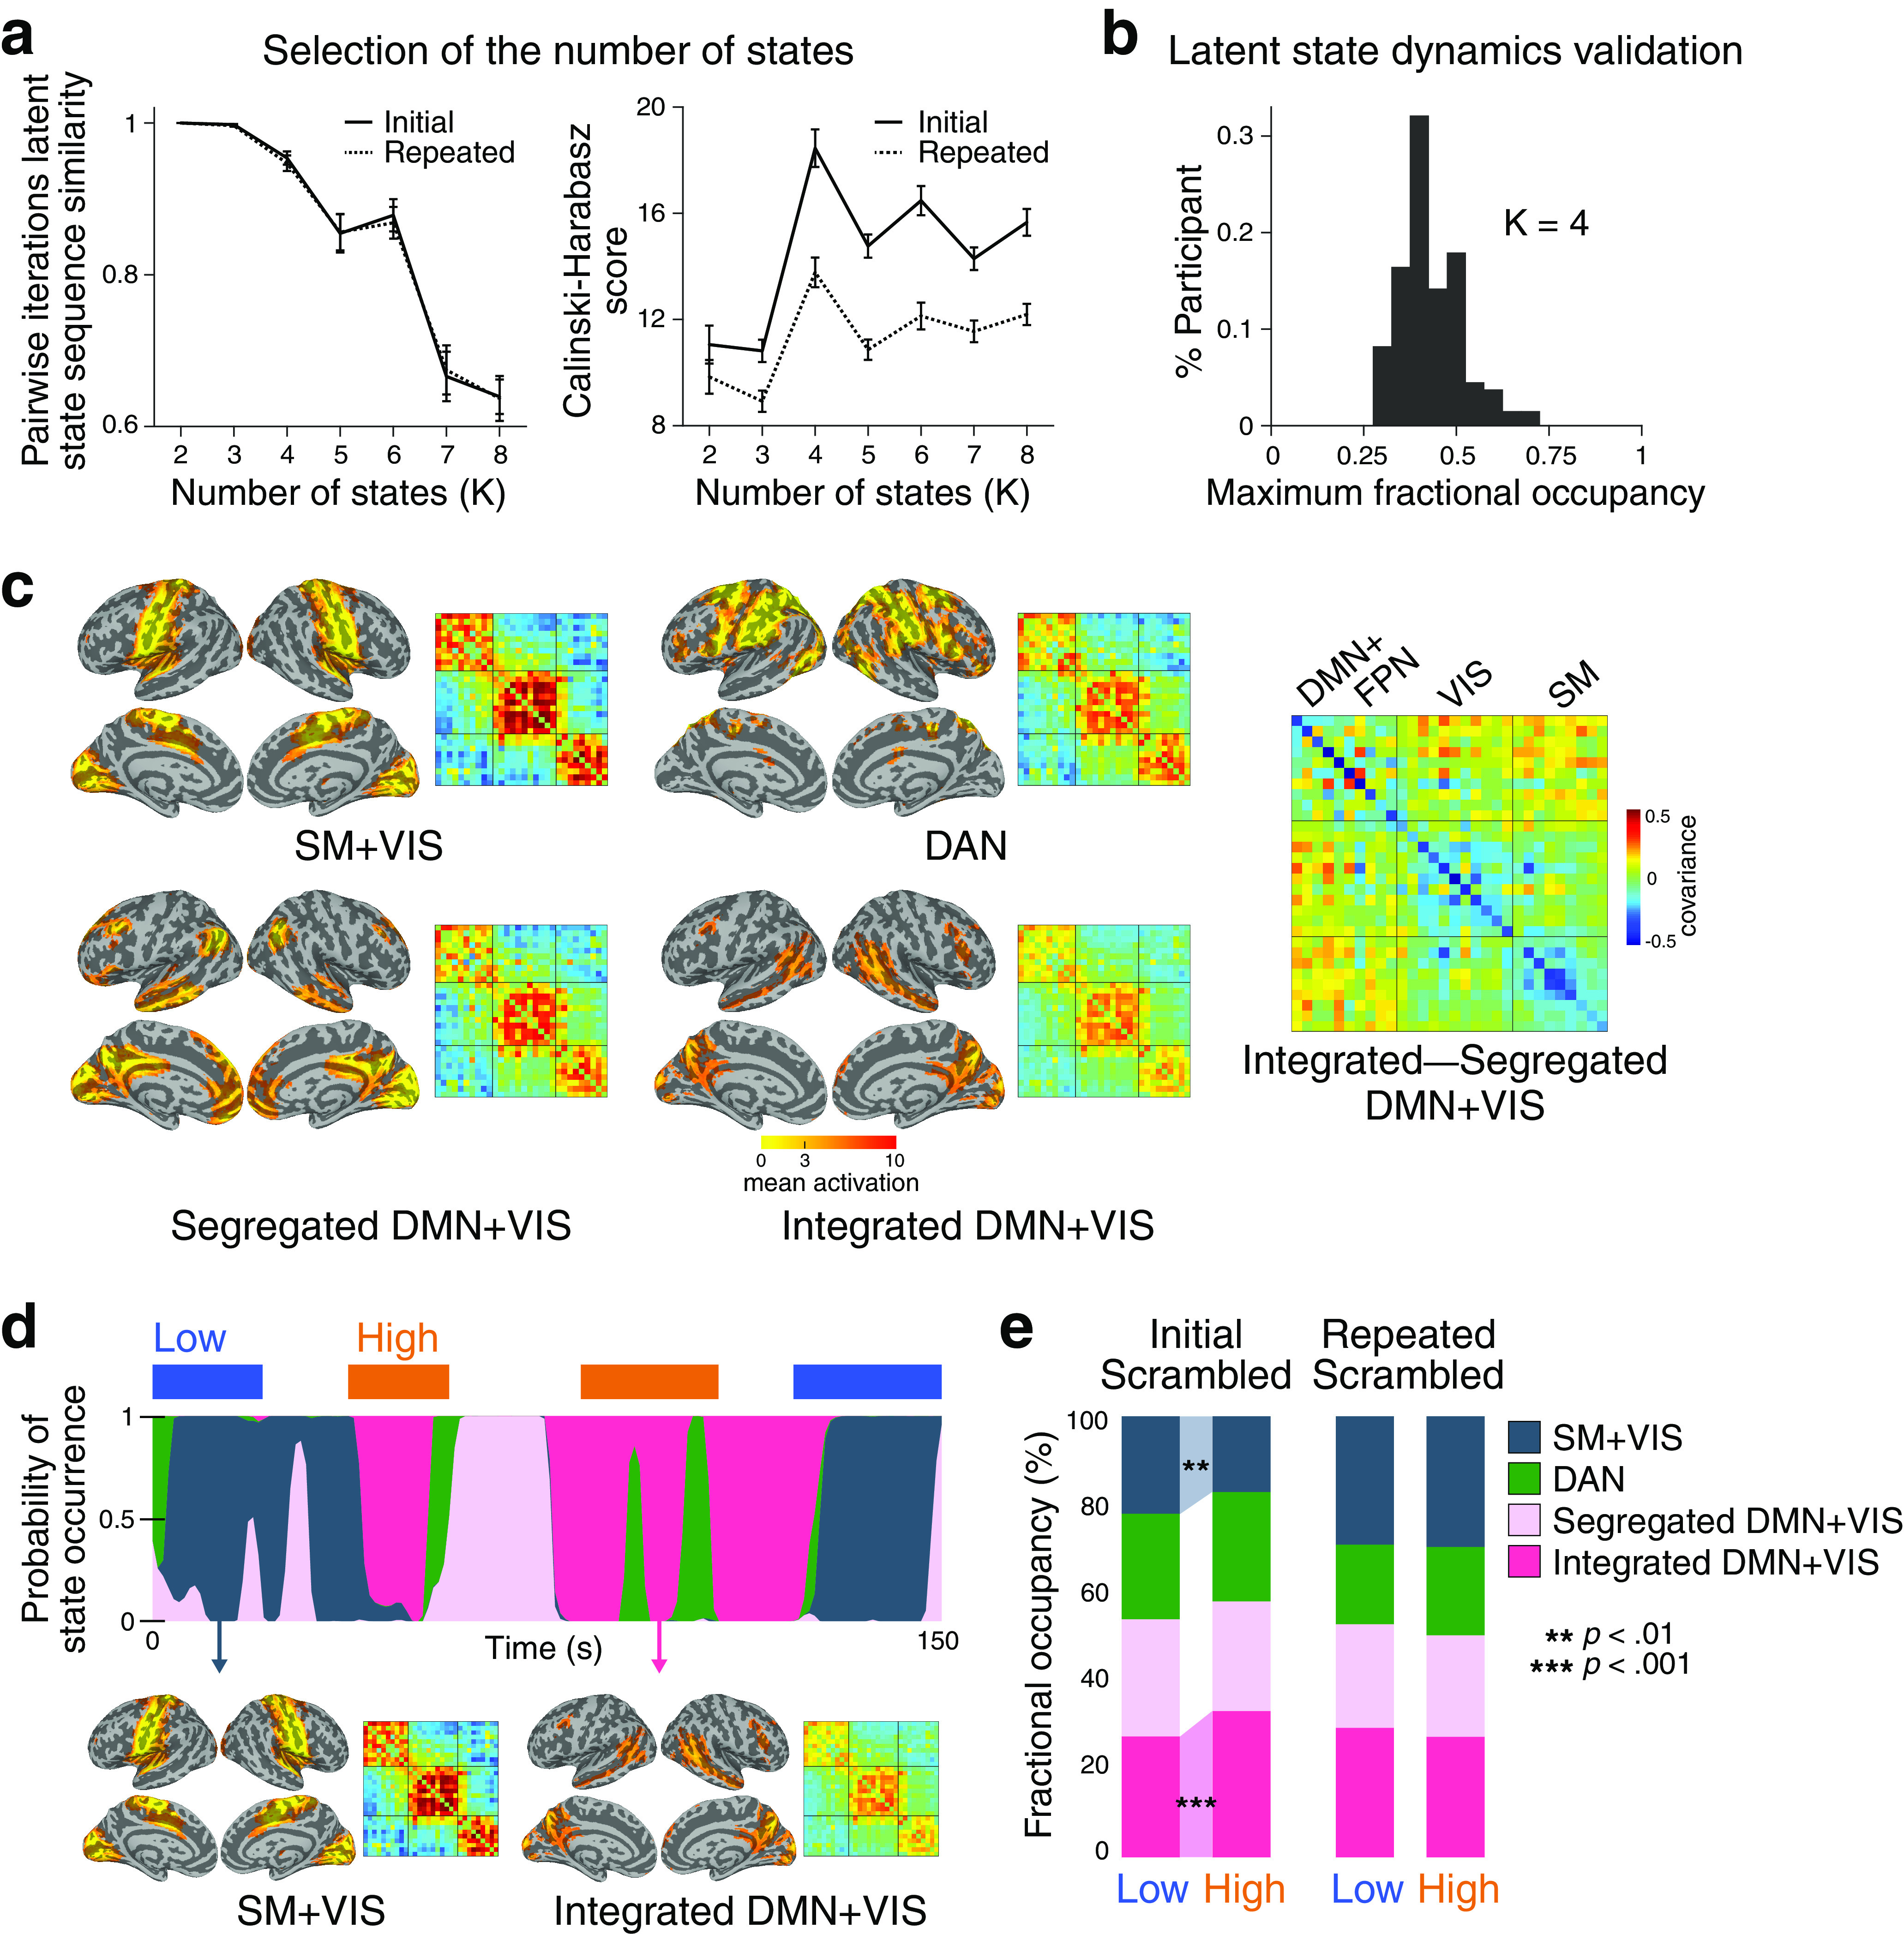
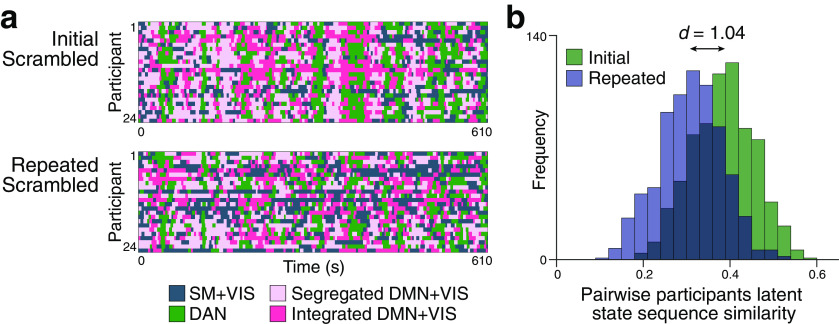
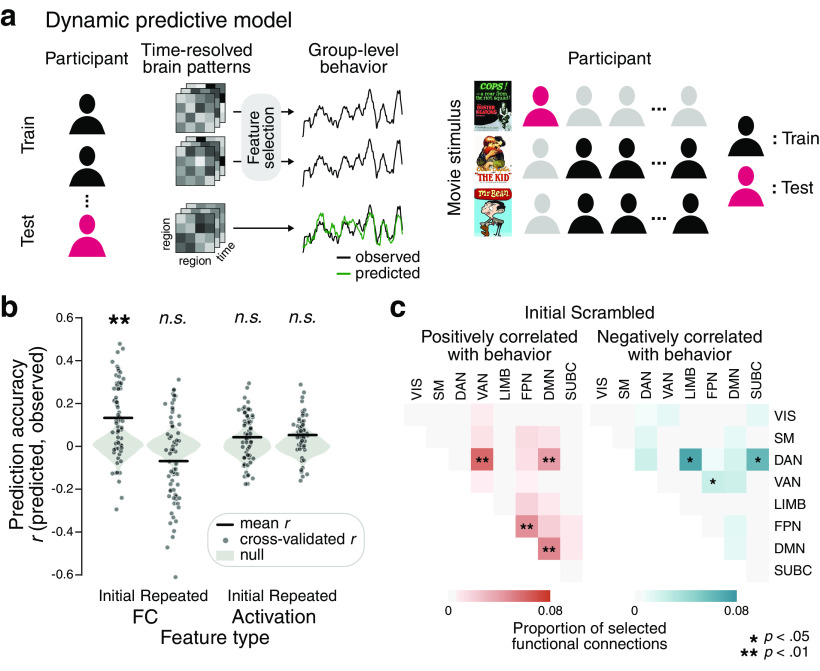
Narrative comprehension involves a constant interplay of the accumulation of incoming events and their integration into a coherent structure. This study characterizes cognitive states during narrative comprehension and the network-level reconfiguration occurring dynamically in the functional brain. We presented movie clips of temporally scrambled sequences to human participants (male and female), eliciting fluctuations in the subjective feeling of comprehension. Comprehension occurred when processing events that were highly causally related to the previous events, suggesting that comprehension entails the integration of narratives into a causally coherent structure. The functional neuroimaging results demonstrated that the integrated and efficient brain state emerged during the moments of narrative integration with the increased level of activation and across-modular connections in the default mode network. Underlying brain states were synchronized across individuals when comprehending novel narratives, with increased occurrences of the default mode network state, integrated with sensory processing network, during narrative integration. A model based on time-resolved functional brain connectivity predicted changing cognitive states related to comprehension that are general across narratives. Together, these results support adaptive reconfiguration and interaction of the functional brain networks on causal integration of the narratives.SIGNIFICANCE STATEMENT The human brain can integrate temporally disconnected pieces of information into coherent narratives. However, the underlying cognitive and neural mechanisms of how the brain builds a narrative representation remain largely unknown. We showed that comprehension occurs as the causally related events are integrated to form a coherent situational model. Using fMRI, we revealed that the large-scale brain states and interaction between brain regions dynamically reconfigure as comprehension evolves, with the default mode network playing a central role during moments of narrative integration. Overall, the study demonstrates that narrative comprehension occurs through a dynamic process of information accumulation and causal integration, supported by the time-varying reconfiguration and brain network interaction.

Keywords: causality; cognitive neuroscience; default mode network; fMRI; functional connectivity; narrative comprehension.


Figures

Figure 1.
Figure 1.
Experiment design. a, Behavioral study 1: Reports on the subjective moments of comprehension of the narratives. As participants watched a temporally scrambled movie (three movie stimuli; N = 20 per movie), they were instructed to press the “Aha” button whenever they experienced subjective comprehension of the plot (green), and the “Oops” button whenever they realized that their previous understanding was incorrect (purple). The duration of each audiovisual movie was 10 min, and the duration of each scene was 36 ± 4 s. b, Behavioral study 2: Event segmentation and causal relationship rating between events. In the first part of the study, an independent group of participants (N = 12 per movie) watched the movie in a temporally scrambled sequence, followed by the original sequence. In the second part, they were instructed to mark perceived event boundaries to the scrambled movie (red dashed lines) and to annotate each event with a short description. In the third part, they were instructed to rate the degree of a causal relationship between pairwise events they segmented themselves (bidirectional arrows). A score of 1 was given if pairwise events were thought to be causally related, a score of 2 when pairwise events held critical causal importance within the narrative plots, and a score of 0 was given otherwise. c, fMRI study. Another independent group of participants (N = 24, 23, and 20 per movie) participated in the fMRI experiment, where they watched the same movie in an Initial Scrambled, Original, and Repeated Scrambled conditions in a single scan run. The conditions were separated by a 30 s fixated rest. No behavioral response was collected during the scan.
Figure 2.
Figure 2.
Changes in comprehension during temporally scrambled movie watching. a, Behavioral responses of comprehending moments while watching an exemplar temporally scrambled movie (N = 20). Participants pressed “Aha” when they experienced subjective feelings of comprehension (green) and “Oops” when they realized their previous comprehension was incorrect (purple). b, A continuous and binary group-aggregate behavioral measure of narrative comprehension. All participants' responses in a were HRF-convolved and aggregated by applying a sliding window. The top one-third of the moments with frequent responses were defined as the moments of high comprehension, whereas the bottom one-third were defined as the moments of low comprehension. Behavioral results using two other movie stimuli are shown in https://github.com/hyssong/comprehension.
Figure 3.
Figure 3.
The causal relationship between narrative events. a, Causal relationship matrix, indicating the degree of a causal relationship between all pairwise moments of an exemplar scrambled movie (N = 12). Participants rated the causal relationship of the pairwise perceived event segments of the scrambled movie on a scale from 0 to 2. All participants' responses were summed to generate a single causal relationship matrix. b, Causal relationship matrix, unscrambled according to the original movie sequence. Strong clustering around the diagonal indicates that the temporally contiguous moments in the original sequence tend to be causally linked. Pairwise events that are temporally distant but highly causally related also existed, indicating the presence of key pairs of events that are critical in developing narratives. c, The time course of causal relationship to past events, which represents causal importance. For each time point in a, we averaged its causal relationship with every past moment of the different scenes.
Figure 4.
Figure 4.
Modulation of BOLD activity during changes in narrative comprehension. Results of the GLM analysis using a continuous behavioral index of comprehension (results from all three movie stimuli, N = 67). The voxelwise group-level statistics (t test) were thresholded with cluster size > 40 and q < 0.01, with the thresholded t values indicated at the color bar. a, Regions that show positive (orange) and negative (blue) correlations with comprehension time courses in the Initial Scrambled condition. When comprehension was high, responses in the DMN increased, whereas responses in the DAN and visual sensory network decreased. b, Regions that show positive (orange) and negative (blue) correlations with comprehension time courses in the Repeated Scrambled condition. FEF, Frontal eye fields; IPL, inferior parietal lobule; MTL, middle temporal lobule; Visual, visual cortex.
Figure 5.
Figure 5.
Dynamic reconfiguration of large-scale functional networks at moments of high and low comprehension. a, Schematic overview of the time-resolved FC analysis using a sliding window. The BOLD time series was extracted from 122 ROIs (Yeo et al., 2011, 2015). Time-resolved FC matrices were constructed for each window across movie duration, and graph-theoretical network measures were computed from each FC matrix. Network measures were categorized by their correspondence to the cognitive states of either high or low comprehension, averaged within a participant, and were compared at group level. The analyses were conducted on all participants using three movie stimuli (N = 67). b, Global network reconfiguration corresponding to cognitive state differences. Modularity and global efficiency representing high- and low-comprehension moments were compared, for both the Initial and Repeated Scrambled conditions. Error bars indicate ±1 SEM. c, Differences in participation coefficients (a regional network measure of across-modular connections) between high- and low-comprehension moments, for the Initial (left) and Repeated (right) Scrambled conditions. The difference in participation coefficients was calculated per ROI and averaged across participants. Positive values (red) indicate that the regions exhibited higher participation coefficients during high-comprehension moments, whereas negative values (blue) indicate that the regions exhibited higher participation coefficients during low comprehension overall. The figure is visualized using BrainNet Viewer (Xia et al., 2013). d, Difference in the FC strengths of the pairwise subregions of the DMN between high- and low-comprehension moments, for the Initial (left) and Repeated (right) Scrambled conditions. Colors represent FC strength differences, averaged across participants. The FC strength of high- compared with low-comprehension moments was compared per regional pairs. Square contour represents pairwise DMN subregions that showed significant interaction effects between Scrambled conditions and comprehension states. The significance was FDR-corrected for the number of regional pairs.
Figure 6.
Figure 6.
Brain state dynamics underlying narrative comprehension, derived from HMM. a, Selection of the number of latent states (K) based on the model's consistency and clustering performance. Left, Model consistency is represented by the mean pairwise similarities of the predicted latent state sequence over five repeated iterations. Right, The model's clustering performance is represented by the ratio between the within-cluster and between-cluster dispersions of the observed IC time series (N = 67), with the clusters predicted by the HMM. A K value of 4 was chosen as the optimal number of states, given their high consistency and clustering performance among possible K values. b, Validation of the dynamics in the inferred sequence from the HMM. The fractional occupancy of the highest emerging state was calculated as per the participant's inferred sequence. c, Activation patterns and functional covariance of the four latent states, identified by training the HMM with the Original condition. The SM+VIS, DAN, Segregated DMN+VIS, and Integrated DMN+VIS were labeled based on their spatial activation patterns corresponding to the eight predefined functional networks. Right, The covariance matrix shows the difference between the covariance matrices of the Integrated DMN+VIS and Segregated DMN+VIS. d, State occupancy and transition dynamics of a representative participant during exemplar moments of the Initial Scrambled condition. Occurrences of the states were probabilistically inferred at each time point (Vidaurre et al., 2017, 2018). Discrete latent states, assigned from the state with the highest probability of occurrence at respective time points, were related to the binary group measure of comprehension. e, The average fractional occupancy of the four latent states during the moments of high and low comprehension, in the Initial and Repeated Scrambled conditions (results from all three movie stimuli, N = 67). Highlighted background between the colored bars represents significant differences in fractional occupancies, FDR-corrected for the number of states.
Figure 7.
Figure 7.
Synchrony of the latent neural states across individuals. a, The HMM-derived neural state dynamics of exemplar movie watching participants in the Initial (top) and Repeated (bottom) Scrambled conditions. b, Histograms of the similarities in state dynamics for all pairwise participants in the two conditions (results from all three movie stimuli, N = 67). The neural state dynamics were more similar across individuals in the Initial compared with the Repeated Scrambled condition.
Figure 8.
Figure 8.
Prediction of the moment-to-moment cognitive states of narrative comprehension from brain patterns. a, Schematic illustrations of dynamic predictive modeling. The model learns the relationship between time-resolved brain patterns (i.e., FC patterns or BOLD activation patterns) and time-resolved cognitive states (i.e., a group-aggregate behavioral measure of comprehension). The brain patterns and a behavioral estimate at every time point from all training participants are treated as independent observations during model training. Feature selection is conducted such that the brain patterns that are significantly correlated with behavioral measures are selected as model features. The trained model is then applied to a held-out individual to predict evolving cognitive states from selected brain features. Prediction accuracy is computed as the Pearson's correlation between the predicted (green line) and observed (black line) behavioral time courses, averaged across cross-validation folds. A cross-validated model is applied to a held-out participant's held-out movie watching scan, from a model trained from the rest of the participants' movie watching scans of different movie stimuli. b, Linear SVR model prediction accuracy (results from all three movie stimuli, N = 67). FC pattern-based and activation pattern-based predictions were conducted for the Initial and Repeated Scrambled conditions. Sixty-seven cross-validated prediction accuracies (gray dots) were averaged, and the mean accuracy (black lines) was compared with the null distribution (gray violin plots) in which the same model predicted phase-randomized group measures of comprehension (one-tailed test). c, The proportions of functional connections that were selected in every cross-validation fold during the Initial Scrambled condition, grouped by predefined functional networks. The triangular matrices represent the proportion of functional connections that were positively (left) or negatively (right) correlated with comprehension measures. The functional network pairs of which the proportion of selections was significantly higher than chance are indicated with asterisks (one-tailed test, FDR-corrected for the number of network pairs). LIMB, Limbic network; SUBC, subcortical network.

References

    1. Achard S, Bullmore E (2007) Efficiency and cost of economical brain functional networks. PLoS Comput Biol 3:e17. 10.1371/journal.pcbi.0030017 - DOI - PMC - PubMed
    1. Allen EA, Damaraju E, Plis SM, Erhardt EB, Eichele T, Calhoun VD (2014) Tracking whole-brain connectivity dynamics in the resting state. Cereb Cortex 24:663–676. 10.1093/cercor/bhs352 - DOI - PMC - PubMed
    1. Aly M, Chen J, Turk-Browne NB, Hasson U (2018) Learning naturalistic temporal structure in the posterior medial network. J Cogn Neurosci 30:1345–1365. 10.1162/jocn_a_01308 - DOI - PMC - PubMed
    1. Andrews-Hanna JR, Smallwood J, Spreng RN (2014) The default network and self-generated thought: component processes, dynamic control, and clinical relevance. Ann NY Acad Sci 1316:29–52. 10.1111/nyas.12360 - DOI - PMC - PubMed
    1. Baker AP, Brookes MJ, Rezek IA, Smith SM, Behrens T, Probert Smith PJ, Woolrich M (2014) Fast transient networks in spontaneous human brain activity. Elife 3:e01867. 10.7554/eLife.01867 - DOI - PMC - PubMed

Publication types

LinkOut - more resources