. 2021 Sep 16;12(1):5476.
doi: 10.1038/s41467-021-25579-3.

Diel cycle of sea spray aerosol concentration

Affiliations

Diel cycle of sea spray aerosol concentration

J Michel Flores et al. Nat Commun. .

Abstract

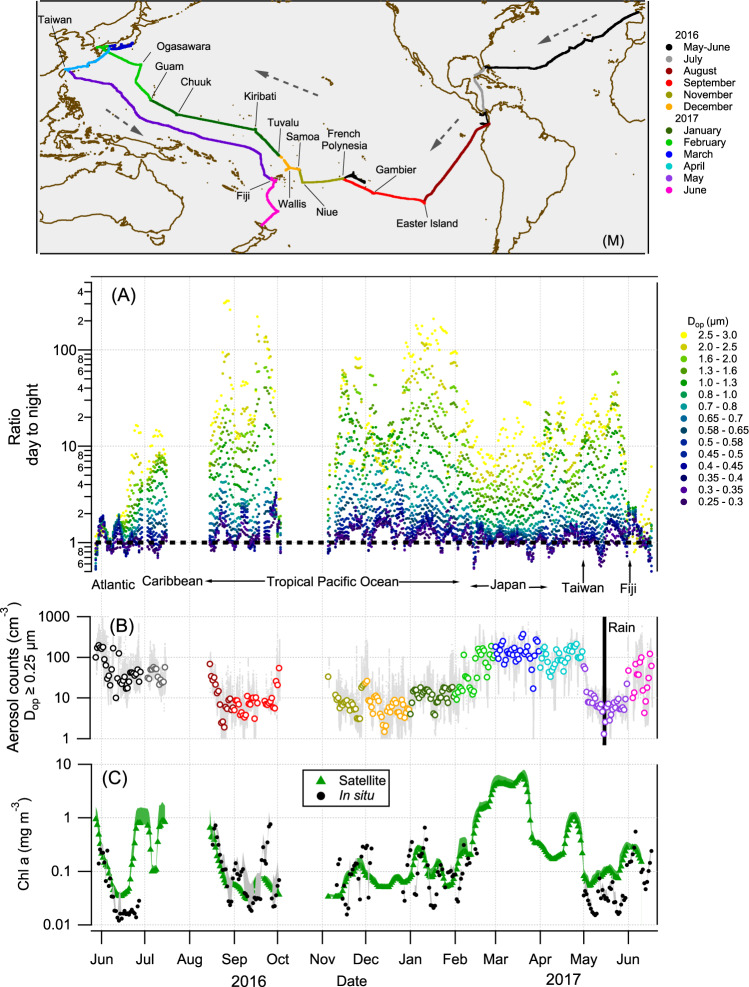
Sea spray aerosol (SSA) formation have a major role in the climate system, but measurements at a global-scale of this micro-scale process are highly challenging. We measured high-resolution temporal patterns of SSA number concentration over the Atlantic Ocean, Caribbean Sea, and the Pacific Ocean covering over 42,000 km. We discovered a ubiquitous 24-hour rhythm to the SSA number concentration, with concentrations increasing after sunrise, remaining higher during the day, and returning to predawn values after sunset. The presence of dominating continental aerosol transport can mask the SSA cycle. We did not find significant links between the diel cycle of SSA number concentration and diel variations of surface winds, atmospheric physical properties, radiation, pollution, nor oceanic physical properties. However, the daily mean sea surface temperature positively correlated with the magnitude of the day-to-nighttime increase in SSA concentration. Parallel diel patterns in particle sizes were also detected in near-surface waters attributed to variations in the size of particles smaller than ~1 µm. These variations may point to microbial day-to-night modulation of bubble-bursting dynamics as a possible cause of the SSA cycle.


Conflict of interest statement

The authors declare no competing interests.

Figures

Fig. 1
Fig. 1. Day-to-night ratios for individual bins of the optical particle counter, total marine aerosol count for optical diameter (Dop) ≥ 0.25 μm, and chlorophyll-a concentration along R/V Tara’s route.
(M) Tara’s route, color-coded by month and dotted arrows showing the sailing direction. A The ratio (5-day running average) of day-to-night concentration of marine aerosol for each size bin of the optical particle counter. B The total aerosol count (daily mean) for Dop ≥ 0.25 μm, the gray dots are the raw total counts per minute. The colors as defined in the map. C A 5-day running average of chlorophyll-a concentration measured with the AC-S aboard Tara (black circles) and calculated using satellite data (green triangles; see “Methods”), with the shaded area outlining one standard deviation. The day-to-night ratios are greater than one on the vast majority of the route and largest in clean areas with low chl-a concentration, i.e., in oligotrophic (“blue”) waters.
Fig. 2
Fig. 2. Mean day-to-night aerosol count ratio for each bin of the optical particle counter (OPC) for different regions across Tara’s route.
The shaded areas represent 1σ, and only the top parts are shown for clarity. N refers to the number of days analyzed.
Fig. 3
Fig. 3. Twenty-four cycle of aerosol concentration and marine particle size index.
(M) Map of R/V Tara’s route, with dotted arrows along the sailing direction and solid black lines along the 48-h back-trajectories. Filled circles on the route are colored by the value of the day-to-night concentration ratio. The data in panels (A) through (C) are from the orange and blue-shaded transect in the western Pacific between Keelung and Fiji (next to the double-ended arrow). The orange-shaded region represents anthropogenic polluted conditions, and the blue-shaded refers to clean ones. A Main observation. Aerosol concentration per liter (optical diameter (Dop) > 0.58 μm, collected 30 m above sea surface), superimposed on the 24-h beat of incoming solar flux as represented by the photo-synthetically active radiation (PAR). Time series are punctuated by abrupt spikes at dawn and drops at dusk. The diel rhythm (away from land) is evident, ubiquitous, and persists on cloudy days. Pollution origin of this cycle is ruled out by the 48-h back-trajectories. B Aerosol composition determined by SEM-EDX for geometrical diameters (Dgeo) > 0.3 μm. N and D denote night and day, respectively. This is compelling evidence for the marine origin of the aerosols. The collection filters were replaced at about 08:00–09:30 and 20:00–21:30 (see Supplementary Table 1 in the SI for timing details). C Twenty-hour signal of marine particle size index γ (vertical axis inverted), where the mean particle size increases during the day and decreases during the night. Data collected at 0.5–3 m below the sea surface.
Fig. 4
Fig. 4. Dependence of the sea spray aerosol number concentration with optical diameters (Dop) ≥ 0.58 μm (NSSA ≥ 0.58 µm) on wind speed.
Box plots of the NSSA ≥ 0.58 µm vs. wind speed, binned at 2 ms−1 for the Pacific Ocean (A) and by 4 ms−1 for the Atlantic Ocean (B) where data collected further than 100 km away from land was used. The day and night data are offset for clarity. The y-axis scale is different for the two panels. While the expected increase of aerosol concentration with wind speed is indeed observed, no relation between the 24-h cycle and wind speed is found. The box plots show the median, and the 10th, 25th, 75th, and 90th percentiles. For the daytime (nighttime) Pacific Ocean, N = 3612 (4057), 11,638 (14,833), 20,134 (19,506), 19,988 (23,136), 15,701 (16,097), and 8129 (9034) samples where used for the 0–2, 2–4, 4–6, 6–8, 8–10, and >10 m s−1 bins, respectively. For the daytime (nighttime) Atlantic Ocean, N = 1089 (949), 4768 (5056), and 1082 (1707) samples were used for the 0–4, 4–8, and >8 m s−1 bins, respectively.
Fig. 5
Fig. 5. Dependence of the day-to-nighttime ratio (DNR) of the sea spray aerosol number concentration with an optical diameter (Dop) ≥ 0.58 μm (NSSA ≥ 0.58 µm) on total daytime aerosol count for three different wind speed regimes.
For daily mean wind speeds below 4 ms−1 (black circles), between 4 and 8 ms−1 (orange triangles), and above 8 ms−1 (blue squares) for A all the data, and B a clean atmosphere (i.e., only in the Pacific Ocean at least 100 km away from the continents). N refers to the number of days analyzed. While there is no clear relationship between the DNR of NSSA ≥ 0.58 μm and the wind speed, the DNR tending to one as the total aerosol count increases shows that long-range transport of aerosols can mask the diel cycle.
Fig. 6
Fig. 6. Day-to-night changes of the sea spray aerosol number concentration with optical diameters (Dop) ≥ 0.58 μm (NSSA ≥ 0.58 µm) and the rate of change of γ (∂γ/∂t (hr−1)).
A Box plot analysis of the 282 days with the 24-h cycle in the Pacific Ocean shows the compelling statistical significance of the day and night counts. B Box plot analysis of the γ rate of change (vertical axis inverted) for the 167 days (near the Pacific islands, Japan, and Taiwan there is no data). Statistically significant day to night variation is readily discernible. The box plots show the median, and the 5th, 25th, 75th, and 95th percentiles; the orange line is the mean. N refers to the number of days analyzed.

References

    1. Flores JM, et al. Tara Pacific expedition’s atmospheric measurements of marine aerosols across the Atlantic and Pacific Oceans: overview and preliminary results. Bull. Am. Meteorological Soc. 2020;101:E536–E554. doi: 10.1175/BAMS-D-18-0224.1. - DOI
    1. Mayol E, et al. Long-range transport of airborne microbes over the global tropical and subtropical ocean. Nat. Commun. 2017;8:201. doi: 10.1038/s41467-017-00110-9. - DOI - PMC - PubMed
    1. D. A. Gillette, “Environmental Factors Affecting Dust Emission by Wind Erosion,” In: C. Morales, Ed., Saharan Dust, Scope 14, John Wiley & Sons, New York, 1979, pp. 71–91.
    1. Lewis, R. & Schwartz, E. Sea Salt Aerosol Production: Mechanisms, Methods, Measurements and Models—a Critical Review Vol. 152 (American Geophysical Union, 2004).
    1. de Leeuw, G. et al. in Ocean-Atmosphere Interactions of Gases and Particles (eds. Liss, P. S. & Johnson, M. T.) 171–246 (Springer Berlin Heidelberg, 2014).

Publication types