. 2021 Sep 16;12(1):5483.
doi: 10.1038/s41467-021-25646-9.

The biogeographic differentiation of algal microbiomes in the upper ocean from pole to pole

Affiliations

The biogeographic differentiation of algal microbiomes in the upper ocean from pole to pole

Kara Martin et al. Nat Commun. .

Abstract

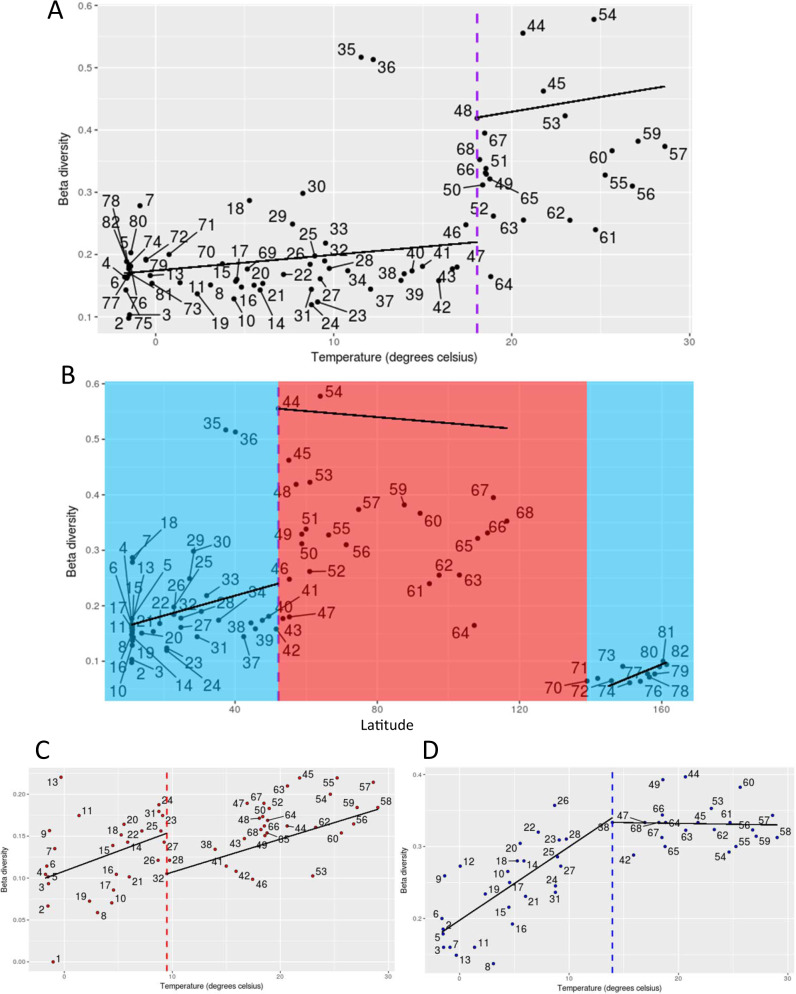
Eukaryotic phytoplankton are responsible for at least 20% of annual global carbon fixation. Their diversity and activity are shaped by interactions with prokaryotes as part of complex microbiomes. Although differences in their local species diversity have been estimated, we still have a limited understanding of environmental conditions responsible for compositional differences between local species communities on a large scale from pole to pole. Here, we show, based on pole-to-pole phytoplankton metatranscriptomes and microbial rDNA sequencing, that environmental differences between polar and non-polar upper oceans most strongly impact the large-scale spatial pattern of biodiversity and gene activity in algal microbiomes. The geographic differentiation of co-occurring microbes in algal microbiomes can be well explained by the latitudinal temperature gradient and associated break points in their beta diversity, with an average breakpoint at 14 °C ± 4.3, separating cold and warm upper oceans. As global warming impacts upper ocean temperatures, we project that break points of beta diversity move markedly pole-wards. Hence, abrupt regime shifts in algal microbiomes could be caused by anthropogenic climate change.


Conflict of interest statement

The authors declare no competing interests.

Figures

Fig. 1
Fig. 1. Sampling sites and environmental metadata.
A Stations for metatranscriptome sequencing (green) and 16 and 18S rDNA amplicon sequencing (red). Map was generated using Ocean Data view. B Latitude versus temperature (degree celsius). C Latitude versus nitrate and nitrite concentrations. D Latitude versus silicate concentrations. E Latitude versus phosphate concentrations. Nutrient concentrations in µmol L−1.
Fig. 2
Fig. 2. Co-occurrence networks of protein families in eukaryotic metatranscriptomes and their gene ontology.
On the log10-scaled gene counts of protein families (Pfams), two networks were found: A blue = warm (n = 1614) and turquoise = cold (n = 2369). B Co-occurrence analysis of Pfam protein families dataset, two networks were found, a turquoise (cold) and blue (warm), and also a grey (2 Pfams: no network). Correlation heatmap between the networks and environmental parameters. The colours correspond to the correlation values, red is positively correlated and blue is negatively correlated. The values in each of the squares correspond to the assigned Pearson correlation coefficient value on top and p-value in brackets below. C Gene ontology (GO) analysis of the co-occurrence of Pfam protein families dataset for both co-occurrence networks.
Fig. 3
Fig. 3. Biogeographical mapping of the node-specific abundance for each protein family (Pfams) network across all stations from pole to pole.
Contribution of Pfam containing sequences from individual metatranscriptome sites to corresponding protein family co-occurrence networks. Bubbles scaled according to percentage contribution to total abundance pool. A Pfam biogeography of cold co-occurrence network and B Pfam biogeography of warm co-occurrence network. Abundance is given in percentage contribution to the total sequence pool per site with increasing contribution from small to large circles and from blue to red.
Fig. 4
Fig. 4. Co-occurrence networks of 16 and 18S rDNAs, their biodiversity and biogeographical mapping of the node-specific abundance for each taxonomic network across all stations from pole to pole.
On the log10 transformed abundances of 18S rDNA species level and 16S rDNA genus level, two networks were found: A cold (n = 51) and warm (n = 70). A list of species names and class names of the species can be found in the Supplementary Table 2. B Co-occurrence analysis of 18S rDNA species level and 16S rDNA genus level, two networks were found, a turquoise (cold) and blue (warm). Correlation heatmap between the networks and environmental parameters. The colours correspond to the correlation values, red is positively correlated and blue is negatively correlated. The values in each of the squares correspond to the assigned Pearson correlation coefficient value on top and p-value in brackets below. C Taxa biogeography of cold 16/18S co-occurrence network. D Taxa biogeography of warm 16/18S co-occurrence network. Abundance is given in percentage contribution to the total sequence pool per site with increasing contribution from small to large circles and from blue to red.
Fig. 5
Fig. 5. Beta diversity break-point analyses.
A,B Represent breakpoints of protein families as part of the metatranscriptome dataset. C, D Represent breakpoints of the 18S rDNA and 16S rDNA datasets. The numbers correspond to sample locations as shown in Fig. 1A. The y-axis represents beta diversity across all stations. The x-axis in A, C and D represents temperature and in B represents latitude. The horizontal lines indicate the breakpoints in beta diversity. For the Pfam protein families dataset in (A), the breakpoint is at 18.06 °C with a p-value of 3.741e−10. In B the breakpoint is at 52.167 degrees altered latitude (37.833 degrees latitude) with a p-value of 2.225e−07. For the 16S rDNA dataset in (C), the breakpoint is at 9.49 °C with a p-value of 1.413e−4. For the 18S rDNA dataset in (D), the breakpoint is at 13.96 °C with a p-value of 8.407e−11.
Fig. 6
Fig. 6. IPCC-based modelling of climate driven shifts in beta diversity breakpoints.
Observations (1961–1990) and modelled (2010–2099) changes over the 21st century, in the thresholds for breakpoints in beta diversity. Regions are shown as red for metatranscriptomes (>18.06 °C), orange for 18S (<18.06 °C, >13.96 °C), yellow for 16S (<13.96 °C, >9.49 °C) and blue for temperatures <9.49 °C for a 1961–1990 observations from the HadISST dataset. Modelled estimates temperatures from the HadGEM2-ES CMIP5 run for the 30-year averages, 2010–2039, 2040–2069, and 2070–2099, respectively. Temperatures from HadGEM2-ES have been calibrated to the HadISST observations as described in methods. Black solid line represents the 15 °C and the dashed line the 14 °C average upper ocean temperature.

References

    1. Falkowski PG, Barber RT, Smetacek V. Biogeochemical controls and feedbacks on ocean primary production. Science. 1998;281:200–206. doi: 10.1126/science.281.5374.200. - DOI - PubMed
    1. Pierella Karlusich JJ, Ibarbalz FM, Bowler C. Phytoplankton in the Tara Ocean. Ann. Rev. Mr. Sci. 2020;12:233–265. doi: 10.1146/annurev-marine-010419-010706. - DOI - PubMed
    1. Field CB, Behrenfeld MJ, Randerson JT, Falkowski PG. Primary production of the biosphere: Integrating terrestrial and oceanic components. Science. 1998;281:237–240. doi: 10.1126/science.281.5374.237. - DOI - PubMed
    1. Finlay BJ. Global dispersal of free-living microbial eukaryote species. Science. 2002;296:1061–1063. doi: 10.1126/science.1070710. - DOI - PubMed
    1. Sul, W. J., Oliver, T. A., Ducklow, H. W., Amaral-Zettler, L. A. & Sogin, M. L. Marine bacteria exhibit a bipolar distribution. Proc Natl Acad Sci USA, 110, 2342–2347 (2013). - PMC - PubMed

Publication types

MeSH terms