. 2021 Sep 16;12(1):5485.
doi: 10.1038/s41467-021-25760-8.

Activation of anionic redox in d0 transition metal chalcogenides by anion doping

Affiliations

Activation of anionic redox in d0 transition metal chalcogenides by anion doping

Bernhard T Leube et al. Nat Commun. .

Abstract

Expanding the chemical space for designing novel anionic redox materials from oxides to sulfides has enabled to better apprehend fundamental aspects dealing with cationic-anionic relative band positioning. Pursuing with chalcogenides, but deviating from cationic substitution, we here present another twist to our band positioning strategy that relies on mixed ligands with the synthesis of the Li2TiS3-xSex solid solution series. Through the series the electrochemical activity displays a bell shape variation that peaks at 260 mAh/g for the composition x = 0.6 with barely no capacity for the x = 0 and x = 3 end members. We show that this capacity results from cumulated anionic (Se2-/Sen-) and (S2-/Sn-) and cationic Ti3+/Ti4+ redox processes and provide evidence for a metal-ligand charge transfer by temperature-driven electron localization. Moreover, DFT calculations reveal that an anionic redox process cannot take place without the dynamic involvement of the transition metal electronic states. These insights can guide the rational synthesis of other Li-rich chalcogenides that are of interest for the development of solid-state batteries.


Conflict of interest statement

The authors declare no competing interests.

Figures

Fig. 1
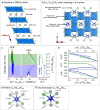
Fig. 1. Structural and electrochemical characterization of Li2TiS3 − xSex.
a PXRD patterns of synthesized materials in Li2TiS3 − xSex: a shift towards lower 2θ angles (higher d-spacing) is observed upon Se introduction. b Lattice parameters refined in R3¯m plotted against the Se content x in Li2TiS3 − xSex. c Voltage traces of the first two galvanostatic cycles. d Change of the differential capacity dQ/dE of the first oxidation process with Se doping. The lowering of the activation potential indicates successful manipulation of the anionic band. The decreased voltage is consistent with increased covalency of Ti–Se bonds compared to Ti–S bonds and with the lower chemical hardness of Se compared to S. e Gravimetric discharge capacity of the first discharge process (black) and the electrochemical activity (amount of removable Li upon the first oxidation) (red).
Fig. 2
Fig. 2. Electrochemistry of Li2TiS2.4Se0.6 and Li2TiS1.5Se1.5.
a Voltage trace of Li2TiS2.4Se0.6 during 25 cycles (discharge-voltage drops from 2.33 to 2.25 V), inset: dQ/dE vs E for the 1st, 2nd and 25th cycle. b GITT experiment of Li2TiS2.4Se0.6. c GITT experiment of Li2TiS2.4Se0.6, inset: comparison of discharge energy of Li2TiS2.4Se0.6 with Li2TiS1.5Se1.5 during the first 25 cycles.
Fig. 3
Fig. 3. Crystal structure of LiyTiS2.4Se0.6.
a Structure of Li2TiS2.4Se0.6 shown along the stacking axis: Li and Ti occupy all octahedral interstices present in the cubic close packing of Ch2− anions. Partial ordering of the cations leads to the formation of [Li]Ch2 and [Li1/3Ti2/3]Ch2 layers. b Representation of the mixed [Li1/3Ti2/3]Ch2 slab: the partial ordering of Li vs Ti. c Evolution of the PXRD patterns of LiyTiS2.4Se0.6 during the 1st cycle of an operando PXRD experiment. d Corresponding evolution of the lattice parameters of LiyTiS2.4Se0.6 (space group: R3¯m). e, f Local bonding environments around Ti1 of pristine Li2TiS2.4Se0.6 and fully discharged Li2TiS2.4Se0.6 (color code: blue: Ti, gray: Li, green: S, pink: Se).
Fig. 4
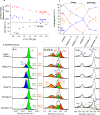
Fig. 4. XPS/HAXPES experiments on LiyTiS3 − xSex.
a Binding energy difference ΔE(Ti–Ch) and the amount of partially Sen as a function of x in pristine Li2TiS3 − xSex as deduced from XPS data. b HAXPES S 1s, S 2p/Se 3p and Ti 2p spectra of LiyTiS2.4Se0.6 at different states of charge. c Proportion of reduced Ch2− and partially oxidized Chn in LiyTiS2.4Se0.6 at different states of charge as deduced from HAXPES spectra.
Fig. 5
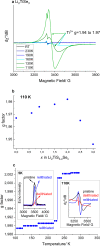
Fig. 5. EPR results on Li2TiS3 − xSex.
a Temperature-dependent EPR spectra of Li2TiSe3 (b) evolution of the g-factor in Li2TiS3 − xSex at 110 K. c Main: temperature dependence of the g-factor of relithiated LiyTiS2.4Se0.6. Inset: EPR spectra of pristine Li2TiS2.4Se0.6 (black), delithiated LiyTiS2.4Se0.6 (red) and relithiated LiyTiS2.4Se0.6 (blue) at 5 and 110 K, respectively.
Fig. 6
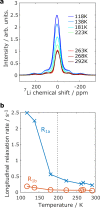
Fig. 6. Solid-state NMR on Li2TiSe3.
a Static 7Li spectra as a function of temperature. b 7Li longitudinal relaxation components R1a and R1b plotted against temperature.
Fig. 7
Fig. 7. Theoretical calculations on LiyTiS3 − xSex.
a Projected density of states (pDOS) of Li2TiS3, Li2TiSe3, and Li2TiS1.5Se1.5. b Fukui functions computed to probe the electronic states involved in the oxidation process for the Li2TiS3, Li2TiSe3, and mixed Li2TiS1.5Se1.5 electrodes: these results clearly show that the holes generated upon oxidation (yellow volume) are mainly localized on the Ch (S and Se) anions for the pure-S and pure-Se electrodes, while the transition metal (Ti) is also involved for the mixed S/Se phases. Note that the Se selectivity in the mixed S/Se electrode is also clearly seen with a larger hole density around Se (pink atoms) much larger than around S (green atoms), therefore highlighting the Se selectivity in the mixed phases. c Atomic Bader net populations of the most oxidized S and Se atoms in the structure as a function of the Li content showing that Se is much more oxidized and S is much less oxidized in mixed S/Se compared to pure-S and pure-Se phases for an equivalent number of extracted lithium. All calculations were performed with the metaGGA SCAN functional (see “Methods” section).

References

    1. Assat G, Tarascon J-M. Fundamental understanding and practical challenges of anionic redox activity in Li-ion batteries. Nat. Energy. 2018;3:373–386. doi: 10.1038/s41560-018-0097-0. - DOI
    1. Li M, et al. Cationic and anionic redox in lithium-ion based batteries. Chem. Soc. Rev. 2020;49:1688–1705. doi: 10.1039/C8CS00426A. - DOI - PubMed
    1. Jiang J, Eberman KW, Krause LJ, Dahn JR. Structure, electrochemical properties, and thermal stability studies of cathode materials in the xLi[Mn1/2Ni1/2]O2⋅yLiCoO2⋅zLi[Li1/3Mn2/3]O2 pseudoternary system (x+y+z=1) J. Electrochem. Soc. 2005;152:A1879. doi: 10.1149/1.1995690. - DOI
    1. Thackeray MM, et al. Li2MnO3-stabilized LiMO2 (M = Mn, Ni, Co) electrodes for lithium-ion batteries. J. Mater. Chem. 2007;17:3112–3125. doi: 10.1039/b702425h. - DOI
    1. Ben Yahia M, Vergnet J, Saubanère M, Doublet M-L. Unified picture of anionic redox in Li/Na-ion batteries. Nat. Mater. 2019;18:496–502. doi: 10.1038/s41563-019-0318-3. - DOI - PubMed