

Single-cell adhesion strength and contact density drops in the M phase of cancer cells
- PMID: 34531409
- PMCID: PMC8445979
- DOI: 10.1038/s41598-021-97734-1
Single-cell adhesion strength and contact density drops in the M phase of cancer cells
Abstract
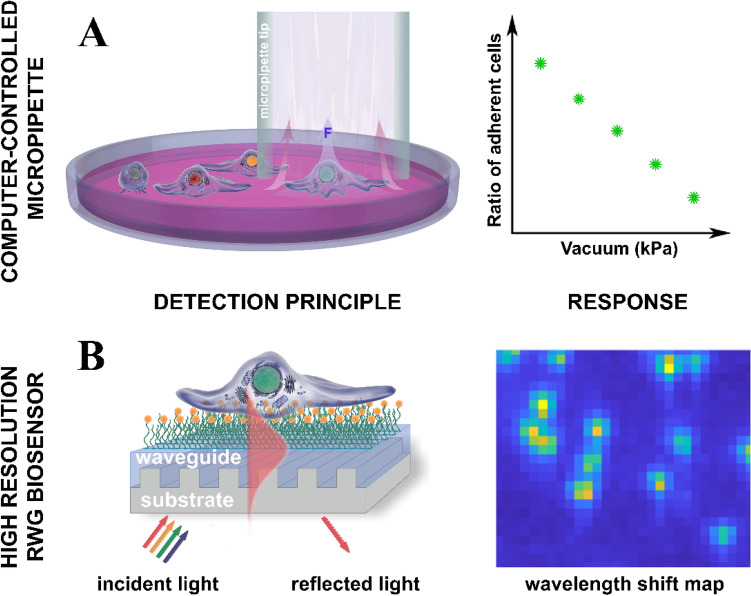
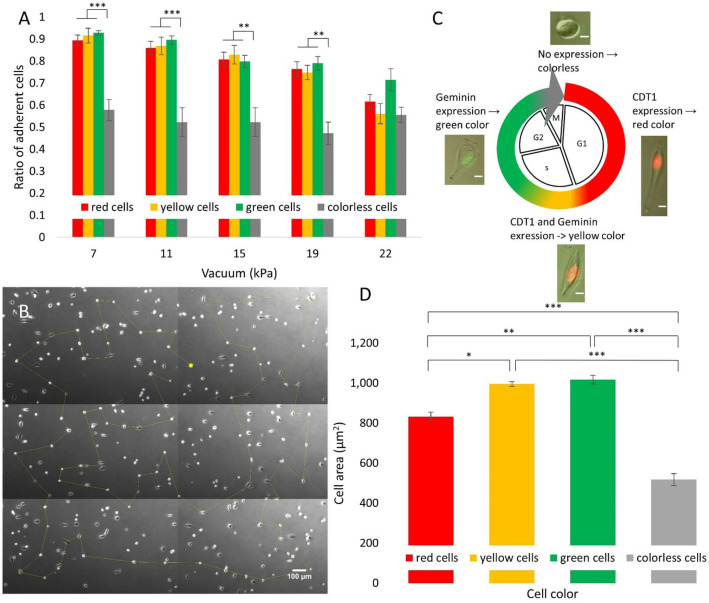
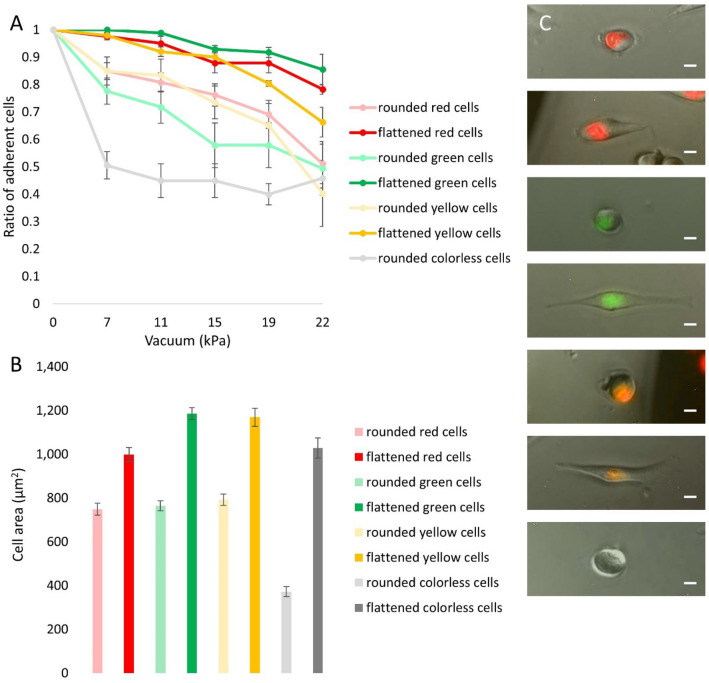
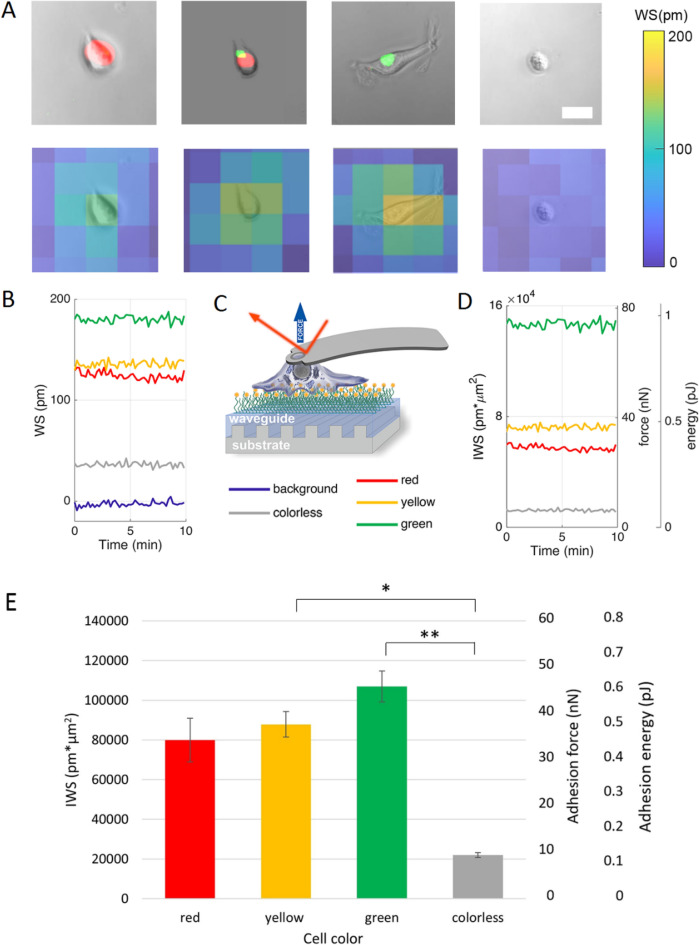
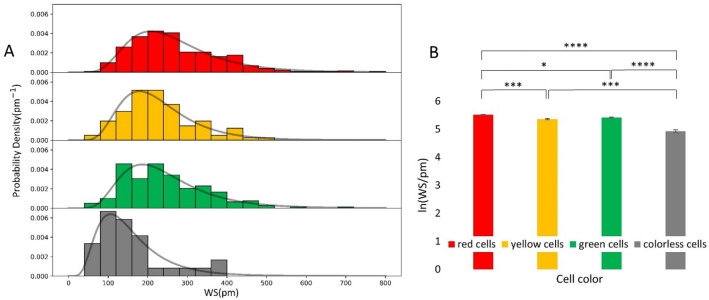
The high throughput, cost effective and sensitive quantification of cell adhesion strength at the single-cell level is still a challenging task. The adhesion force between tissue cells and their environment is crucial in all multicellular organisms. Integrins transmit force between the intracellular cytoskeleton and the extracellular matrix. This force is not only a mechanical interaction but a way of signal transduction as well. For instance, adhesion-dependent cells switch to an apoptotic mode in the lack of adhesion forces. Adhesion of tumor cells is a potential therapeutic target, as it is actively modulated during tissue invasion and cell release to the bloodstream resulting in metastasis. We investigated the integrin-mediated adhesion between cancer cells and their RGD (Arg-Gly-Asp) motif displaying biomimetic substratum using the HeLa cell line transfected by the Fucci fluorescent cell cycle reporter construct. We employed a computer-controlled micropipette and a high spatial resolution label-free resonant waveguide grating-based optical sensor calibrated to adhesion force and energy at the single-cell level. We found that the overall adhesion strength of single cancer cells is approximately constant in all phases except the mitotic (M) phase with a significantly lower adhesion. Single-cell evanescent field based biosensor measurements revealed that at the mitotic phase the cell material mass per unit area inside the cell-substratum contact zone is significantly less, too. Importantly, the weaker mitotic adhesion is not simply a direct consequence of the measured smaller contact area. Our results highlight these differences in the mitotic reticular adhesions and confirm that cell adhesion is a promising target of selective cancer drugs as the vast majority of normal, differentiated tissue cells do not enter the M phase and do not divide.
© 2021. The Author(s).
Conflict of interest statement
B.S. is a founder of CellSorter Company that developed the computer-controlled-micropipette device we used in our experiments.
Figures
Similar articles
-
Glycocalyx regulates the strength and kinetics of cancer cell adhesion revealed by biophysical models based on high resolution label-free optical data.Sci Rep. 2020 Dec 30;10(1):22422. doi: 10.1038/s41598-020-80033-6. Sci Rep. 2020. PMID: 33380731 Free PMC article.
-
Population distributions of single-cell adhesion parameters during the cell cycle from high-throughput robotic fluidic force microscopy.Sci Rep. 2022 May 11;12(1):7747. doi: 10.1038/s41598-022-11770-z. Sci Rep. 2022. PMID: 35546603 Free PMC article.
-
Single-cell adhesion force kinetics of cell populations from combined label-free optical biosensor and robotic fluidic force microscopy.Sci Rep. 2020 Jan 9;10(1):61. doi: 10.1038/s41598-019-56898-7. Sci Rep. 2020. PMID: 31919421 Free PMC article.
-
Integrins in cell adhesion and signaling.Hum Cell. 1996 Sep;9(3):181-6. Hum Cell. 1996. PMID: 9183647 Review.
-
Analyzing the anatomy of integrin adhesions.Sci Signal. 2011 Apr 26;4(170):jc3. doi: 10.1126/scisignal.2001896. Sci Signal. 2011. PMID: 21521876 Review.
Cited by
-
Tension-induced adhesion mode switching: the interplay between focal adhesions and clathrin-containing adhesion complexes.bioRxiv [Preprint]. 2024 Feb 8:2024.02.07.579324. doi: 10.1101/2024.02.07.579324. bioRxiv. 2024. PMID: 38370749 Free PMC article. Preprint.
-
Label-free biomolecular and cellular methods in small molecule epigallocatechin-gallate research.Heliyon. 2024 Feb 5;10(3):e25603. doi: 10.1016/j.heliyon.2024.e25603. eCollection 2024 Feb 15. Heliyon. 2024. PMID: 38371993 Free PMC article. Review.
-
Determination of the Minimum Cell-to-Cell Adhesion Time Using Optical Tweezers in Leukemia and Lymphoma Research.Methods Protoc. 2025 Jun 4;8(3):59. doi: 10.3390/mps8030059. Methods Protoc. 2025. PMID: 40559447 Free PMC article.
-
Discoidin Domain Receptors in Tumor Biology and Immunology: Progression and Challenge.Biomolecules. 2025 Jun 7;15(6):832. doi: 10.3390/biom15060832. Biomolecules. 2025. PMID: 40563472 Free PMC article. Review.
-
The maximum size of cell-aggregates is determined by the competition between the strain energy and the binding energy of cells.Heliyon. 2024 Nov 20;10(23):e40560. doi: 10.1016/j.heliyon.2024.e40560. eCollection 2024 Dec 15. Heliyon. 2024. PMID: 39654728 Free PMC article.
References
-
- Alberts B, et al. Molecular Biology of the Cell. 5. Garland Science; 2007.
-
- Albelda SM. Role of integrins and other cell adhesion molecules in tumor progression and metastasis. Lab. Invest. 1993;68:4–17. - PubMed
-
- Rao CCG, et al. Expression of epithelial cell adhesion molecule in carcinoma cells present in blood and primary and metastatic tumors. Int. J. Oncol. 2005;27:49–57. - PubMed
Publication types
MeSH terms
LinkOut - more resources
Full Text Sources
Research Materials
