. 2021 Sep 16;11(1):18516.
doi: 10.1038/s41598-021-97765-8.

A forward genetic screen identifies modifiers of rocaglate responsiveness

Affiliations

A forward genetic screen identifies modifiers of rocaglate responsiveness

Leo Shen et al. Sci Rep. .

Abstract

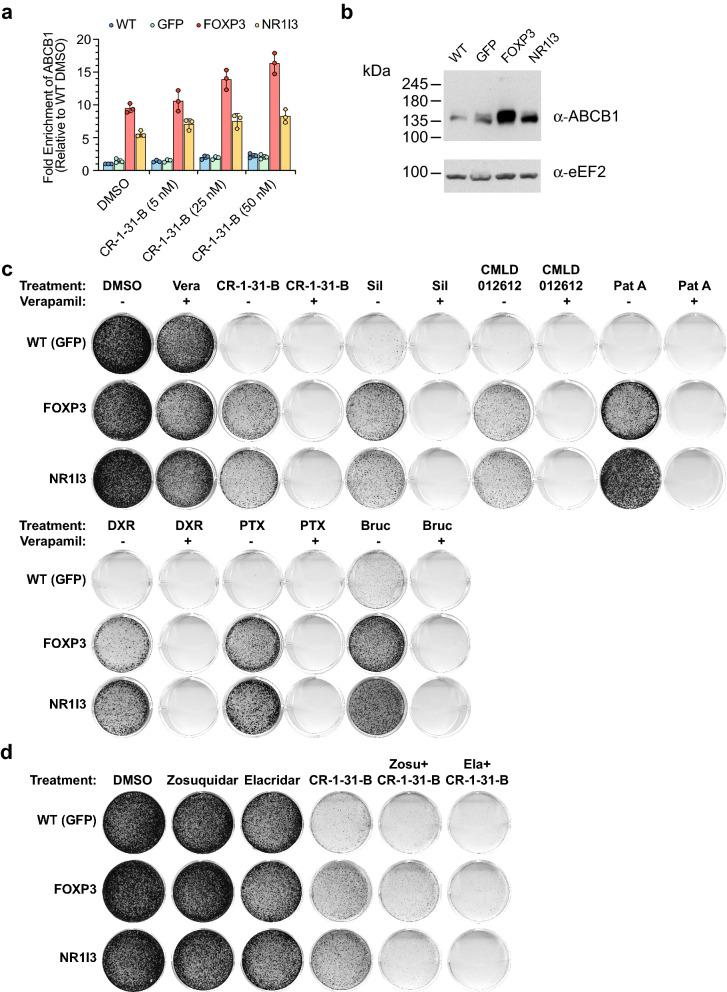
Rocaglates are a class of eukaryotic translation initiation inhibitors that are being explored as chemotherapeutic agents. They function by targeting eukaryotic initiation factor (eIF) 4A, an RNA helicase critical for recruitment of the 40S ribosome (and associated factors) to mRNA templates. Rocaglates perturb eIF4A activity by imparting a gain-of-function activity to eIF4A and mediating clamping to RNA. To appreciate how rocaglates could best be enabled in the clinic, an understanding of resistance mechanisms is important, as this could inform on strategies to bypass such events as well as identify responsive tumor types. Here, we report on the results of a positive selection, ORFeome screen aimed at identifying cDNAs capable of conferring resistance to rocaglates. Two of the most potent modifiers of rocaglate response identified were the transcription factors FOXP3 and NR1I3, both of which have been implicated in ABCB1 regulation-the gene encoding P-glycoprotein (Pgp). Pgp has previously been implicated in conferring resistance to silvestrol, a naturally occurring rocaglate, and we show here that this extends to additional synthetic rocaglate derivatives. In addition, FOXP3 and NR1I3 impart a multi-drug resistant phenotype that is reversed upon inhibition of Pgp, suggesting a potential therapeutic combination strategy.


Conflict of interest statement

The authors declare no competing interests.

Figures

Figure 1
Figure 1
Forward genetic screen for modifiers of CR-1-31-B response. (a) Structures of the rocaglates: silvestrol, CR-1-31-B, CMLD012612, and SDS-1-021. (b) Titration of CR-1-31-B for 48 h onto Hap1 cells, with cell viability measured by absorbance readings at OD550 following SRB staining. n = 3 ± SD. (c) Diagram visually depicting the process of cDNA overexpression, positive selection, and pooled functional genomic screening in Hap1 cells. (d) Scatter plot depicting the statistical significance (P-value as calculated by MAGeCK) of the ORF enrichment plotted against the log2 fold change in expression relative to the DMSO control. Labeled genes were selected for further validation.
Figure 2
Figure 2
Validation of top candidates for resistance against CR-1-31-B. (a) Western blot verifying expression of V5-tagged cDNA constructs transduced into Hap1 cells. Uncropped scans are in Fig. S4. (b) Competition assay, wherein negative control, GFP-expressing Hap1 cells were mixed 1:1 with the cell line of interest, and subsequent enrichment of the GFP-negative fraction (cell line of interest) was monitored via flow cytometry following CR-1-31-B treatment (2.5 or 5 nM). Measurements were obtained on day 9 and computed as fold changes over the DMSO-treated condition. For some cell lines, data for 5 nM CR-1-31-B treatment is missing as too few cells survived to reach the event threshold (5000) during acquisition. n = 3 ± SD, statistical significance determined using 2-way ANOVA followed by Dunnett's multiple comparisons test. The other comparisons in this panel do not fall below 0.05 and were not further considered. (c) Representative experiments from colony formation assays in various Hap1 cell lines following CR-1-31-B treatment for 6–14 days are shown. One representative experiment from at least three biological replicates is presented.
Figure 3
Figure 3
FOXP3 and NR1I3 confer a robust multi-drug cross-resistant phenotype. (a) Structures of Pat A and Hipp. (b) Competition assays with GFP+-transduced or gene-of interest-transduced Hap1 cells exposed to silvestrol, CMLD012612, or Pat A. Fold change relative to the GFP+ transduced cell line on day 0 is shown. n = 3 ± SD, statistical significance determined using a two-way ANOVA, followed by Dunnett’s multiple comparison test. P-value cut-offs: ns (P > 0.05), *(0.05 ≥ P ≤ 0.01), **(0.01 ≥ P ≤ 0.001), ***(0.001 ≥ P ≤ 0.0001), **** (P ≤ 0.0001). (c) Representative experiments from colony formation assays in the indicated Hap1 cell lines following treatment with eIF4A inhibitors for 6–21 days are shown. n ≥ 3. (d) Representative experiments from colony formation assays in the indicated Hap1 cell lines following exposure to compounds for 6–21 days. n ≥ 3.
Figure 4
Figure 4
Transcriptomic profiling by RNAseq from FoxP3-expressing cells. (a) Volcano plot of RNASeq results from FoxP3-expressing compared to GFP-expressing cells, as determined by edgeR. Blue dots: transcripts with a log2FC ≥ 1. Red dots: transcripts with a log2FC ≤ − 1. Summary of results (55 genes significantly upregulated, 53 significantly downregulated, P < 0.05). (b) GO enrichment analysis predictions of the effects of FOXP3 overexpression on Hap1 cells. Shown are the logarithms of the Benjamini–Hochberg corrected P-values. Overlap represents the number of genes per GO term, represented as fractions and percentages. (c) Western blot documenting expression of ABCB1 in transduced Hap1 cells. Uncropped scans are in Fig. S5. (d) Titration of silvestrol onto the indicated Hap1 cells, with cell viability measured 48 h later by SRB staining. n = 3 ± SD. (e) Representative experiments from three colony formation assays in Hap1 cells treated with the indicated compounds for 6–14 days.
Figure 5
Figure 5
Inhibition of ABCB1 reverses the MDR phenotype in FOXP3- and NR1I3-expressing cells. (a) ABCB1 mRNA levels in wild-type (WT), GFP-, FOXP3-, and NR1I3-expressing Hap1 cells were measured by RT-qPCR across 4 conditions (DMSO, 5/25/50 nM CR-1-31-B for 6 h). n = 3 ± SD. (b) Western blot documenting ABCB1 expression in wild-type (WT), GFP-, FOXP3-, and NR1I3-expressing Hap1 cells. Uncropped scans are in Fig. S5. (c) Representative experiments from colony formation assays in Hap1 cells following compound treatment in the presence or absence of verapamil for 4–14 days. n ≥ 3. Compounds and concentrations were: 10 µM verapamil (Vera), 5 nM CR-1-31-B, 50 nM silvestrol (Sil), 10 nM CMLD012612 (012612), 1 nM Pat A, 12 ng/mL doxorubicin (DXR), 15 nM paclitaxel (PTX), 10 nM bruceantin (Bruc). (d) Representative experiments from colony formation assays in Hap1 cells following 5 nM CR-1-31-B treatment in the presence or absence of zosuquidar or elacridar for 4–14 days. n ≥ 3.

References

    1. Zhang Y, et al. A pan-cancer proteogenomic atlas of PI3K/AKT/mTOR pathway alterations. Cancer Cell. 2017;31:820–832. doi: 10.1016/j.ccell.2017.04.013. - DOI - PMC - PubMed
    1. Chu J, Cargnello M, Topisirovic I, Pelletier J. Translation initiation factors: Reprogramming protein synthesis in cancer. Trends Cell Biol. 2016;26:918–933. doi: 10.1016/j.tcb.2016.06.005. - DOI - PubMed
    1. Silvera D, Formenti SC, Schneider RJ. Translational control in cancer. Nat. Rev. Cancer. 2010;10:254–266. doi: 10.1038/nrc2824. - DOI - PubMed
    1. Stumpf CR, Ruggero D. The cancerous translation apparatus. Curr. Opin. Genet. Dev. 2011;21:474–483. doi: 10.1016/j.gde.2011.03.007. - DOI - PMC - PubMed
    1. Bhat M, et al. Targeting the translation machinery in cancer. Nat. Rev. Drug Discov. 2015;14:261–278. doi: 10.1038/nrd4505. - DOI - PubMed

Publication types

MeSH terms

Substances