. 2021 Sep;3(9):1150-1162.
doi: 10.1038/s42255-021-00440-5. Epub 2021 Sep 16.

SREBP1-induced fatty acid synthesis depletes macrophages antioxidant defences to promote their alternative activation

Affiliations

SREBP1-induced fatty acid synthesis depletes macrophages antioxidant defences to promote their alternative activation

Guillaume Bidault et al. Nat Metab. 2021 Sep.

Abstract

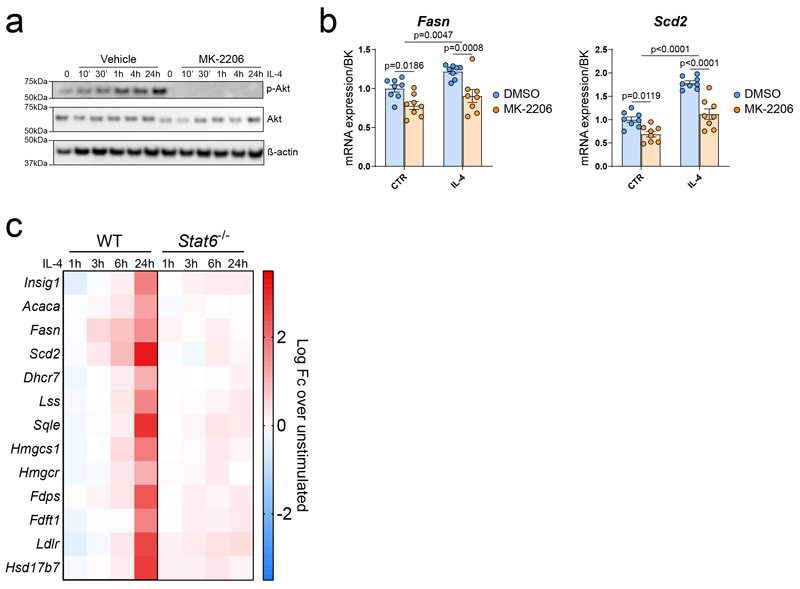
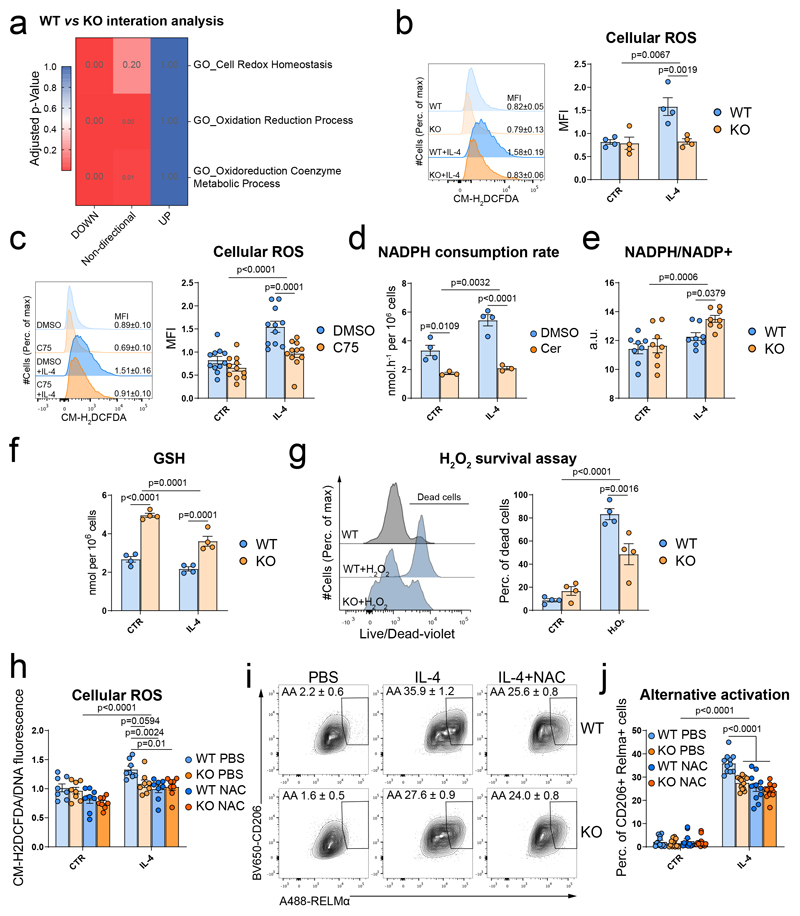
Macrophages exhibit a spectrum of activation states ranging from classical to alternative activation1. Alternatively, activated macrophages are involved in diverse pathophysiological processes such as confining tissue parasites2, improving insulin sensitivity3 or promoting an immune-tolerant microenvironment that facilitates tumour growth and metastasis4. Recently, the metabolic regulation of macrophage function has come into focus as both the classical and alternative activation programmes require specific regulated metabolic reprogramming5. While most of the studies regarding immunometabolism have focussed on the catabolic pathways activated to provide energy, little is known about the anabolic pathways mediating macrophage alternative activation. In this study, we show that the anabolic transcription factor sterol regulatory element binding protein 1 (SREBP1) is activated in response to the canonical T helper 2 cell cytokine interleukin-4 to trigger the de novo lipogenesis (DNL) programme, as a necessary step for macrophage alternative activation. Mechanistically, DNL consumes NADPH, partitioning it away from cellular antioxidant defences and raising reactive oxygen species levels. Reactive oxygen species serves as a second messenger, signalling sufficient DNL, and promoting macrophage alternative activation. The pathophysiological relevance of this mechanism is validated by showing that SREBP1/DNL is essential for macrophage alternative activation in vivo in a helminth infection model.


Conflict of interest statement

Declaration of interests

K.P. is currently employed by AstraZenaca. J.S-R. has received funding from GSK and Sanofi and consultant fees from Travere Therapeutics. All the other authors declare no competing interests.

Figures

Extended Data Fig. 1
a, Protein expression of phosphorylated (Ser473) and total Akt in Vehicle (DMSO) or MK-2206-treated BMMФ in response to IL-4. Representative picture of n=4 biological replicates. b, mRNA expression over BK of the SREBP1 target genes Fasn and Scd2 AKT in Vehicle (DMSO) or MK-2206-treated BMMФ in response to IL-4. Data are presented as the mean ± SEM of n=8 biological replicates from 2 independent experiments. c, Gene expression analysis of the SREBP target genes in WT and Stat6-/- BMMФ. Data analysed from the publicly available dataset (GSE106706) with FDR<0.05 and Fc>2. Data has been analysed using a 2-way ANOVA followed by Sidak post-hoc test.
Extended Data Fig. 2
a-d, mRNA expression of the SREBP1 target genes Fasn and Scd2 and of the macrophages alternative activation markers Retnla and Mgl2 in BMMФ treated with SIRT1 activator II (a) or SIRT1 inhibitor (EX-527, b) or the AMPK inhibitor Compound C (c) or the AMPK activator AICAR (d) in response to IL-4. Data are presented as the mean ± SEM of n=4 biological replicates per group. e and f, mRNA expression over BK of the SREBP1 target genes in 25-hydroxycholesterol-treated (25HC, n=8 biological replicates from 2 independent experiments) (e) or SREBP-1c KO (n=3 biological replicates) (f) BMMФ in response to IL-4. Data has been analysed using a 2-way ANOVA followed by a Dunnett (a-d) or Sidak (e and f) post-hoc test.
Extended Data Fig. 3
a and b, mRNA expression of Retnla and Mgl1 (a) and Tnf and Il1b (b) in WT and SCAP-KO BMMФ, 4h and 24h post IL-4 stimulation. mRNA expression over BK as mean ± SEM of n=8 biological replicates from 2 independent experiments. c, Alternative activation of Vehicle (EtOH) or 25-hydroxycholesterol (25HC)-treated BMMФ in response to IL-4. Alternative activation was assessed by the expression of RELMα and CD206 by flow cytometry. The quantification of the number of alternatively activated macrophages is presented as mean ± SEM in d. Data of n=4 biological replicates per group. e, Expression of the macrophage alternative activation markers Mrc1, Mgl1 Retlna and Arg1 in Vehicle (EtOH) or 25-hydroxycholesterol (25HC)-treated BMMФ in response to IL-4. mRNA expression over BK as mean ± SEM of n=4 biological replicates per group. f, Expression of the macrophage alternative activation markers of Mrc1, Arg1 and Mgl1 in WT and SREBP1c-KO BMMФ in response to IL-4. mRNA expression over BK of n=3 biological replicates. g, mRNA expression over BK of RAW264.7 macrophages transfected with siRNA against SREBP1, SREBP2 or both in response to IL-4. Data is expressed as mean ± SEM of n=6 different experiments. Data has been analysed using a 2-way ANOVA followed by Sidak (a, b, d-f) or Tukey (g) post-hoc test.
Extended Data Fig. 4
a, Neutrophil number presented as mean ± SEM in the lungs of naïve or 5- and 7-days post N. brasiliensis inoculation in WT and SCAP-KO mice. b, Eosinophil number presented as mean ± SEM in the lungs of naïve or 5- and 7-days post N. brasiliensis inoculation in WT and SCAP-KO mice. c, Percentage of alternatively activated alveolar macrophages in the lungs of naïve 5- and 7-days post N. brasiliensis inoculation in WT and SCAP-KO mice within the alveolar macrophage population. Alternative polarization was quantified by the expression of RELMα and CD206 by flow cytometry. d-f, Interstitial macrophages number (d), percentage of alternative activation (e) and number of alternatively activated interstitial macrophages (f) presented as mean ± SEM in the lungs of naïve or 5- and 7-days post N. brasiliensis inoculation in WT and SCAP-KO mice. g and h, Alveolar (g) and interstitial (h) neutrophil histological score in the lungs of naïve or 5- and 7-days post N. brasiliensis inoculation in WT and SCAP-KO mice. i, Correlation between the alveolar proteinaceous debris score and the number of alveolar macrophages 5 days post N. brasiliensis inoculation in WT and SCAP-KO mice. Pooled data as mean ± SEM n=6-12 mice per group from 2 independent experiments. Data was analyzed using a two-way ANOVA followed by Sidak post-hoc test for comparison between genotypes at different days of post inoculation (a-h) or linear regression modelling (i).
Extended Data Fig. 5
a and b, Gene enrichment analysis of the pathways associated with de novo lipogenesis and SREBP activation from RNA sequencing comparing CTR and IL-4-treated BMMФ or of the interaction effect of IL-4 in WT and SCAP-KO BMMФ. Data from n=6 biological replicates per group. c, Lipid synthesis rate in Lipopolysaccharide (LPS) or IL-4-treated BMMФ. The data represents the incorporation of radiolabelled 14C-acetate in the lipid fraction as mean ± SEM of n=4 biological replicates per group. d, Proportion of newly synthesized palmitate per hour in control or IL-4 stimulated BMMФ. The data are presented as mean ± SEM of n=4 biological replicates. e, Exogenous palmitate uptake rate of control or IL-4 stimulated BMMФ. The data are presented as mean ± SEM of n=4 biological replicates. f, FAME composition in order of increasing chain length and desaturation of WT and SCAP-KO BMMФ in response to IL-4. Data is presented as mean ± SEM of n=4 biological replicates. g, Total, essential and non-essential fatty acid content of WT and SCAP-KO BMMФ in response to IL-4. Data is presented as mean ± SEM of n=4 biological replicates. h, Exogenous palmitate uptake rate of WT and SCAP-KO BMMФ in response to IL-4. The data are presented as mean ± SEM of n=4 biological replicates. Statistical analysis of the RNAseq data is detailed in the methods section. Data has been analysed using a 2-way ANOVA followed by a Dunnett (c) or Sidak post-hoc test (f-h) or a two-tailed Student’s t-test (d and e).
Extended Data Fig. 6
a, Lipid synthesis in BMMФ pre-treated with increasing doses of the FASN inhibitors C75 and cerulenin (Cer) 30 minutes prior 24h IL-4 stimulation. The data represents the incorporation of radiolabelled 14C-acetate in the lipid fraction as mean ± SEM of n=7 biological replicates from 2 independent experiments. b, Expression of the macrophage alternative activation markers Mrc1, Mgl2, Arg1, Retlna and Il4i1 in Vehicle (DMSO) or C75 (10μM)-treated BMMФ in response to IL-4. mRNA expression over BK as mean ± SEM of n=4 biological replicates per group. c, Alternative activation of BMMФ in response to IL-4 and pre-treated with increasing doses of Cerulenin (Cer). Alternative activation was assessed by flow cytometry using the co-expression of RELMα and CD301. The quantification of the number of M(IL-4) macrophages as mean ± SEM of n=4 biological replicates is presented in d. e, Expression of the macrophage alternative activation markers Retlna and Mgl1 in Vehicle (DMSO) or cerulenin (2.5μg/mL)-treated BMMФ in response to IL-4. mRNA expression over BK as mean ± SEM of n=4 biological replicates per group. f, Expression of the inflammatory cytokine Tnf and Il1b in Vehicle (DMSO) or C75 (10μM)-treated BMMФ in response to IL-4. mRNA expression over BK as mean ± SEM of n=4 biological replicates per group. g and h, Expression of the SREBP2-target genes (g) and macrophage activation markers Tnf, Retlna and Mgl2 (h) in Vehicle (DMSO) or Simvastatin (10μM)-treated BMMФ in response to IL-4. mRNA expression over BK as mean ± SEM of n=4 biological replicates per group. i, mRNA expression of the macrophage activation markers Retlna and Mgl2 in Vehicle (DMSO) or C75 (10μM)-treated BMMФ in response to IL-4 supplemented or not with HMG-CoA (1mM). mRNA expression over BK as mean ± SEM of n=4 biological replicates per group. Data has been analysed using a 2-way ANOVA followed by a Dunnett (a and d) or Sidak post-hoc test (e-h) or one-way ANOVA followed by Tukey post-hoc test (i).
Extended Data Fig. 7
mRNA expression of the SREBP1 target genes Fasn and Scd2 in C75-treated (a) or SCAP-KO (c) macrophages and of the macrophages alternative activation markers in C75-treated (b) or SCAP-KO (d) macrophages in response to IL-4 and/or palmitic acid (PA, 10 or 50 μM), oleic acid (OA, 10 or 50 μM) or water-soluble cholesterol (50 μM). mRNA expression of BK of n=4 (C75) or n=3 (SCAP-KO) biological replicates. Data has been analysed using a 2-way ANOVA followed by a Tukey post-hoc test.
Extended Data Fig. 8
a, Gene enrichment analysis of the pathways associated with redox homeostasis and response to oxidative stress in IL-4 treated BMMФ. Data from n=6 biological replicates per group. Data of n=6 biological replicates from 2 independent experiments per group. b, ROS accumulation in Vehicle (EtOH) or 25-hydroxycholesterol (25HC)-treated BMMФ in response to IL-4. ROS were quantified by the fluorescence ratio of CM-H2DCFDA over DNA (Hoechst). Data as mean ± SEM of n=7 biological replicates from 2 independent experiments. c, ROS accumulation in Vehicle (DMSO) or cerulenin (1μg/mL)-treated BMMФ in response to IL-4. ROS were quantified by the median fluorescence intesnity of CM-H2DCFDA by flow cytometry. Data as mean ± SEM of n=4 biological replicates. d, Reactive oxygen species (ROS) levels in BMMФ pre-treated with DPI (NADPH oxidase inhibitor), Allopurinol (xanthine oxidase inhibitor) or L-NAME (nitric oxide synthase inhibitor) prior 24h stimulation with IL-4 or LPS. ROS were quantified by the fluorescence ratio of CM-H2DCFDA over DNA (Hoechst). Data are presented as mean ± SEM of n=4 biological replicates. e, Mitochondrial ROS production in response to IL-4. Mitochondrial ROS levels were determined by the fluorescence ratio of MitoSox over DNA (Hoechst). Data are presented as mean ± SEM of n=8 biological replicates from 2 independent experiments. f, Time-course of fatty acid oxidation in response to IL-4 (10ng/mL). Data of n=4 biological replicates. g and h, Oxygen consumption rate (OCR) in WT and SCAP-KO BMMФ (g) or in Vehicle (DMSO) or C75 (10 μM)-treated BMMФ (h) in control or IL-4 stimulated macrophages. OCR was monitored using an XF-96 Extracellular Flux Analyzer following the sequential treatments with oligomycin (oligo), FCCP and rotenone/antimycin (R/A). Data are presented as mean ± SEM of n=4 (WT vs KO) and n=8 from 2 independent experiments (DMSO vs C75) biological replicates per group. i, Fatty acid oxidation in IL-4 treated BMMФ in response to the AMPK activator AICAR (100 or 500 μM). Data of n=4 biological replicates. j, Lipid synthesis in BMMФ treated with increasing doses of the AMPK activator AICAR in response to IL-4 (10ng/mL, 24h). Data of n=4 biological replicates. k, Fatty acid oxidation assay of SCAP-KO macrophages in response to IL-4 (10ng/mL, 24h). Etomoxir (40 μM) was used as a negative control for FAO. Data of n=4 biological replicates. l, Fatty acid oxidation assay in control or IL-4 stimulated macrophages treated or not with C75 (10 μM) or Cerulenin (1μg/mL) for 24h. Data of n=4 biological replicates. m, ROS levels in C75 (10 μM) and/or Etomoxir (ETO, 40 μM)-treated BMMФ in response to IL-4. ROS were quantified by the fluorescence ratio of CM-H2DCFDA over DNA (Hoechst). Data of n=4 biological replicates. n and o, Mitochondrial ROS production in WT and SCAP-KO BMMФ (n=12 biological replicates from 3 independent experiments) (n) or in Vehicle (DMSO) or C75 (10 μM)-treated (n=12 biological replicates from 3 independent experiments) BMMФ (o) in M(IL-4) macrophages. Mitochondrial ROS levels were determined by the fluorescence ratio of MitoSox over DNA (Hoechst). p, Reduced glutathione (GSH) levels in C75 (10 μM)-treated BMMФ in response to IL-4. Data presented as mean ± SEM of n=4 biological replicates. Data has been analysed using a 2-way ANOVA followed by a Sidak (b, c, k, l and n-p) or Dunnett (d and j) or Tukey (g and h) post-hoc test or a two-tailed Student’s t-test (e) or a one-way ANOVA followed by Dunnett post-hoc test (f and i).
Extended Data Fig. 9
a, ROS levels in N-acetyl cysteine (NAC, 10 mM)-treated BMMФ in response to IL-4. ROS were quantified by the fluorescence ratio of CM-H2DCFDA over DNA (Hoechst). Data as mean ± SEM of n=8 biological replicates from 2 independent experiments. b and c, Alternative activation of NAC-treated BMMФ in response to IL-4. Alternative activation was assessed by the expression of RELMα and CD206 by flow cytometry. The quantification of the number of M(IL-4) macrophages is presented as mean ± SEM in c. Data of n=8 biological replicates from 2 independent experiments. d, mRNA expression over BK of Arg1, Mgl1 and Retnla in NAC-treated BMMФ in response to IL-4. Data as mean ± SEM of n=4 biological replicates. Data was analysed using a two-way ANOVA followed by Sidak post-hoc test.
Extended Data Fig. 10
Extended Data Fig. 10. Schematic representation of the mechanism by which DNL is activated and sensed in alternatively activated macrophages.
Figure 1
Figure 1. SREBP1 activation is a feature of alternatively activated macrophages.
a, Transcriptional regulator analysis of RNA sequencing comparing LPS and IL-4 treated human macrophages (GSE117040). Transcriptional regulators enriched in LPS or IL-4 are represented in red or blue, respectively. b, Transcriptional regulator analysis of RNA sequencing comparing control (CTR) and IL-4 treated bone marrow-derived macrophages (BMMФ). Repressed and activated transcriptional regulators in M(IL-4) BMMФ are respectively presented in red and blue. Data of n=6 biological replicates from 2 independent experiments per group. c, Protein expression of SREBP1 in BMMФ in response to IL-4. The upper band represents full-length (FL) SREBP1 (~125kDa, immature) and the lower band cleaved SREBP1 (~68kDa, mature). Western-blot representative picture of n=3 biological replicates. ß-actin has been used as loading control for the western blot analysis. Quantification of the ratio between cleaved SREBP1 and ß-actin is presented in the panel below as mean ± SEM. d, Gene expression profile of SREBP target genes of as defined by Horton et al. (22) from RNA sequencing comparing CTR and IL-4-treated BMMФ of n=6 biological replicates per group. Repressed and activated genes in M(IL-4) BMMФ are respectively presented in red and blue. e, mRNA expression over the best keeper (BK) of lipopolysaccharide (LPS,100ng/mL, 24h), Dexamethasone (DEX, 100nM, 24h) or IL-4 (10ng/mL, 24h) treated BMMФ of n=4 biological replicates. f, SREBP1 target gene induction in response to IL-4 of LysM+/+ SCAPflox/flox (WT) and LysMCre/+ SCAPflox/flox (SCAP-KO) BMMФ. mRNA expression over BK of n=4 (Scap) or n=8 biological replicates from 2 independent experiments. g, Mice were injected with IL-4c or PBS on day 0. After 2 days, the peritoneal cavity was washed, and the peritoneal exudate cells were sorted by magnetic associated cell sorting (MACS) using F4/80 positive selection. h, Gene expression of SREBP1 target genes in macrophages harvested from 4 mice per group injected with IL-4c or PBS. Data of the mRNA expression over BK presented as mean ± SEM of n=4 mice per group. Statistical analysis of the RNAseq data is detailed in the methods section. Otherwise, data has been analysed by a one-way ANOVA followed by a Dunnett’s multiple comparisons test (Fig. 1c) or a two-tailed Student’s t-test (Fig. 1h).
Figure 2
Figure 2. Inhibition of SREBP1 activation impairs macrophages alternative activation and immune response to helminths.
a, Alternative activation assessed by the co-expression of RELMα and CD206 by flow cytometry of WT and SCAP-KO BMMФ in response to IL-4. Quantification of the number of M(IL-4) macrophages is presented as mean ± SEM in b. Data of n=8 biological replicates from 2 independent experiments. c, Gene enrichment analysis of the pathways associated with response to IL-4 and innate immune response of the interaction effect of IL-4 in WT and SCAP-KO BMMФ. Data of n=6 biological replicates from 2 independent experiments per group. d, Experimental design for N. brasiliensis infection. e, Macrophage number in the lungs of naïve or 5- and 7-days post N. brasiliensis inoculation WT and MФ-SCAP-KO mice. Data is expressed as mean ± SEM. f, Percentage of alternatively activated alveolar macrophages assessed by the co-expression of RELMα and CD206 in the lungs of naïve or 5-and 7-days post N. brasiliensis inoculation WT and MФ-SCAP-KO. The number of alternatively activated alveolar macrophages is presented in g. Data is expressed as mean ± SEM. h, Red blood cells counts in the bronchoalveolar lavage of naïve or 5 and 7-days post N. brasiliensis inoculation WT and SCAP-KO mice. Data is expressed as mean ± SEM. i, Representative pictures of haematoxylin and eosin staining of lung section from four WT and four MФ-SCAP-KO mice 5-days post N. brasiliensis inoculation. Black arrows indicate alveolar proteinaceous debris. j, Histological score of alveolar proteinaceous debris naïve or 5 and 7-days post N. brasiliensis inoculation WT and MФ-SCAP-KO mice. Data is expressed as mean ± SEM. k, Adult worms count in the gut of naïve or 5 and 7-days post N. brasiliensis inoculation WT and MФ-SCAP-KO mice. Data is expressed as mean ± SEM. For N. brasiliensis infection experiment, data of n=6 (WT D0), n=7 (KO D0), n=11 (WT D5) and n=12 (WT D7 and KO D5 and D7) mice from 2 independent experiments is presented. Data was analysed using a two-way ANOVA followed by Sidak post-hoc test for comparison between genotypes in control or IL-4 treated cells or at different days post-N. brasiliensis inoculation.
Figure 3
Figure 3. Limiting SREBP1-induced lipid synthesis reduces macrophages alternative activation without altering macrophages lipid composition.
a, In vivo induction of FASN protein expression in MACS-sorted peritoneal macrophages (F4/80+) from mice injected with IL-4c or PBS. ß-actin was used as loading control. b, Protein expression of FASN in WT and SCAP-KO BMMФ in response to IL-4. Western-blot representative picture of n=4 biological replicates. ß-actin has been used as loading control for the western blot analysis. c, Lipid synthesis rate in control (CTR) or IL-4-treated BMMФ. The data represents the incorporation of radiolabelled 14C-acetate in the lipid fraction as mean ± SEM of n=4 biological replicates per group. d, Lipid synthesis of WT and SCAP-KO BMMФ in response to IL-4. The data represents the incorporation of radiolabelled 14C-acetate in the lipid fraction as mean ± SEM of n=4 biological replicates. e, Palmitate synthesis rate in response to IL-4. The data are presented as mean ± SEM of n=4 biological replicates. control or IL-4 stimulated BMMФ f, FAME composition in order of increasing chain length and desaturation of control or IL-4 stimulated BMMФ. Data is presented as mean ± SEM of n=4 biological replicates. g, Total, essential and non-essential fatty acid content of control or IL-4 stimulated BMMФ. Data is presented as mean ± SEM of n=4 biological replicates. h, Alternative activation assessed by flow cytometry using the co-expression of RELMα and CD301of BMMФ in response to IL-4 and pre-treated with increasing doses of C75. The quantification of the number of alternatively activated macrophages of n=4 biological replicates is presented as mean ± SEM in i. j, Alternative activation assessed by flow cytometry using the co-expression of RELMα and CD301of DMSO or C75 (10 μM)-treated BMMФ in response to IL-4 and Palmitate (PA, 10μM) or Oleate (OA, 10μM). The quantification of the number of alternatively activated macrophages of n=4 biological replicates is presented as mean ± SEM in k. Data has been analysed using a two-tailed Student’s t-test (Fig. 3c and e) or a 2-way ANOVA followed by a Sidak (Fig. 3d, f, and g), Dunnett (Fig. 3i) or Tukey (Fig. 3k) post-hoc test.
Figure 4
Figure 4. SREBP1-dependent lipid synthesis increases NADPH utilisation to reduce antioxidant defences and permit macrophage alternative activation.
a, Gene enrichment analysis of the pathways associated with oxidoreduction processes of the interaction effect of IL-4 in WT and SCAP-KO BMMФ. Data of n=6 biological replicates from 2 independent experiments per group. b, Reactive oxygen species (ROS) levels in WT and SCAP-KO BMMФ in CTR or IL-4 treated cells. ROS were quantified by the median fluorescence intensity (MFI) of CM-H2DCFDA by flow cytometry. Data presented as mean ± SEM of n=4 biological replicates. c, Reactive oxygen species (ROS) levels in DMSO or C75-treated (10μM) BMMФ in CTR or IL-4 treated cells. ROS were quantified by the MFI of CM-H2DCFDA by flow cytometry. Data presented as mean ± SEM of n=11 biological replicates from 3 independent experiments. d, NADPH consumption rate by palmitate synthesis in BMMФ treated with DMSO or Cerulenin (1μg/mL) in response to IL-4. Data presented as mean ± SEM from n=4 (DMSO) and n=3 (Cerulenin) biological replicates. e, NADPH/NADP+ ratio in WT and SCAP-KO BMMФ in response to IL-4. Data presented as mean ± SEM from n=8 biological replicate from 2 independent experiments. f, Reduced glutathione (GSH) levels in WT and SCAP-KO BMMФ in response to IL-4. Data presented as mean ± SEM of n=4 biological replicates. g, H2O2-induced cell death (100 μM, 24h) challenge in WT and SCAP-KO BMMФ determined by flow cytometry using a live/dead dye. The quantification of the dead cells percentage is presented in the right panel. Data presented as mean ± SEM of n=4 biological replicates. h, Cellular ROS levels in CTR or IL-4-stimulated WT and SCAP-KO BMMФ pre-treated with N-acetyl cysteine (NAC). ROS were quantified by the fluorescence ratio of CM-H2DCFDA over DNA (Hoechst). Data presented as mean ± SEM of n=8 biological replicates from 2 independent experiments. i, Alternative activation (AA) assessed by the co-expression of RELMα and CD206 by flow cytometry of WT and SCAP-KO BMMФ in response to IL-4 and NAC. The quantification of the number of M(IL-4) macrophages as mean ± SEM of n=11 (WT) and n=13 (KO) biological replicates from 3 independent experiments is presented in j. Statistical analysis of the RNAseq data is detailed in the methods section. Data was analysed using a two-way ANOVA followed by Sidak post-hoc test (Fig. 4b-j).

References

    1. Murray PJ, et al. Macrophage activation and polarization: nomenclature and experimental guidelines. Immunity. 2014;41:14–20. doi: 10.1016/j.immuni.2014.06.008. - DOI - PMC - PubMed
    1. Chen F, et al. An essential role for TH2-type responses in limiting acute tissue damage during experimental helminth infection. Nat Med. 2012;18:260–266. doi: 10.1038/nm.2628. - DOI - PMC - PubMed
    1. Chawla A, Nguyen KD, Goh YP. Macrophage-mediated inflammation in metabolic disease. Nat Rev Immunol. 2011;11:738–749. doi: 10.1038/nri3071. - DOI - PMC - PubMed
    1. Mantovani A, Allavena P, Sica A, Balkwill F. Cancer-related inflammation. Nature. 2008;454:436–444. doi: 10.1038/nature07205. - DOI - PubMed
    1. O’Neill LA, Pearce EJ. Immunometabolism governs dendritic cell and macrophage function. J Exp Med. 2016;213:15–23. doi: 10.1084/jem.20151570. - DOI - PMC - PubMed

Publication types

MeSH terms