. 2021 Jun 9;7(2):veab055.
doi: 10.1093/ve/veab055. eCollection 2021.

Phylogenetic analysis of HIV-1 shows frequent cross-country transmission and local population expansions

Affiliations

Phylogenetic analysis of HIV-1 shows frequent cross-country transmission and local population expansions

Marc Bennedbæk et al. Virus Evol. .

Abstract

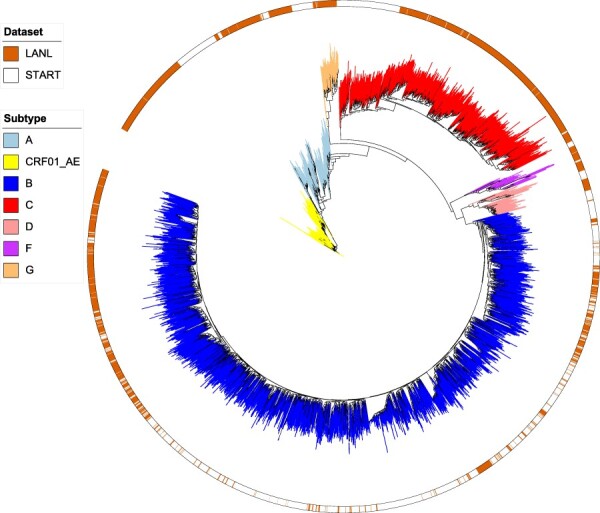
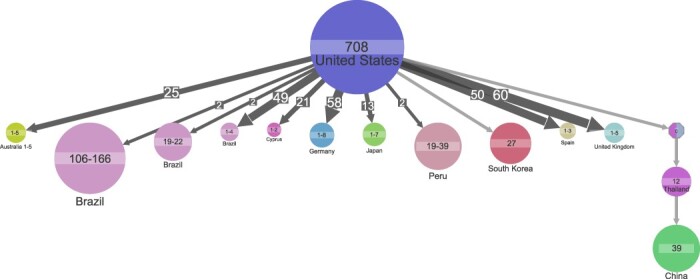
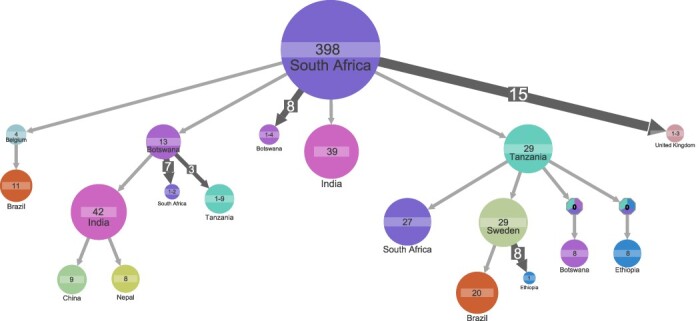
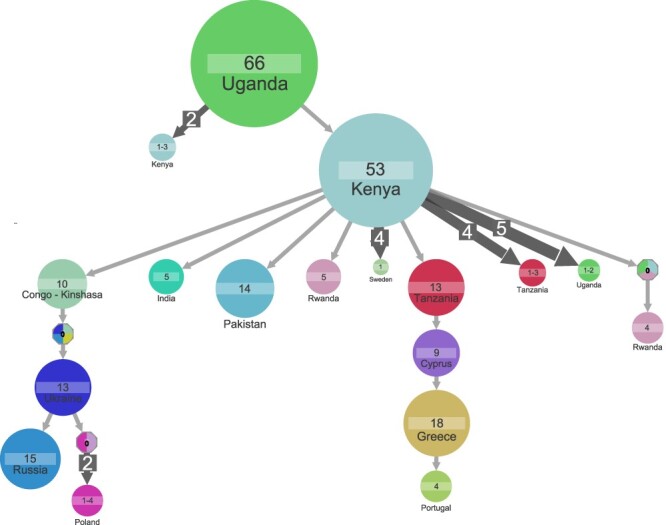
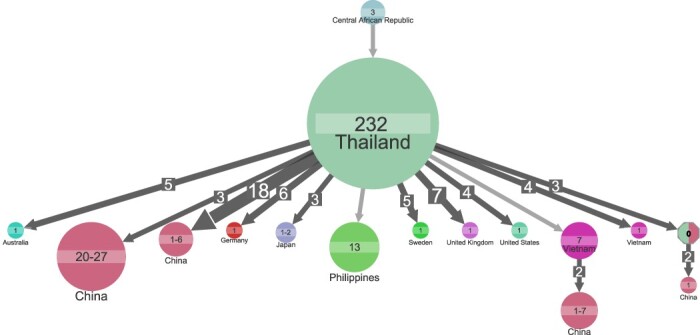
Understanding of pandemics depends on the characterization of pathogen collections from well-defined and demographically diverse cohorts. Since its emergence in Congo almost a century ago, Human Immunodeficiency Virus Type 1 (HIV-1) has geographically spread and genetically diversified into distinct viral subtypes. Phylogenetic analysis can be used to reconstruct the ancestry of the virus to better understand the origin and distribution of subtypes. We sequenced two 3.6-kb amplicons of HIV-1 genomes from 3,197 participants in a clinical trial with consistent and uniform sampling at sites across 35 countries and analyzed our data with another 2,632 genomes that comprehensively reflect the HIV-1 genetic diversity. We used maximum likelihood phylogenetic analysis coupled with geographical information to infer the state of ancestors. The majority of our sequenced genomes (n = 2,501) were either pure subtypes (A-D, F, and G) or CRF01_AE. The diversity and distribution of subtypes across geographical regions differed; USA showed the most homogenous subtype population, whereas African samples were most diverse. We delineated transmission of the four most prevalent subtypes in our dataset (A, B, C, and CRF01_AE), and our results suggest both continuous and frequent transmission of HIV-1 over country borders, as well as single transmission events being the seed of endemic population expansions. Overall, we show that coupling of genetic and geographical information of HIV-1 can be used to understand the origin and spread of pandemic pathogens.

Keywords: Ancestral State Reconstruction; HIV; Phylogenetics; Phylogeography; Transmission.


Conflict of interest statement

The authors declare that they have no competing interests.

Figures

Figure 1.
Figure 1.
Maximum likelihood phylogenetic tree of all 5,133 samples in the combined START and LANL datasets that were defined as pure subtypes (A–D, F, and G) or subtype CRF01_AE. The branches are colored according to subtype. The outer color strip indicates if the samples are from either START or LANL Filtered Web alignment.
Figure 2.
Figure 2.
Ancestral state reconstruction of 3,155 subtype B samples. Ancestral state reconstruction of samples is shown for country origin. Circles denote genetic clusters of samples with the same state. The state and sample size of clusters are indicated for each circle. An arrow between two circles denotes events of transmission from the top cluster to the bottom cluster. The size and the number on top of the arrows indicate that the arrows represent multiple transmission events leading to clusters of similar sizes. Clusters with a ‘0’ and multiple colors indicate that several corresponding states have similar marginal probabilities. The lowest marginal probability for resolved clusters shown is 74 per cent. Clusters of size less than 19 are hidden to improve readability.
Figure 3.
Figure 3.
Ancestral state reconstruction of 949 subtype C samples. Ancestral state reconstruction of samples is shown for country origin. Circles denote genetic clusters of samples from the sample country. The country and sample size of clusters are indicated for each circle. An arrow between two circles denotes events of transmission from the top cluster to the bottom cluster. Clusters with a ‘0’ and multiple colors indicate that several corresponding states have similar marginal probabilities. The lowest marginal probability for resolved clusters shown is 82 per cent. The size and the number on top of the arrows indicate that the arrow represents multiple transmission events leading to clusters of similar sizes. Clusters of size less than 8 are hidden to improve readability.
Figure 4.
Figure 4.
Ancestral state reconstruction of 337 subtype A samples. Ancestral state reconstruction of samples is shown for country origin. Circles denote genetic clusters of samples from the sample country. The country and sample size of clusters are indicated for each circle. An arrow between two circles denotes events of transmission from the top cluster to the bottom cluster. Clusters with a ‘0’ and multiple colors indicate that several corresponding states have similar marginal probabilities. The lowest marginal probability for resolved clusters shown is 75 per cent. The size and the number on top of the arrows indicate that the arrow represents multiple transmission events leading to clusters of similar sizes. Clusters of size less than 4 are hidden to improve readability.
Figure 5.
Figure 5.
Ancestral state reconstruction of 439 subtype CRF01_AE samples. Ancestral state reconstruction of samples is shown for country origin. Circles denote genetic clusters of samples from the sample country. The country and sample size of clusters are indicated for each circle. An arrow between two circles denotes events of transmission from the top cluster to the bottom cluster. The lowest marginal probability for resolved clusters shown is 64 per cent. The size and the number on top of the arrows indicate that the arrow represents multiple transmission events leading to clusters of similar sizes. Clusters of size less than 4 are hidden to improve readability.

References

    1. Angelis K. et al. (2015) ‘Global Dispersal Pattern of HIV Type 1 Subtype CRF01_AE: A Genetic Trace of Human Mobility Related to Heterosexual Sexual Activities Centralized in Southeast Asia’, Journal of Infectious Diseases, 211: 1735–44. - PubMed
    1. Bletsa M. et al. (2019) ‘Divergence Dating Using Mixed Effects Clock Modelling: An Application to HIV-1’, VirusEvolution, 5: vez036. - PMC - PubMed
    1. Buonaguro L., Tornesello M. L., and Buonaguro F. M. (2007) ‘Human Immunodeficiency Virus Type 1 Subtype Distribution in the Worldwide Epidemic: Pathogenetic and Therapeutic Implications’, Journal of Virology, 81: 10209–19. - PMC - PubMed
    1. Carr J. K. et al. (2001) ‘Diverse BF Recombinants Have Spread Widely Since the Introduction of HIV-1 into South America’, AIDS, 15: F41–7. - PubMed
    1. Castro-Nallar E. et al. (2012) ‘The Evolution of HIV: Inferences Using Phylogenetics’, Molecular Phylogenetics and Evolution, 62: 777–92. - PMC - PubMed