

Independent External Validation of FRAX and Garvan Fracture Risk Calculators: A Sub-Study of the FRISBEE Cohort
- PMID: 34532617
- PMCID: PMC8441269
- DOI: 10.1002/jbm4.10532
Independent External Validation of FRAX and Garvan Fracture Risk Calculators: A Sub-Study of the FRISBEE Cohort
Abstract
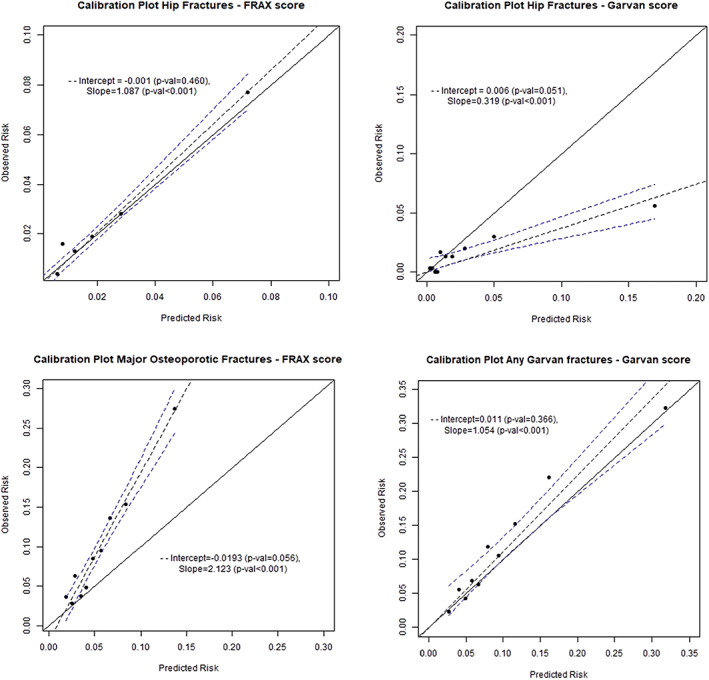
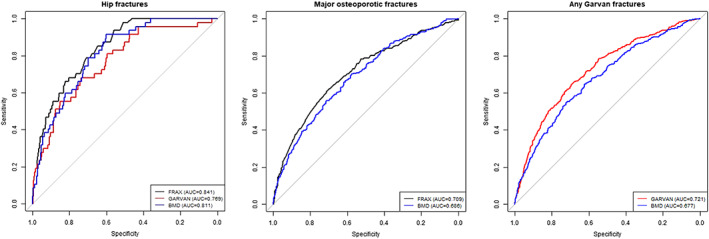
Probabilistic models including clinical risk factors with or without bone mineral density (BMD) have been developed to estimate the 5- or 10-year absolute fracture risk. We investigated the performance of the FRAX and Garvan tools in a well-characterized population-based cohort of 3560 postmenopausal, volunteer women, aged 60 to 85 years at baseline, included in the Fracture Risk Brussels Epidemiological Enquiry (FRISBEE) cohort, during 5 years of follow-up. Baseline data were used to calculate the estimated 10-year risk of hip and major osteoporotic fractures (MOFs) for each participant using FRAX (Belgium). We computed the 5-year risk according to the Garvan model with BMD. For calibration, the predicted risk of fracture was compared with fracture incidence across a large range of estimated fracture risks. The accuracy of the calculators to predict fractures was assessed using the area under the receiver operating characteristic curves (AUC). The FRAX tool was well calibrated for hip fractures (slope 1.09, p < 0.001; intercept -0.001, p = 0.46), but it consistently underestimated the incidence of major osteoporotic fractures (MOFs) (slope 2.12, p < 0.001; intercept -0.02, p = 0.06). The Garvan tool was well calibrated for "any Garvan" fractures (slope 1.05, p < 0.001; intercept 0.01, p = 0.37) but largely overestimated the observed hip fracture rate (slope 0.32, p < 0.001; intercept 0.006, p = 0.05). The predictive value for hip fractures was better for FRAX (AUC: 0.841, 95% confidence interval [CI] 0.795-0.887) than for Garvan (AUC: 0.769, 95% CI 0.702-0.836, p = 0.01). The Garvan AUC for "any Garvan" fractures was 0.721 (95% CI 0.693-0.749) and FRAX AUC for MOFs was 0.708 (95% CI 0.675-0.741). In conclusion, in our Belgian cohort, FRAX estimated quite well hip fractures but underestimated MOFs, while Garvan overestimated hip fracture risk but showed a good estimation of "any Garvan" fractures. Both models had a good discriminatory value for hip fractures but only a moderate discriminatory ability for MOFs or "any Garvan" fractures. © 2021 The Authors. JBMR Plus published by Wiley Periodicals LLC on behalf of American Society for Bone and Mineral Research.
Keywords: BMD; DISCRIMINATION; FRACTURE; OSTEOPOROSIS; RISK ASSESSMENT; RISK FACTORS; VALIDATION.
© 2021 The Authors. JBMR Plus published by Wiley Periodicals LLC on behalf of American Society for Bone and Mineral Research.
Figures
References
-
- Kanis, JA. Assessment of osteoporosis at the primary health‐care level. Technical Report. 2008. http://www.shef.ac.uk/FRAX; http://ci.nii.ac.jp/naid/20001201414/en/. Accessed October 24, 2020.
-
- Kanis JA, Johnell O, Oden A, et al. Long‐term risk of osteoporotic fracture in Malmo. Osteoporos Int. 2000;11(8):669‐674. - PubMed
-
- Kanis JA. Assessment of fracture risk and its application to screening for postmenopausal osteoporosis: synopsis of a WHO report. WHO Study Group. Osteoporos Int. 1994;4:368‐381. - PubMed
-
- Nguyen ND, Frost SA, Center JR, Eisman JA, Nguyen TV. Development of prognostic nomograms for individualizing 5‐year and 10‐year fracture risks. Osteoporos Int. 2008;19(10):1431‐1444. - PubMed
-
- Kanis JA, Oden A, Johnell O, et al. The use of clinical risk factors enhances the performance of BMD in the prediction of hip and osteoporotic fractures in men and women. Osteoporos Int. 2007;18(8):1033‐1046. - PubMed
LinkOut - more resources
Full Text Sources