. 2021 Jun 21;1(2):100010.
doi: 10.1016/j.crmeth.2021.100010. Epub 2021 Jun 1.

Uncovering biomarkers during therapeutic neuromodulation with PARRM: Period-based Artifact Reconstruction and Removal Method

Affiliations

Uncovering biomarkers during therapeutic neuromodulation with PARRM: Period-based Artifact Reconstruction and Removal Method

Evan M Dastin-van Rijn et al. Cell Rep Methods. .

Abstract

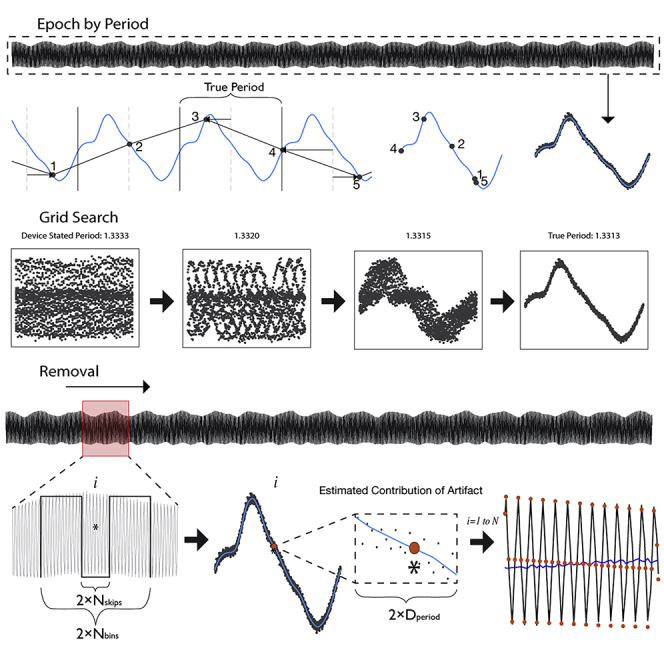
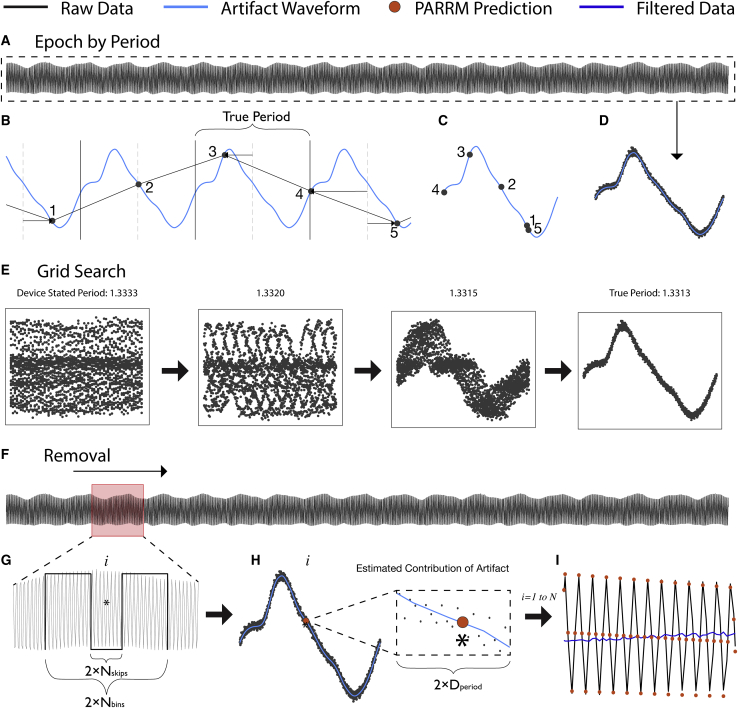
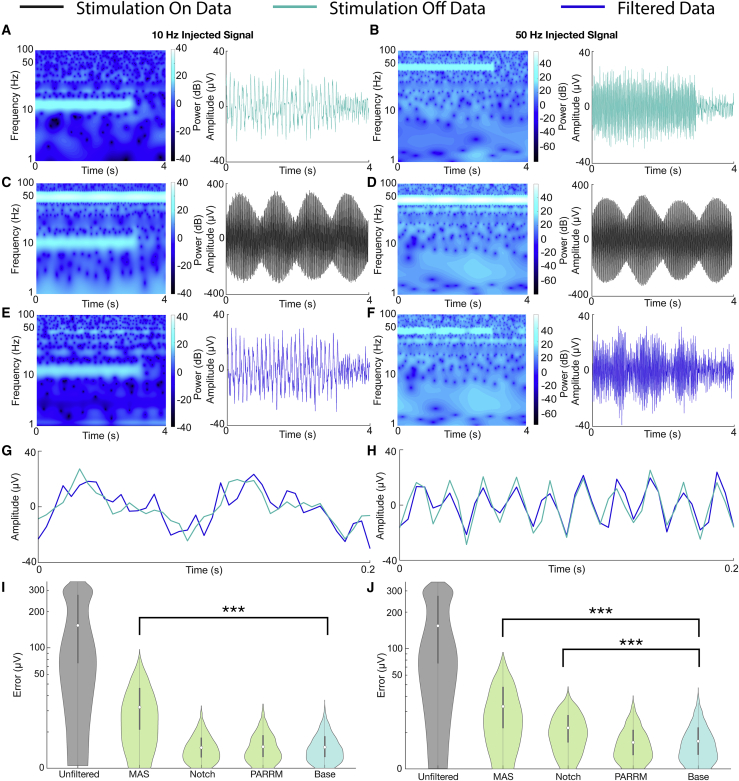
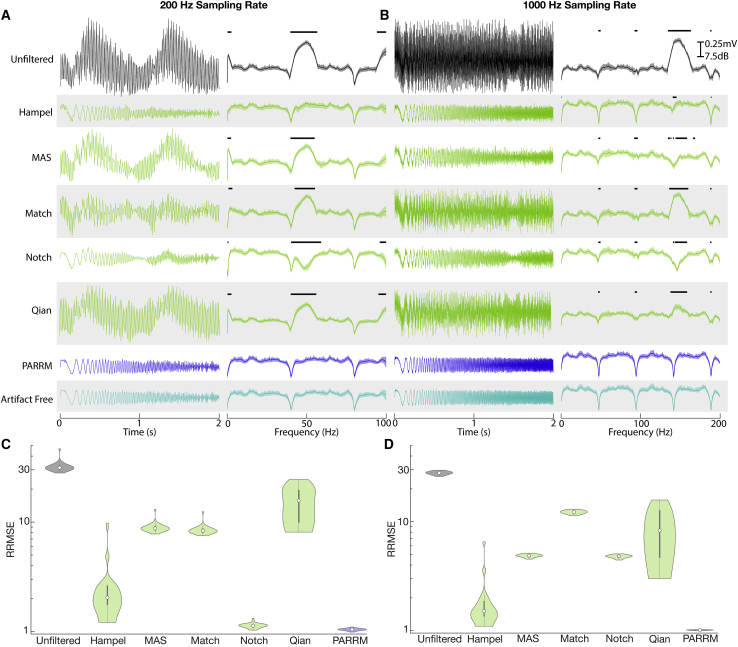
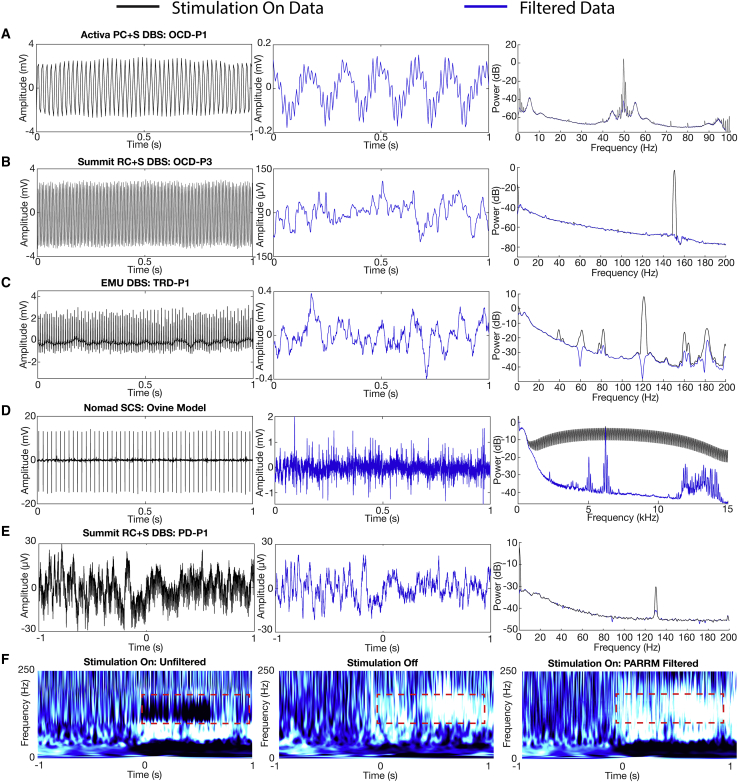
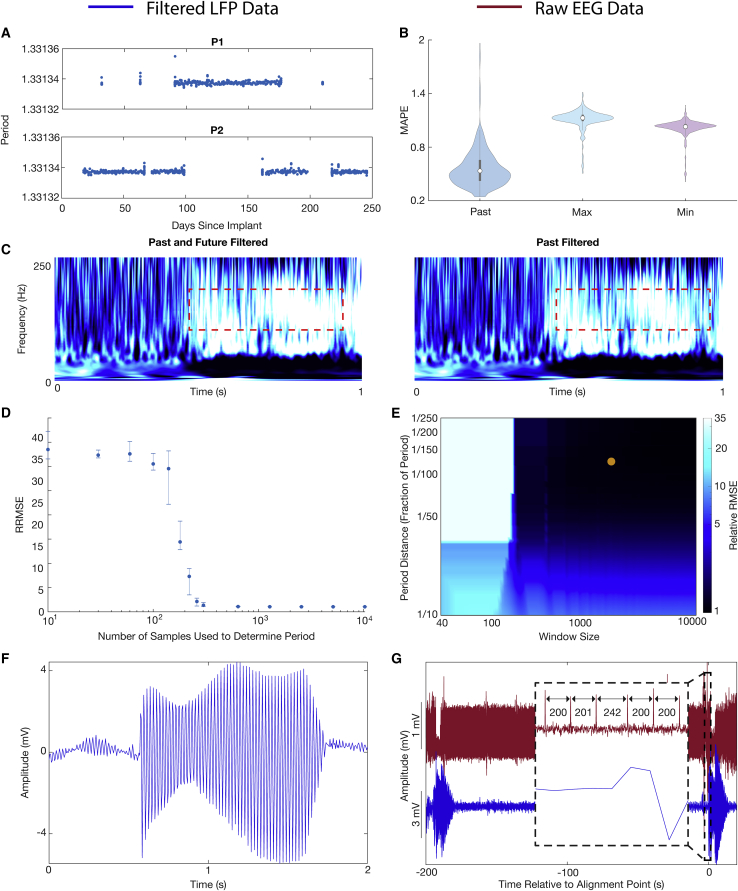
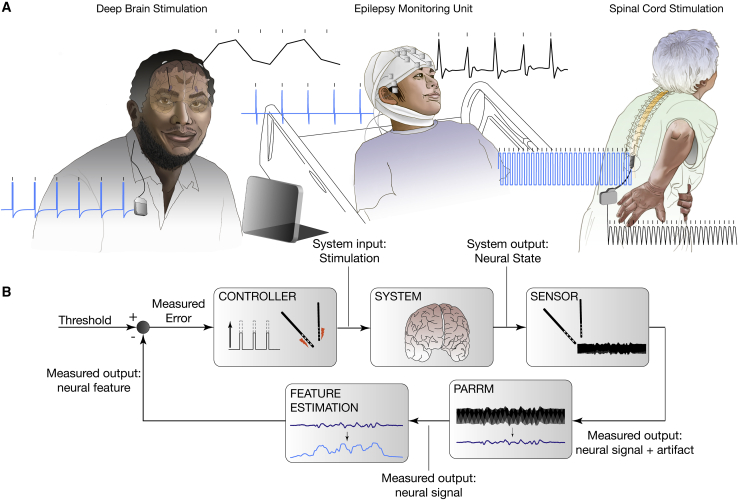
Advances in therapeutic neuromodulation devices have enabled concurrent stimulation and electrophysiology in the central nervous system. However, stimulation artifacts often obscure the sensed underlying neural activity. Here, we develop a method, termed Period-based Artifact Reconstruction and Removal Method (PARRM), to remove stimulation artifacts from neural recordings by leveraging the exact period of stimulation to construct and subtract a high-fidelity template of the artifact. Benchtop saline experiments, computational simulations, five unique in vivo paradigms across animal and human studies, and an obscured movement biomarker are used for validation. Performance is found to exceed that of state-of-the-art filters in recovering complex signals without introducing contamination. PARRM has several advantages: (1) it is superior in signal recovery; (2) it is easily adaptable to several neurostimulation paradigms; and (3) it has low complexity for future on-device implementation. Real-time artifact removal via PARRM will enable unbiased exploration and detection of neural biomarkers to enhance efficacy of closed-loop therapies.


Conflict of interest statement

Activa PC + S and Summit RC + S devices were provided for this study to D.A.B., P.A.S., and W.K.G. without charge by Medtronic as part of the NIH BRAIN public-private partnership. A provisional patent application has been filed by Brown University on behalf of M.T.H., E.M.D.-v.R., N.R.P., and D.A.B. on PARRM.

Figures

None
Graphical abstract
Figure 1
Figure 1
Illustration of stimulation period determination, template reconstruction, and template subtraction via PARRM (A) Entire LFP recording sampled at 200 Hz (black) is used to identify the true period. (B) An illustration of a five-sample snippet of the LFP recording divided into epochs by using the true period and overlaid with the high-resolution waveform (light blue). Black points indicate individual raw LFP samples. (C) The epochs for all five samples are overlaid on the timescale of the true period. (D) When all epochs in the recording are overlaid by using this procedure, all samples consolidate around the shape of the high-resolution artifact waveform on the timescale of the true period. (E) The period suggested by the device sampling and stimulation rates is inexact and does not result in a consolidated waveform. Using a grid search centered around the stated period, a series of periods are evaluated to find the true period that produces the most consolidated samples. (F) A sliding window is applied to the entire recording to estimate the contribution of the stimulation artifact at each sample. (G) For each window, a rectangular kernel (length Nbins), ignoring the center (length Nskips) is used to estimate the value of the artifact at each sample of interest i (asterisk). (H) Samples within a distance, Dperiod, on the timescale of the artifact period are averaged together to produce the estimate of the amplitude of the artifact (orange point) at sample i. (I) The estimated value of the artifact is then subtracted at each sample over the entire recording to recover the signal of interest (dark blue).
Figure 2
Figure 2
PARRM effectively recovers sinusoidal signals at frequencies separate from and coincident with the aliased artifact (A and B) Spectrogram and time-voltage series of (A) 10 Hz and (B) 50 Hz sinusoidal signals injected into saline sampled at 200 Hz with stimulation off. (C and D) Spectrogram and time-voltage series of (C) 10 Hz and (D) 50 Hz sinusoidal signals injected into saline sampled at 200 Hz during concurrent 150 Hz stimulation. (E and F) PARRM-filtered spectrogram and time-voltage series of (E) 10 Hz and (F) 50 Hz sinusoidal signals injected into saline sampled at 200 Hz during concurrent 150 Hz stimulation. (G and H) A 0.2 s snippet of PARRM-filtered and artifact-free time-voltage series of (G)10 Hz and (H) 50 Hz sinusoidal signals injected into saline sampled at 200 Hz during concurrent 150 Hz stimulation. (I and J) Evaluation of filter performance based on time domain absolute error between artifact-free and filtered (I) 10 Hz and (J) 50 Hz injected signals sampled at 200 Hz during concurrent 150 Hz stimulation. Asterisks indicate significant differences from absolute errors on the order of baseline noise (Wilcoxon rank sum, ∗∗∗p < 0.0005).
Figure 3
Figure 3
PARRM performance exceeds state-of-the-art filters for non-stationary signals at low and high sampling rates in simulated data (A) Averaged time-voltage series and windowed power spectral density of 30 simulated linear chirps (0–100 Hz, 2 s duration, variable separation) during concurrent 150 Hz stimulation for unfiltered, Hampel-filtered, MAS-filtered, match-filtered, notch-filtered, Qian-filtered, PARRM-filtered, and artifact-free recordings sampled at 200 Hz. Black solid bars indicate significant difference from artifact-free signal (two-sample t test, p < 0.05). (B) Average time-voltage series and average windowed power spectral density of 30 simulated linear chirps (0–200 Hz, 2 s duration, variable separation) during concurrent 150 Hz stimulation for unfiltered, Hampel-filtered, MAS-filtered, match-filtered, notch-filtered, Qian-filtered, PARRM-filtered, and artifact-free recordings sampled at 1,000 Hz. Black solid bars indicate significant difference from artifact-free signal (two-sample t test, p < 0.05). (C and D) Evaluation of filter performance based on time domain relative root-mean-squared error (RRMSE: ratio between MSE of artifact-free versus theoretical chirp to MSE of filtered versus theoretical chirp) of simulated chirps during concurrent 150 Hz stimulation sampled at (C) 200 Hz and (D) 1,000 Hz.
Figure 4
Figure 4
Demonstration of PARRM in human participants with DBS, intracranial EEG recordings during concurrent DBS, and spinal cord stimulation in ovine model (A–E) Raw time-voltage LFP trace, PARRM-filtered time-voltage LFP trace, and average power spectral density (PSD) before (black) and after (blue) PARRM filtering, collected during (A) 150 Hz stimulation sampled at 200 Hz by using Activa PC + S in OCD-P1 left VC/VS, (B) 150.6 Hz stimulation sampled at 1,000 Hz by using Summit RC + S in OCD-P3 right BNST, (C) 120 Hz stimulation sampled at 2,000 Hz in TRD-P1 left ventral prefrontal cortex during a cognitive control task, (D) 50 Hz spinal stimulation sampled at 30 kHz in ovine model by using Ripple Nomad, and (E) 130.2 Hz stimulation in STN sampled at 1,000 Hz by using Summit RC + S in PD-P1 recorded in right M1 during movement task. Left: one unfiltered trial in time domain. Center: PARRM-filtered trial in time domain. Right: PSD of whole task. (F) Averaged continuous wavelet transforms for a movement task zeroed to motion cue for stimulation on unfiltered data, stimulation off, and stimulation on PARRM-filtered data recorded using the Summit RC + S in PD-P1 recorded in right M1. Location of high-gamma biomarker is indicated by the dashed red line.
Figure 5
Figure 5
Practical considerations for implementing signal recovery via PARRM in real time (A) Exact period estimations in samples over 1,012 recordings for P1 and P2 over 250 days since DBS implant. (B) Median absolute percent error (MAPE) between the standard PARRM filtering approach (using past and future samples, and exact period estimation) and by using past samples only with an exact period estimation, past samples only with the maximum period across the 1,012 recordings, and past samples only with the minimum period across the 1,012 recordings. (C) Comparison of averaged continuous wavelet transforms when filtered by using PARRM with past and future samples versus past samples alone. (D) PARRM performance measured by relative root-mean-squared error (RRMSE) is dependent on the number of samples used to determine the period. Error bars show the spread. (E) Heatmap of RRMSE as a function of period distance (Dperiod) and half window size (Nbins). Darker blue indicates superior PARRM performance. Orange point indicates the Dperiod and Nbins that were used for all analysis. (F) Voltage-time LFP trace after PARRM filtering containing a jump in the period. (G) LFP (blue) and concurrent EEG (red), aligned by using location of period jump identified in both recordings.
Figure 6
Figure 6
Real-time artifact removal via PARRM could enable biomarker detection during ongoing neurostimulation to enhance efficacy of closed-loop neuromodulation (A) Three example applications of closed-loop neuromodulation: DBS applied at 150 Hz via the Activa PC + S for treatment of refractory OCD (top), DBS applied at 120 Hz in an epilepsy monitoring unit-like (EMU-like) scenario for treatment of TRD, and SCS applied at 50 Hz for treatment of chronic pain. Blue trace shows theoretical injected DBS waveform and black trace shows DBS waveform sampled in vivo at 200 Hz, 2 kHz, and 30 kHz, via Activa PC + S, Blackrock Cerebus, and Ripple Nomad, respectively. (B) Control policy for closed-loop DBS. Electrodes in the brain sense neural signals and artifacts. PARRM attenuates stimulation without contaminating the underlying neural signal, enabling feature estimation for the closed-loop control of stimulation amplitude to relieve symptoms.

References

    1. Allen D.P., Stegemöller E.L., Zadikoff C., Rosenow J.M., Mackinnon C.D. Suppression of deep brain stimulation artifacts from the electroencephalogram by frequency-domain Hampel filtering. Clin. Neurophysiol. 2010;121:1227–1232. - PMC - PubMed
    1. Bergey G.K., Morrell M.J., Mizrahi E.M., Goldman A., King-Stephens D., Nair D., Srinivasan S., Jobst B., Gross R.E., Shields D.C., et al. Long-term treatment with responsive brain stimulation in adults with refractory partial seizures. Neurology. 2015;84:810–817. - PMC - PubMed
    1. Bronte-Stewart H., Barberini C., Koop M.M., Hill B.C., Henderson J.M., Wingeier B. The STN beta-band profile in Parkinson’s disease is stationary and shows prolonged attenuation after deep brain stimulation. Exp. Neurol. 2009;215:20–28. - PubMed
    1. Brunner C., Delorme A., Makeig S. Eeglab—an open source matlab toolbox for electrophysiological research. Biomed. Tech. (Berl.) 2013;58(Suppl 1) doi: 10.1515/bmt-2013-4182. - DOI - PubMed
    1. Caldwell D.J., Cronin J.A., Rao R.P.N., Collins K.L., Weaver K.E., Ko A.L., Ojemann J.G., Kutz J.N., Brunton B.W. Signal recovery from stimulation artifacts in intracranial recordings with dictionary learning. J. Neural Eng. 2020;17:026023. - PMC - PubMed

Publication types

LinkOut - more resources