. 2022 Jan;32(1):36-47.
doi: 10.1111/jon.12934. Epub 2021 Sep 17.

Machine learning to investigate superficial white matter integrity in early multiple sclerosis

Affiliations

Machine learning to investigate superficial white matter integrity in early multiple sclerosis

Korhan Buyukturkoglu et al. J Neuroimaging. 2022 Jan.

Abstract

Background and purpose: This study aims todetermine the sensitivity of superficial white matter (SWM) integrity as a metric to distinguish early multiple sclerosis (MS) patients from healthy controls (HC).

Methods: Fractional anisotropy and mean diffusivity (MD) values from SWM bundles across the cortex and major deep white matter (DWM) tracts were extracted from 29 early MS patients and 31 age- and sex-matched HC. Thickness of 68 cortical regions and resting-state functional-connectivity (RSFC) among them were calculated. The distribution of structural and functional metrics between groups were compared using Wilcoxon rank-sum test. Utilizing a machine learning method (adaptive boosting), 6 models were built based on: 1-SWM, 2-DWM, 3-SWM and DWM, 4-cortical thickness, or 5-RSFC measures. In model 6, all features from previous models were incorporated. The models were trained with nested 5-folds cross-validation. Area under the receiver operating characteristic curve (AUCroc ) values were calculated to evaluate classification performance of each model. Permutation tests were used to compare the AUCroc values.

Results: Patients had higher MD in SWM bundles including insula, inferior frontal, orbitofrontal, superior and medial temporal, and pre- and post-central cortices (p < .05). No group differences were found for any other MRI metric. The model incorporating SWM and DWM features provided the best classification (AUCroc = 0.75). The SWM model provided higher AUCroc (0.74), compared to DWM (0.63), cortical thickness (0.67), RSFC (0.63), and all-features (0.68) models (p < .001 for all).

Conclusion: Our results reveal a non-random pattern of SWM abnormalities at early stages of MS even before pronounced structural and functional alterations emerge.

Keywords: diffusion tensor imaging; machine learning; multiple sclerosis; superficial white matter; u-fibers.


Figures

Fig.1A.
Fig.1A.
Superficial white matter (SWM) analysis steps are presented in 4 main steps: preprocessing, normalization/coregistration, SWM bundle segmentation and extracting fractional anisotropy (FA) and mean diffusivity (MD) values from segmented bundles.
Fig.1B.
Fig.1B.
Upper panel: SWM bundle atlas composed of 50 bundles per hemisphere in sagittal, coronal and axial planes. Lower panel: SWM segmentation from one subject tractography data in sagittal, coronal and axial planes. DWI = Diffusion weighted imaging, DTI = Diffusion tensor imaging, MNI = Montreal Neurological Institute.
Fig.2.
Fig.2.
In 10 superficial white matter bundles (represented in different colors, 6 on left hemisphere) significantly high mean diffusivity values were found in patients relative to healthy controls. LH = Left hemisphere, RH = Right hemisphere, LOF-ST = Lateral orbitofrontal-superior temporal, Or-In = Parsorbitalis-insula, ST-In = Superior temporal-insula, Op-In = Pars opercularis-insula, PoC.In = Postcentral-inusla, PrC.In = Precentral-insula, MOF-ST =Medial orbitofrontal-superior temporal.
Fig.3.
Fig.3.
Superficial white matter (SWM) bundles which are significantly correlated with Expanded Disability Status Scale (EDSS) scores superimposed on a glass brain. Bundles in blue represent SWM bundles where mean diffusivity values are correlated with EDSS scores. Bundles in green represent SWM bundles where fractional anisotropy values are correlated with EDSS scores. Darker colors represent more significant Pearson’s correlation results (i.e., lower p values). RH = Right hemisphere, LH = Left hemisphere, MT-SM = Middle temporal-supramarginal, IT-MT = Inferior temporal-middle temporal, MOF-ST = Medial orbitofrontal-superior temporal, LOF-ST = Lateral orbitofrontal-superior temporal, ST-IN = Superior temporal-insula, MTST = Middle temporal-superior temporal, TR-IN = Pars triangularis-insula, LOF-MOF = Lateral orbitofrontal-medial orbitofrontal, IP-MT = Inferior parietal-middle temporal, POC-SM = Postcentral-supramarginal, POC-PRC = Postcentral-precentral, OR-IN = Pars orbitalis-insula.
Fig.4.
Fig.4.
Scatter plot representing the Pearson’s correlation between right hemisphere (RH) pars orbitalis-insula bundle fractional anisotropy (FA) value and Expanded Disability Status Scale (EDSS) scores (p < 0.0001).
Fig.5.
Fig.5.
The violin plots show the distribution of the Area Under the Receiver Operating Characteristic Curve (AUCroc) metrics for each model. Y axis represents AUCroc values, X axis represents the models (1–6). The average of the AUCroc values for each model were presented on top of violin plots specific to each model. The white dot represents the median and the black bar represent the inter quantile range between 1st and 3rd quantiles. Asterisk (*) indicates significant differences in AUCroc values (corrected p < 0.05). Model 1-Superficial white matter (SWM) measures (mean fractional anisotropy (FA) and mean diffusivity (MD) of 100 SWM bundles across the brain), Model 2-Deep white matter measures (mean FA and MD of 18 major deep white matter tracts), Model 3- SWM and deep white matter measures concatenated, Model 4-Cortical thickness measures (thickness of 68 cortical regions), Model 5-Resting state functional connectivity measures (functional connectivity among 68 cortical regions) and Model 6-All neuroimaging measures concatenated. Significant AUCroc differences were found among all models except between models 1–3, 4–6 and 5–6.
Fig.6A.
Fig.6A.
Ten most important features selected as important in Model 3 (Area Under the Receiver Operating Characteristic Curve (AUCroc) = 0.75) that included superficial white matter and deep white matter measures. LH: Left hemisphere, RH: Right hemisphere, MD = Mean diffusivity, FA = Fractional anisotropy.
Fig.6B.
Fig.6B.
Ten most important features selected as important in Model 1 (Area Under the Receiver Operating Characteristic Curve (AUCroc) = 0.74) that included only superficial white matter measures. LH: Left hemisphere, RH: Right hemisphere, MD = Mean diffusivity, FA = Fractional anisotropy.
Fig.7A.
Fig.7A.
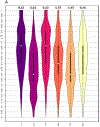
Violin plots representing sensitivity values. The average sensitivity value of each model was presented on top of violin plots specific to each model. The white dot represents the median and the black bar represent the inter quantile range between 1st and 3rd quantiles. Y axis represents sensitivity values, X axis represents the models (1–6).
Fig.7B.
Fig.7B.
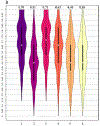
Violin plots representing specificity values.The average specificity value of each model was presented on top of violin plots specific to each model. The white dot represents the median and the black bar represent the inter quantile range between 1st and 3rd quantiles. Y axis represents specificity values, X axis represents the models (1–6).

References

    1. Bae HG, Kim TK, Suk HY, et al. White matter and neurological disorders. Arch Pharm Res 2020;43:920–31. - PubMed
    1. Wycoco V, Shroff M, Sudhakar S, et al. White matter anatomy: what the radiologist needs to know. Neuroimaging Clin N Am 2013;23:197–216. - PubMed
    1. Phillips OR, Clark KA, Luders E, et al. Superficial white matter: effects of age, sex, and hemisphere. Brain Connect 2013;3:146–59. - PMC - PubMed
    1. Nazeri A, Chakravarty MM, Felsky D, et al. Alterations of superficial white matter in schizophrenia and relationship to cognitive performance. Neuropsychopharmacology 2013;38:1954–62. - PMC - PubMed
    1. Ciccarelli O, Barkhof F, Bodini B, et al. Pathogenesis of multiple sclerosis: insights from molecular and metabolic imaging. Lancet Neurol 2014;13:807–22. - PubMed

Publication types