. 2022 Feb;6(2):320-333.
doi: 10.1002/hep4.1807. Epub 2021 Aug 25.

The Detrimental Role of Regulatory T Cells in Nonalcoholic Steatohepatitis

Affiliations

The Detrimental Role of Regulatory T Cells in Nonalcoholic Steatohepatitis

Janine Dywicki et al. Hepatol Commun. 2022 Feb.

Abstract

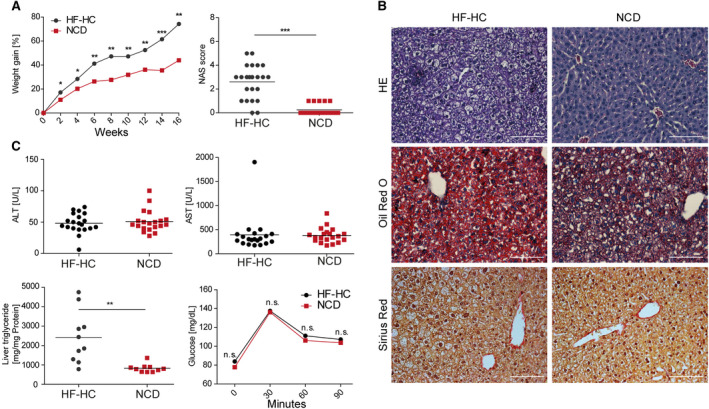
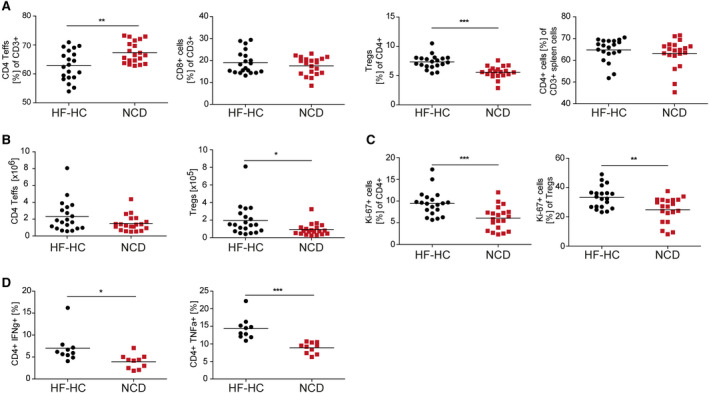
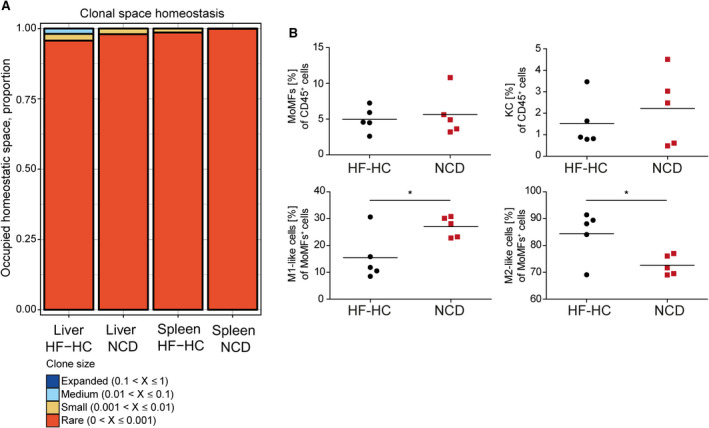
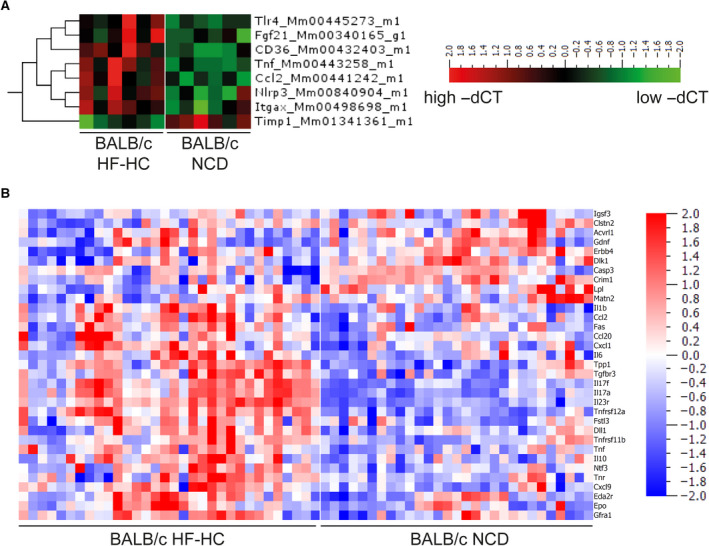
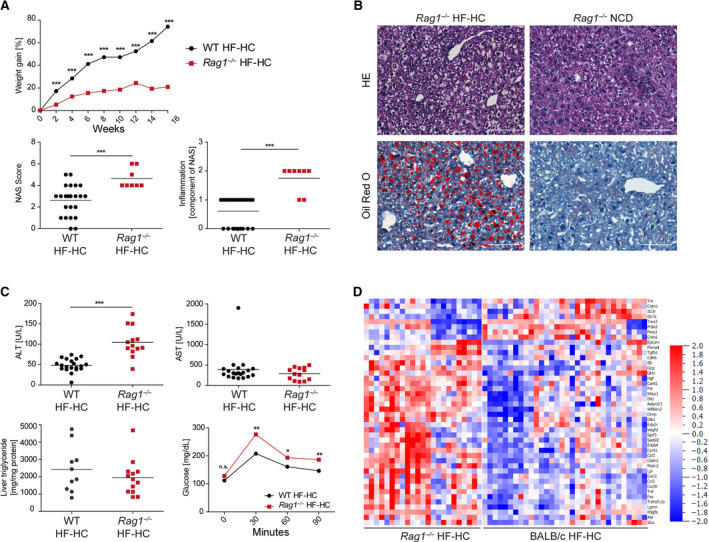
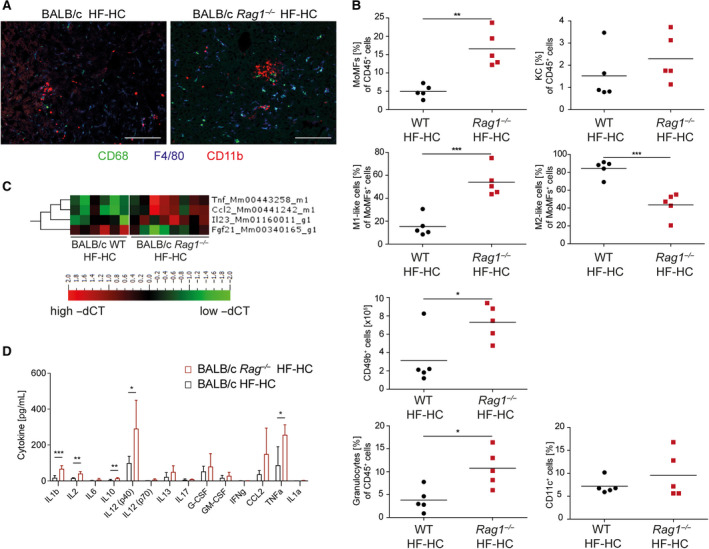
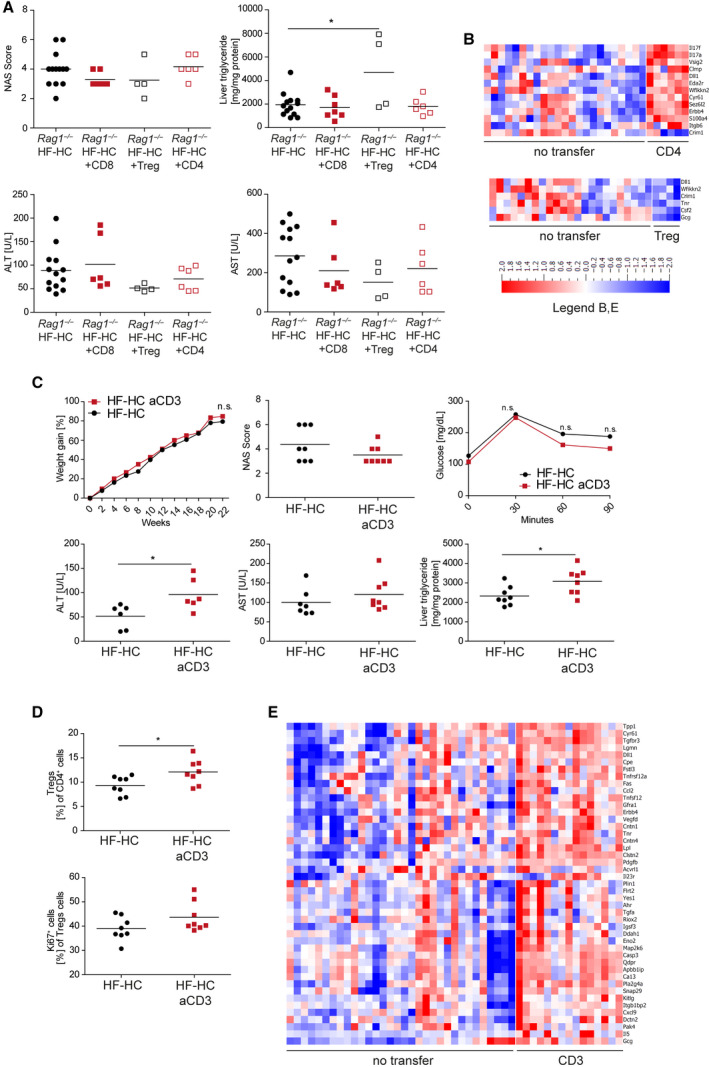
Nonalcoholic steatohepatitis (NASH) is induced by steatosis and metabolic inflammation. While involvement of the innate immune response has been shown, the role of the adaptive immune response in NASH remains controversial. Likewise, the role of regulatory T cells (Treg) in NASH remains unclear although initial clinical trials aim to target these regulatory responses. High-fat high-carbohydrate (HF-HC) diet feeding of NASH-resistant BALB/c mice as well as the corresponding recombination activating 1 (Rag)-deficient strain was used to induce NASH and to study the role of the adaptive immune response. HF-HC diet feeding induced strong activation of intrahepatic T cells in BALB/c mice, suggesting an antigen-driven effect. In contrast, the effects of the absence of the adaptive immune response was notable. NASH in BALB/c Rag1-/- mice was substantially worsened and accompanied by a sharp increase of M1-like macrophage numbers. Furthermore, we found an increase in intrahepatic Treg numbers in NASH, but either adoptive Treg transfer or anti-cluster of differentiation (CD)3 therapy unexpectedly increased steatosis and the alanine aminotransferase level without otherwise affecting NASH. Conclusion: Although intrahepatic T cells were activated and marginally clonally expanded in NASH, these effects were counterbalanced by increased Treg numbers. The ablation of adaptive immunity in murine NASH led to marked aggravation of NASH, suggesting that Tregs are not regulators of metabolic inflammation but rather enhance it.


Figures

FIG. 1
FIG. 1
Histology, biochemical analysis, and glucose tolerance tests show the stages of NASH phenotype severity in HF‐HC diet‐fed BALB/c mice. (A) Longitudinal weight gain of HF‐HC‐fed (black dots) and NCD‐fed (red squares) BALB/c mice was followed over 16 weeks. Liver sections were analyzed at week 16 using the approved blinded NAS. Data show mean (left panel) and individual scores with mean (horizontal line) (right panel). (B) HE, ORO, and sirius staining were performed with liver sections harvested after 16 weeks of HF‐HC and NCD feeding. (C) BALB/c mice fed an HF‐HC diet (black dots) or NCD (red squares) were analyzed at week 16 regarding ALT and AST levels in their blood serum, triglyceride content in the liver, and glucose intolerance. Data show individual values with mean (horizontal line) (top panels, lower left panel) and mean (lower right panel); *P < 0.05, **P < 0.01, ***P < 0.001. Abbreviation: n.s., not significant.
FIG. 2
FIG. 2
Intrahepatic CD4+ T cells show hyperactivity and proliferative characteristics, and Foxp3+ Treg‐cell numbers are significantly increased in HF‐HC diet‐treated mice. (A) BALB/c mice received an HF‐HC diet (black dots) or NCD (red squares) for 16 weeks. The frequencies of CD4+ and CD8+ Teffs and Tregs among IHLs and CD4+ splenocytes. (B) Absolute numbers of intrahepatic CD4+ Teffs and Tregs. (C) Percentage of proliferating Ki‐67+ cells among intrahepatic CD4+ Teffs and Tregs. (D) Intracellular staining for IHLs determined the content of IFN‐γ+ and TNF‐α+ cells among the CD4+ Teffs and Tregs isolated from BALB/c HF‐HC‐fed or NCD‐fed mice. Data show individual values with mean (horizontal line); *P < 0.05, **P < 0.01, ***P < 0.001. Abbreviations: FoxP3, forkhead box P3; IHL, intrahepatic lymphocyte; Teffs, effector T cells.
FIG. 3
FIG. 3
HF‐HC diet feeding induces marginal clonal TCR expansion and leads to an increase of M2‐like macrophages. (A) IHLs and intrasplenic T cells were isolated from BALB/c mice fed for 16 weeks with an HF‐HC diet or NCD, and the portion of the occupied homeostatic clonal space was determined. (B) Percentile distributions of CD11b+F4/80+ MoMFs, CD11bF4/80+ KCs, Ly6Chigh MoMFs, and Ly6Clow MoMFs in HF‐HC‐fed (black dots) and NCD‐fed (red squares) BALB/c mice. Data show individual values with mean (horizontal line); *P < 0.05.
FIG. 4
FIG. 4
Distinct gene expression and serum protein profiles resulting in inflammatory pattern after HF‐HC feeding. (A) Heat map shows gene expression quantified by −ΔCT normalized to Actb and Gapdh expression from BALB/c mice fed for 16 weeks with an HF‐HC diet or NCD. (B) Heat map of serum protein expression of BALB/c mice fed for 16 weeks with an HF‐HC diet or NCD. The shown heat maps take into account multiplicity correction after calculating the P (<0.05) and q values (<0.05) for all 92 proteins. Abbreviations: Acvrl1, activin A receptor like type 1; Ccl20, C‐C motif chemokine ligand 20; Cxcl1, C‐X‐C motif chemokine ligand 1; Cxcl9, C‐X‐C motif chemokine ligand 9; Clstn2, calsyntenin 2; Casp3, caspase 3; Crim1, cysteine rich transmembrane BMP regulator 1; Dll1, delta like canonical notch ligand 1; Dlk1, delta like non‐canonical notch ligand 1; Eda2r, ectodysplasin A2 receptor; Erbb4, Erb‐B2 receptor tyrosine kinase 4; Epo, erythropoietin; Fas, fas cell surface death receptor; Fgf21, fibroblast growth factor 21; Fstl3, follistatin like 3; Gfra1, GDNF family receptor alpha 1; Gdnf, glial cell, derived neurotrophic factor; Igsf3, immunoglobulin superfamily member 3; Itgax, integrin subunit alpha X; Lpl, lipoprotein lipase; Matn2, matrilin 2; Ntf3, neurotrophin 3; Nlpr3, NLR family, pyrin domain containing 3; Tnr, tenascin R; Timp1, tissue inhibitor of metalloproteinases 1; Tnfrsf11b, TNF receptor superfamily member 11B; Tnfrsf12a, TNF receptor superfamily member 12A; Tlr4, toll‐like receptor 4; Tgfbr3, transforming growth factor beta receptor 3; Tpp1, tripeptidyl peptidase 1.
FIG. 5
FIG. 5
Histology, biochemical analyses, and glucose tolerance test show severe NASH induction in BALB/c Rag1−/− mice fed an HF‐HC diet. (A) Longitudinal weight gain of HF‐HC‐fed BALB/c (black dot) and BALB/c Rag1−/− (red squares) mice was followed over 16 weeks. Week‐16 liver sections were analyzed using the approved blinded NAS system. Inflammation scores (0‐3 points) are also shown separately. Data show mean (top panel) and individual values with mean (horizontal line) (lower panels). (B) HE and ORO staining of liver sections from HF‐HC‐fed and NCD‐fed BALB/c Rag1−/− mice were used to determine the NAS. (C) HF‐HC‐fed BALB/c wild‐type (black dots) and BALB/c Rag1−/− (red squares) mice were analyzed at week 16 regarding ALT and AST levels in the blood serum, triglyceride content in the liver, and glucose intolerance. Data show individual values with mean (horizontal line) (upper panels, lower left panel) and mean (lower right panel). (D) Heat map shows serum protein expression of BALB/c and BALB/c Rag1−/− mice fed for 16 weeks with an HF‐HC diet. The shown heat maps take into account multiplicity correction after calculating the P (<0.05) and q values (<0.05) for all 92 proteins; *P < 0.05, **P < 0.01, ***P < 0.001. Abbreviations: Adam23, ADAM metallopeptidase domain 23; Ahr, aryl hydrocarbon receptor; Cant1, calcium activated nucleotidase 1; Cdh6, cadherin 6; Clmp, CXADR like membrane protein; Clstn2, calsyntenin 2; Cntn1, contactin‐1; Crim1, cysteine rich transmembrane BMP regulator 1; Csf2, colony stimulating factor 2; Cxcl1, C‐X‐C motif chemokine ligand 1; Cxcl9, C‐X‐C motif chemokine ligand 9; Cyr61, cellular communication network factor 1; Dlk1, delta like non‐canonical notch ligand 1; Dll1, delta like canonical notch ligand 1; Eda2r, ectodysplasin A2 receptor; Epcam, epithelial cell adhesion molecule; Erbb4, Erb‐B2 receptor tyrosine kinase 4; Fas, fas cell surface death receptor; Fst, follistatin; Gcg, glucagon; Ghrl, ghrelin and obestatin prepropeptide; Hgf, hepatocyte growth factor; Igsf3, immunoglobulin superfamily member 3; Lgmn, legumain; Lpl, lipoprotein lipase; Matn2, matrilin 2; n.s., not significant; Parp1, poly(ADP‐ribose) polymerase 1; Pdgfb, platelet derived growth factor subunit B; Plxna4, plexin A4; Prdx5, peroxiredoxin 5; Sez6l2, seizure related 6 homolog like 2; Tgfb1, transforming growth factor beta 1; Tnfrsf11b, TNF receptor superfamily member 11B; Tnni3, troponin I3; Tnr, tenascin R; Vedfd, vascular endothelial growth factor D; Wfikkn2, WAP, follistatin/kazal, immunoglobulin, kunitz and netrin domain containing 2; Wisp1, WNT1‐inducible‐signaling pathway protein 1; WT, wild type.
FIG. 6
FIG. 6
HF‐HC diet feeding in RAG‐knockout mice disturbs macrophage heterogeneity, as strongly shown by the induction of a distinct gene expression profile. (A) Cryopreserved liver sections from HF‐HC diet‐fed BALB/c and BALB/c Rag1−/− mice were immunohistochemically stained for CD86, F4/80, and CD11b. (B) Percentile distributions of CD11b+F4/80+ MoMFs, CD11bF4/80+ KCs, Ly6Chigh MoMFs, Ly6Clow MoMFs, and absolute numbers of NK cells, CD11b+Ly6G+ granulocytes, and CD11c+ dendritic cells in HF‐HC‐fed BALB/c (black dots) and BALB/c Rag1−/− (red squares) mice. Data show individual values with mean (horizontal line). (C) Heat map shows the gene expression quantified by −ΔCT normalized to Actb and Gapdh expression. (D) Bar graph of the quantified cytokine content in the blood serum from HF‐HC‐fed BALB/c Rag1−/− (red, n = 5) and BALB/c WT (black, n = 5) mice determined by multiplex analyses. Data show mean + SD; *P < 0.05, **P < 0.01, ***P < 0.001. Abbreviations: Fgf21, fibroblast growth factor 21; G‐CSF, granulocyte colony‐stimulating factor; GM‐CSF, granulocyte‐macrophage colony‐stimulating factor; WT, wild type.
FIG. 7
FIG. 7
Adoptive transfer of Teffs is not sufficient to revert the Rag1−/− NASH phenotype, while Treg transfer or anti‐CD3 intervention worsens the inflammation. (A) HF‐HC‐fed BALB/c Rag1−/− mice (black dots), BALB/c Rag1−/− mice with CD8+ T‐cell transfer (red squares), BALB/c Rag1−/− mice with Treg transfer (black open squares), and BALB/c Rag1−/− mice with CD4+ T‐cell transfer (red open squares) were analyzed at week 16 regarding their NAS, hepatic triglyceride content, and ALT and AST levels in the blood serum. Data show individual values with mean (horizontal line); P < 0.05. (B) Heat maps show serum protein expression of BALB/c Rag1−/− mice fed for 16 weeks with an HF‐HC diet and either adoptive CD4+ T‐cell (upper panel) or Treg transfer (lower panel). (C) HF‐HC diet‐fed BALB/c mice were treated at week 16 with anti‐CD3 and followed for 6 weeks (HF‐HC full black dots, HF‐HC with anti‐CD3 full red squares). Longitudinal weight gain of anti‐CD3‐treated HF‐HC diet‐fed BALB/c mice was followed over 22 weeks. Treatment efficacy was analyzed by measuring the NAS, ALT, and AST levels and hepatic triglyceride content as well as glucose intolerance. Data show mean (weight gain, glucose) or individual values with mean (horizontal line); P < 0.05. (D) Frequencies of Tregs and their Ki‐67 expression were determined by flow cytometry analysis of CD4+ cells in the IHL population from HF‐HC diet‐fed BALB/c and HF‐HC diet‐fed anti‐CD3‐treated BALB/c mice after 22 weeks. Data show individual values with mean (horizontal line); P < 0.05. (E) Heat maps show serum protein expression of HF‐HC diet‐fed BALB/c mice fed for 22 weeks with an HF‐HC diet or treated with anti‐CD3 at week 16. Abbreviations: aCD3, anti‐CD3; Acvrl1, activin A receptor like type 1; Ahr, aryl hydrocarbon receptor; Apbb1ip, amyloid beta precursor protein binding family B member 1 interacting protein; Ca13, carbonic anhydrase 13; Casp3, caspase 3; Clmp, CXADR like membrane protein; Clstn2, calsyntenin 2; Cntn1, contactin 1; Cntn4, contactin 4; Cpe, carboxypeptidase E; Crim1, cysteine rich transmembrane BMP regulator 1; Csf2, colony stimulating factor 2; Cxcl9, C‐X‐C motif chemokine ligand 9; Cyr61, cellular communication network factor 1; Dctn2, dynactin subunit 2; Ddah1, dimethylarginine dimethylaminohydrolase 1; Dll1, delta like canonical notch ligand 1; Eda2r, ectodysplasin A2 receptor; Eno2, enolase 2; Erbb4, Erb‐B2 receptor tyrosine kinase 4; Fas, fas cell surface death receptor; Flrt2, fibronectin leucine rich transmembrane protein 2; Fstl3, follistatin like 3; Gcg, glucagon; Gfra1, GDNF family receptor alpha 1; Igsf3, immunoglobulin superfamily member 3; Itgb1bp2, integrin subunit beta 1 binding protein 2; Itgb6, integrin subunit beta 6; Kitlg, KIT ligand; Lgmn, legumain; Lpl, lipoprotein lipase; Map2k6, mitogen‐activated protein kinase kinase 6; n.s., not significant; Pdgfb, platelet derived growth factor subunit B; Pla2g4a, phospholipase A2 group 4A; Plin1, perilipin 1; Qdpr, quinoid dihydropteridine reductase; Riox2, ribosomal oxygenase 2; S100a4, S100 calcium binding protein A4; Sez6l2, seizure related 6 homolog like 2; Snap29, synaptosome associated protein 29; Tgfbr3, transforming growth factor beta receptor 3; Tgfa, transforming growth factor alpha; Tnfsf12, TNF superfamily member 12; Tnfrsf12a, TNF receptor superfamily member 12A; Tnr, tenascin R; Tpp1, tripeptidyl peptidase 1; Vedfd, vascular endothelial growth factor D; Vsig, v‐set and immunoglobulin domain‐containing protein; Wfikkn2, WAP, follistatin/kazal, immunoglobulin, kunitz and netrin domain containing 2; Yes1, src family tyrosine kinase.

References

    1. Younossi ZM, Koenig AB, Abdelatif D, Fazel Y, Henry L, Wymer M. Global epidemiology of nonalcoholic fatty liver disease‐meta‐analytic assessment of prevalence, incidence, and outcomes. Hepatology 2016;64:73‐84. - PubMed
    1. Younossi Z, Anstee QM, Marietti M, Hardy T, Henry L, Eslam M, et al. Global burden of NAFLD and NASH: trends, predictions, risk factors and prevention. Nat Rev Gastroenterol Hepatol 2018;15:11‐20. - PubMed
    1. Anstee QM, Targher G, Day CP. Progression of NAFLD to diabetes mellitus, cardiovascular disease or cirrhosis. Nat Rev Gastroenterol Hepatol 2013;10:330‐344. - PubMed
    1. Wong RJ, Aguilar M, Cheung R, Perumpail RB, Harrison SA, Younossi ZM, et al. Nonalcoholic steatohepatitis is the second leading etiology of liver disease among adults awaiting liver transplantation in the United States. Gastroenterology 2015;148:547‐555. - PubMed
    1. Golabi P, Bush H, Stepanova M, Locklear CT, Jacobson IM, Mishra A, et al. Liver transplantation (LT) for cryptogenic cirrhosis (CC) and nonalcoholic steatohepatitis (NASH) cirrhosis: data from the Scientific Registry of Transplant Recipients (SRTR): 1994 to 2016. Medicine (Baltimore) 2018;97:e11518. - PMC - PubMed

Publication types

MeSH terms