. 2021 Sep 17;6(63):eabf6723.
doi: 10.1126/sciimmunol.abf6723. Epub 2021 Sep 17.

Combined immunodeficiency with autoimmunity caused by a homozygous missense mutation in inhibitor of nuclear factor 𝛋B kinase alpha (IKKα)

Affiliations

Combined immunodeficiency with autoimmunity caused by a homozygous missense mutation in inhibitor of nuclear factor 𝛋B kinase alpha (IKKα)

Wayne Bainter et al. Sci Immunol. .

Abstract

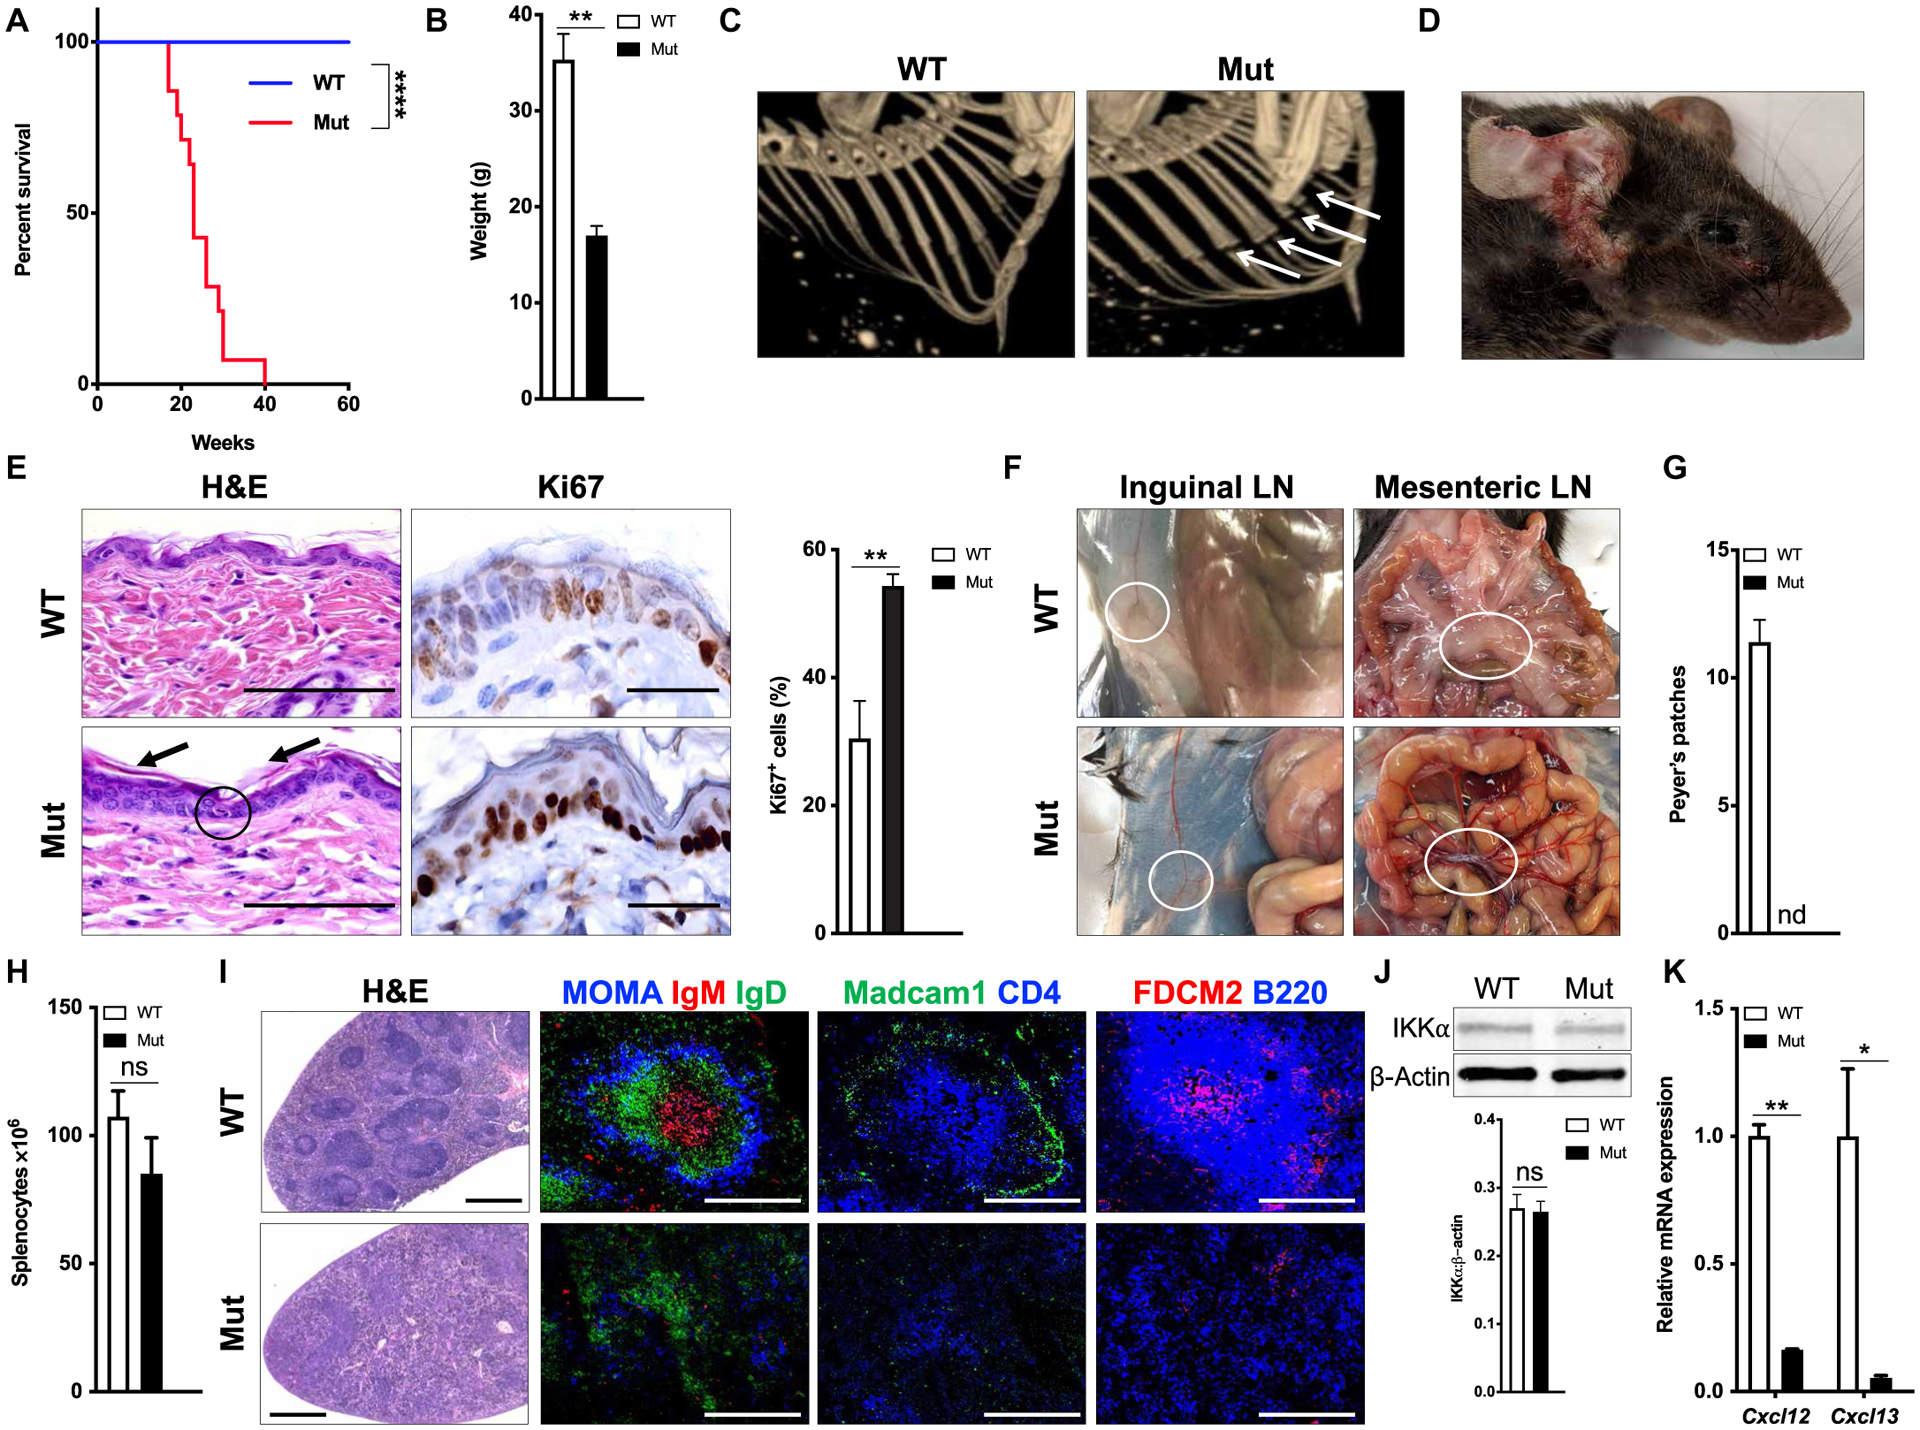
Inhibitor of nuclear factor kappa B kinase alpha (IKKα) is critical for p100/NF-κB2 phosphorylation and processing into p52 and activation of the noncanonical NF-κB pathway. A patient with recurrent infections, skeletal abnormalities, absent secondary lymphoid structures, reduced B cell numbers, hypogammaglobulinemia, and lymphocytic infiltration of intestine and liver was found to have a homozygous p.Y580C mutation in the helix-loop-helix domain of IKKα. The mutation preserves IKKα kinase activity but abolishes the interaction of IKKα with its activator NF-κB–inducing kinase and impairs lymphotoxin-β–driven p100/NF-κB2 processing and VCAM1 expression. Homozygous IKKαY580C/Y580C mutant mice phenocopy the patient findings; lack marginal zone B cells, germinal centers, and antigen-specific T cell response to cutaneous immunization; have impaired Il17a expression; and are susceptible to cutaneous Staphylococcus aureus infection. In addition, these mice demonstrate a severe reduction in medullary thymic epithelial cells, impaired thymocyte negative selection, a restricted TCRVβ repertoire, a selective expansion of potentially autoreactive T cell clones, a decreased frequency of regulatory T cells, and infiltration of liver, pancreas, and lung by activated T cells coinciding with organ damage. Hence, this study identifies IKKα deficiency as a previously undescribed cause of primary immunodeficiency with associated autoimmunity.


Conflict of interest statement

Competing interests: The authors declare that they have no competing interests.

Figures

Fig. 1.
Fig. 1.. Skeletal, skin, and organ abnormalities in the patient.
(A) Radiographs of the chest and sacrum of the patient at age 18. Arrows indicate incomplete bone fusion in the sternum and sacrum. (B) Top: Patient lesional skin stained with periodic acid–Schiff (PAS). Arrows indicate the presence of fungal elements. Bottom: IHC staining of patient lesional skin for HPV. Arrows indicate foci of intranuclear immunoreactivity for HPV protein. (C) H&E staining and IHC staining for Ki67 of nonlesional skin from the patient and skin from a HC. Scale bars, 200 μm. The H&E-stained sections demonstrate epidermal thickening and hyperkeratosis as well as increased Ki67 labeling within the basal and suprabasal layers in the patient compared with control. (D) Duodenal biopsies from patient and HC stained with H&E and for CD3+ cells by IHC. Arrows point to collections of CD3+ cells in the patient. Scale bars, 100 μm. (E) Colon biopsies from patient and HC stained with H&E. The inset shows apoptotic bodies indicated by arrows. Scale bars, 100 μm. (F) Liver biopsies from patient and HC stained with H&E (left) and for CK7 by IHC (right). Scale bars, 200 μm.
Fig. 2.
Fig. 2.. Effect of the Y580C mutation on IKKα expression and function.
(A) Family pedigree. (B) Sanger sequencing of the c.A1739G CHUK variant. (C) Linear map of IKKα with the location of the Y580C mutation. LZ, leucine zipper; NBD, NEMO-binding domain. (D) Ribbon diagram of IKKα. Insets show the potential impact of the Y580C mutation on hydrogen bond formation with neighboring residue D582. KD, kinase domain. (E) IKKα immunoblot in patient and control fibroblasts. (F) IKKα kinase activity of mutant and WT IKKα against IκBα21–41 substrate measured by ADP-Glo kinase assay. RLU, relative light unit. (G and H) Immunoblot of p100 and p52 after anti-LTβR stimulation (G) and VCAM1 mRNA levels after anti-LTβR or TNF-α stimulation (H) of patient (P) and two control (C1 and C2) fibroblasts. (I) Coimmunoprecipitation of Myc-NIK with HA-IKKα and HA-IKKαY580C (top) and immunoblots of lysates (bottom) of HEK293T transfectants. IP, immunoprecipitation. (J) Anti-HA (IKKα) immunoblots of nuclear extracts, cytoplasmic extracts, and lysates of HEK293T transfectants. α-Tubulin and lamin A/C immunoblots are used to monitor the purity of the nuclear and cytoplasmic fractions. (K) Coimmunoprecipitation of SMAD2 and SMAD3 with HA-tagged WT or IKKαY580C (top) and immunoblots of lysates (bottom). SMAD2 and SMAD3 comigrate and are recognized by the same antibody. Similar results were obtained in two other independent experiments in (E) to (K). Columns and bars in (F) and (H) represent mean and SEM of three independent experiments. *P ≤ 0.05; ns, not significant by two-tailed Student’s t test.
Fig. 3.
Fig. 3.. IKKα mutant mice die early, lack lymph nodes, and have disorganized splenic architecture.
(A) Survival curve of mutant mice (n = 16) and WT controls (n = 16 per genotype). (B) Weight of mutant mice and WT controls at 26 weeks (n = 3 per genotype). (C) Representative computerized tomography scan of chest in mutant and WT control. Arrows indicate the absence of rib bone fusion. (D) Photograph of a 26-week-old mutant mouse depicting conjunctivitis and auricular and post-auricular ulcerating skin lesion. (E) H&E staining (left) and IHC staining for Ki67 (right) with quantitation of nonlesional skin from WT and mutant mice showing mild epidermal thickening (encircled) and hyperkeratosis (arrows) as well as increased Ki67 staining within the basal cell layer in the mutant animals. Scale bars, 100 μm. (F) Absence of inguinal LNs (left) and mesenteric LNs (right) in a mutant and WT mouse. (G) Numbers of Peyer’s patches in the ileum (n = 5 per genotype). nd, not detected. (H) Splenocyte numbers in 8- to 12-week-old mice (n = 5 per genotype). (I) Representative photomicrograph of spleen sections stained with H&E (first) or by immunofluorescence for MOMA, IgM, and IgD (second), Madcam1 and CD4 (third), and FDCM2 and B220 (fourth). Scale bars, 100 μm. (J) Representative immunoblot of IKKα in splenocyte lysates from mutant and WT control and quantitation of IKKα expression (n = 3 per genotype). (K) Cxcl12 and Cxcl13 mRNA expression by splenocytes from mutants and WT controls (n = 3 per genotype). Similar results were obtained with three mice per genotype in (C), (E), (F), and (I). Columns and bars in (B), (G), (H), (J), and (K) represent mean and SEM. ****P ≤ 0.0001 by Gehan-Breslow-Wilcoxon test in (A). *P ≤ 0.05 and *P ≤ 0.01 by two-tailed Student’s t test in (B), (G), (H), (J), and (K).
Fig. 4.
Fig. 4.. B cell phenotype and function in IKKαY580C/Y580C mice.
(A to D) B cell subsets in BM (A), splenic B cell number (B) and subsets (C), and representative FACS analysis of splenic FO and MZ B cells (D) in mutant mice (n = 5) and WT controls (n = 4). FO, follicular. (E) Numbers of mutant and WT B cells after culture for 96 hours with rBAFF + IL-4 (n = 3 per genotype). (F) Distribution of B220intIgM+ B-1 and B220hi IgM+ B-2 cells among viable peritoneal lymphocytes of mutant mice (n = 5) and WT controls (n = 4). (G to I) Representative flow cytometry of CTV dye dilution (G), numbers of FVD viable cells (H), and percentage of B220intCD138+ plasmablasts (I) of mutant and WT B cells stimulated with mCD40L + IL-4 or LPS + IL-4 (n = 3 per genotype). (J) LPS-driven IgM secretion and LPS + IL-4– and mCD40L + IL-4–driven IgG secretion by mutant and WT B cells (n = 3 per genotype). (K) Serum IgG, IgA, and IgM levels in mutant mice and WT controls (n = 6 per genotype). (L) Serum IgG anti-TNP antibody response to TNP-LPS and TNP-KLH immunization in mutants and WT controls (n = 5 per genotype). OD405, optical density at 405 nm. (M) Numbers of splenic CD4+CXCR5+PD1+ TFH cells and B220+FAS+GL7+ GC B cells in TNP-KLH–immunized mice (n = 5 per genotype). (N) Representative immunofluorescence staining for CD3 and GL7 in spleen sections from TNP-KLH–immunized mice. Scale bars, 500 μm. Similar results were obtained in three mice per genotype. Columns and bars represent mean and SEM. *P ≤ 0.05, **P ≤ 0.01, ***P ≤ 0.001, and ****P ≤ 0.0001 by two-tailed Student’s t test.
Fig. 5.
Fig. 5.. Impaired IL-2 and IL-17A production by T cells and absent T cell response to cutaneous immunization in IKKαY580C/Y580C mice.
(A and B) Number of CD3+ cells and distribution of CD4+ and CD8+ T cells (A), percentage of splenic CD4+FOXP3+ Tregs among CD4+ cells (B), and distribution of CD62LhiCD44lo naïve T cells, CD62LhiCD44hi central memory T cells (CM), and CD62LlowCD44hi effector memory T cells (EM) among CD4+ and CD8+ T cells (C) in spleens of 8- to 12-week-old mutant mice and WT controls (n = 5 per genotype). (D to F) Representative histogram of CTV dye dilution and percentage of cells that have undergone cell division (D), number of FVD viable cells (E), and secretion of cytokines (F) after αCD3+ αCD28 stimulation for 72 hours of purified splenic T cells from mutant mice (n = 4) and WT controls (n = 3). (G) Cytokine secretion by OVA-stimulated splenocytes from intraperitoneally immunized mice (n = 5 per genotype). (H) Epicutaneous immunization protocol and cytokine secretion by OVA-stimulated splenocytes from epicutaneously immunized mice (n = 5 per genotype). T/S, tape stripping. Columns and bars represent mean and SEM. *P ≤ 0.05, *P ≤ 0.01, ***P ≤ 0.001, ****P ≤ 0.0001 by two-tailed Student’s t test.
Fig. 6.
Fig. 6.. Reduced cutaneous Il17a expression and susceptibility to S. aureus skin infection in IKKαY580C/Y580C mice.
(A and B) Il17a expression (A) and numbers of TCRγδ+ cells (B) in the skin of mutants and WT controls. (C to G) Representative in vivo imaging of S. aureus bioluminescence and its quantitation in mice (C), S. aureus CFUs in skin homogenates (D), cutaneous expression of Il17a (E), Il1b and Il23a (p19) (F), and AMP genes (G) postinfection of tape stripped skin with PSVue 794–labeled S. aureus USA300 strain. Measurements in (D) to (G) were made 72 hours after infection. Results are from two experiments with four to five mice per group. (H) Immunoblots of anti-Myc precipitates from 293T cells cotransfected with Myc-tagged RORγt and HA-tagged WT or mutant IKKαY580C. Results are representative of two experiments. Bars represent means ± SEM. *P < 0.05, **P < 0.01, ***P ≤ 0.001 by two-tailed Student’s t test.
Fig. 7.
Fig. 7.. IKKαY580C/Y580C mice have abolished mTEC development, decreased thymic Tregs, and a restricted TCRVβ repertoire.
(A) Number of viable thymocytes in 6- to 8-week-old mutant mice and WT controls (n = 5 per genotype). (B) Distribution of DN, DP, CD4SP (SP-4), and CD8SP (SP-8) thymocyte subsets in mutant mice and WT controls (n = 5 per genotype). (C) Percent of thymic CD4+FOXP3+ Tregs among CD4-SP cells in mutants and WT controls (n = 5 per genotype). (D) H&E staining (left) and immunofluorescence staining of AIRE or UEA-1 with 4′,6-diamidino-2-phenylindole (DAPI) in WT and mutant thymus. Scale bars, 275 μm (H&E) and 75 μm (IF, immunofluorescence). Similar results were obtained in three mice per genotype. (E) Number of CD45ClassII+EpCAM1+ total TECs, Ly51hiUEA-1low cTECs, and Ly51lowUEA-1hi mTECs in the thymus of mutant mice and WT controls (n = 5 per genotype). (F) Representative FACS plots and distribution of thymocytes undergoing negative selection in waves 1a, 2a, and 2b (left, middle, and right, respectively) in mutants and WT controls (n = 3 per genotype). (G) Representative tree maps of WT and mutant CDR3s, number of unique CDR3s, diversity index, and Shannon entropy in sorted CD4+CD8TCRβhiCCR7+MHCI+CD69CD25 M2 thymocytes (n = 6 per genotype). (H) Hydrophobicity index of CDR3 P6-P7 doublets in M2 thymocytes from mutants and controls (n = 6 per genotype). Columns and bars in (A) to (C) and (E) to (H) represent mean and SEM. *P ≤ 0.05, **P ≤ 0.01, ***P ≤ 0.001, and ****P ≤ 0.0001 by two-tailed Student’s t test.
Fig. 8.
Fig. 8.. Infiltration by activated T cells and organ damage in IKKαY580C/Y580C mice.
(A) Representative H&E staining and staining for CD3 of pancreas lung and liver of 26-week-old mutant mice and WT controls. Scale bars, 125 μm. Similar results were obtained with six mice per genotype. (B to D) Number of CD4+ and CD8+ T cells (B) and percentage of CD25+ and CD69+ cells (C) and mean fluorescence intensity (MFI) of CD25 and CD69 expression (D) in CD4+ and CD8+ T cells isolated from the livers of 26-week-old mutants and WT controls (n = 3 per genotype). (E) Percentage of CD62LlowCD44+ cells and MFI of CD44 expression in CD4+ and CD8+ T cells isolated from livers of 26-week-old mutant mice and WT controls (n = 3 per genotype). (F) Immunofluorescence staining for cleaved caspase-3 and RIP3 in liver sections from 26-week-old mutant mice and WT controls. Scale bars, 75 μm. Similar results were obtained with three mice per genotype. (G to I) Serum levels of ALT and albumin (G), insulin and amylase (H), and LDH (I) in 26-week-old mutant mice and WT controls (n = 3 per genotype). Columns and bars in (B) to (E) and (G) to (I) represent mean and SEM. *P ≤ 0.05, **P ≤ 0.01, ***P ≤ 0.001, and ****P ≤ 0.0001 by two-tailed Student’s t test.

References

    1. Malhotra D, Fletcher AL, Turley SJ, Stromal and hematopoietic cells in secondary lymphoid organs: Partners in immunity. Immunol. Rev 251, 160–176 (2013). - PMC - PubMed
    1. Sun S-C, The noncanonical NF-κB pathway. Immunol. Rev 246, 125–140 (2012). - PMC - PubMed
    1. Zhang H, Sun S-C, NF-κB in inflammation and renal diseases. Cell Biosci. 5, 63 (2015). - PMC - PubMed
    1. Hayden MS, Ghosh S, Shared principles in NF-κB signaling. Cell 132, 344–362 (2008). - PubMed
    1. Israël A, The IKK complex, a central regulator of NF-κB activation. Cold Spring Harb. Perspect. Biol 2, a000158 (2010). - PMC - PubMed

Publication types