

Impact of RBE variations on risk estimates of temporal lobe necrosis in patients treated with intensity-modulated proton therapy for head and neck cancer
- PMID: 34534047
- PMCID: PMC9969227
- DOI: 10.1080/0284186X.2021.1979248
Impact of RBE variations on risk estimates of temporal lobe necrosis in patients treated with intensity-modulated proton therapy for head and neck cancer
Abstract
Background: Temporal lobe necrosis (TLN) is a potential late effect after radiotherapy for skull base head and neck cancer (HNC). Several photon-derived dose constraints and normal tissue complication probability (NTCP) models have been proposed, however variation in relative biological effectiveness (RBE) may challenge the applicability of these dose constraints and models in proton therapy. The purpose of this study was therefore to investigate the influence of RBE variations on risk estimates of TLN after Intensity-Modulated Proton Therapy for HNC.
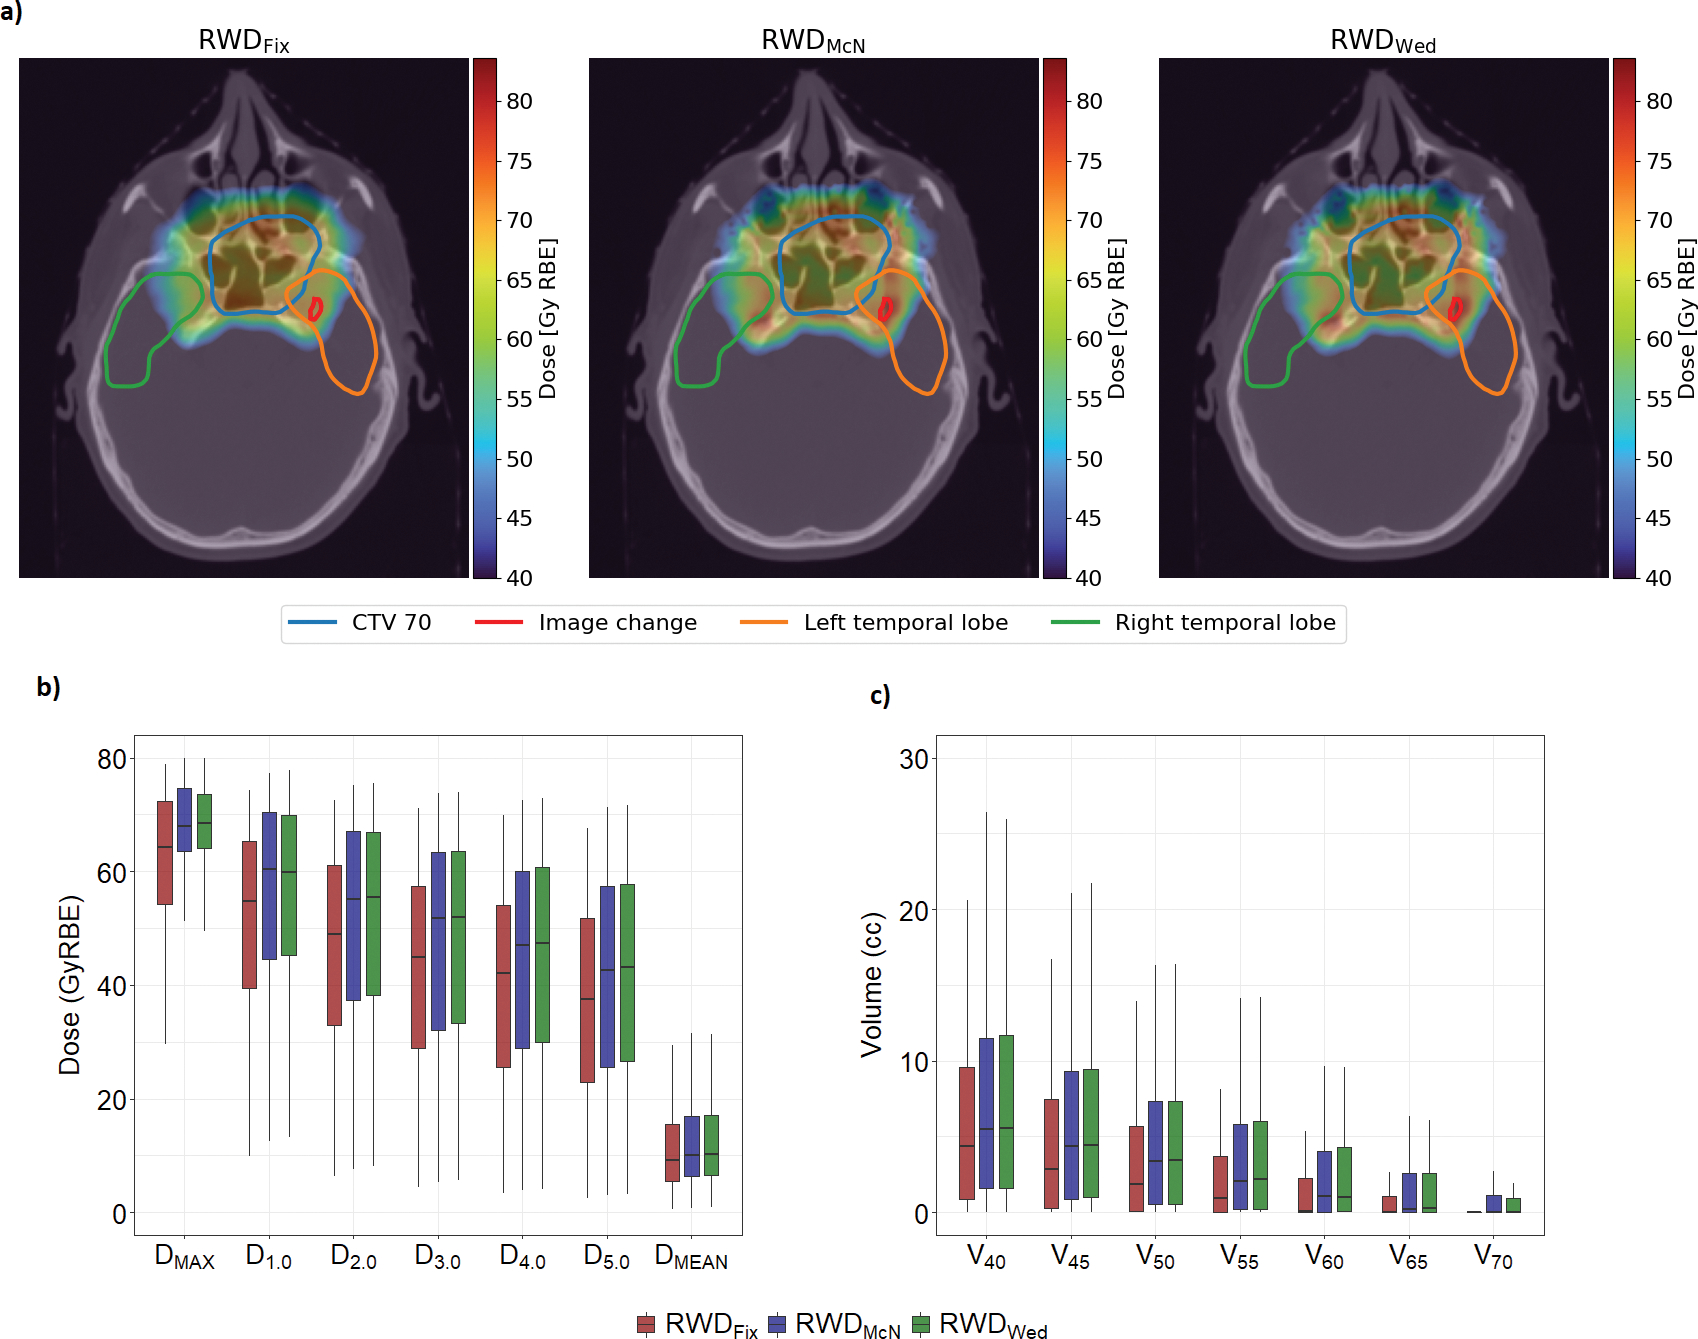
Material and methods: Seventy-five temporal lobes from 45 previously treated patients were included in the analysis. Sixteen temporal lobes had radiation associated Magnetic Resonance image changes (TLIC) suspected to be early signs of TLN. Fixed (RWDFix) and variable RBE-weighed doses (RWDVar) were calculated using RBE = 1.1 and two RBE models, respectively. RWDFix and RWDVar for temporal lobes were compared using Friedman's test. Based on RWDFix, six NTCP models were fitted and internally validated through bootstrapping. Estimated probabilities from RWDFix and RWDVar were compared using paired Wilcoxon test. Seven dose constraints were evaluated separately for RWDFix and RWDVar by calculating the observed proportion of TLIC in temporal lobes meeting the specific dose constraints.
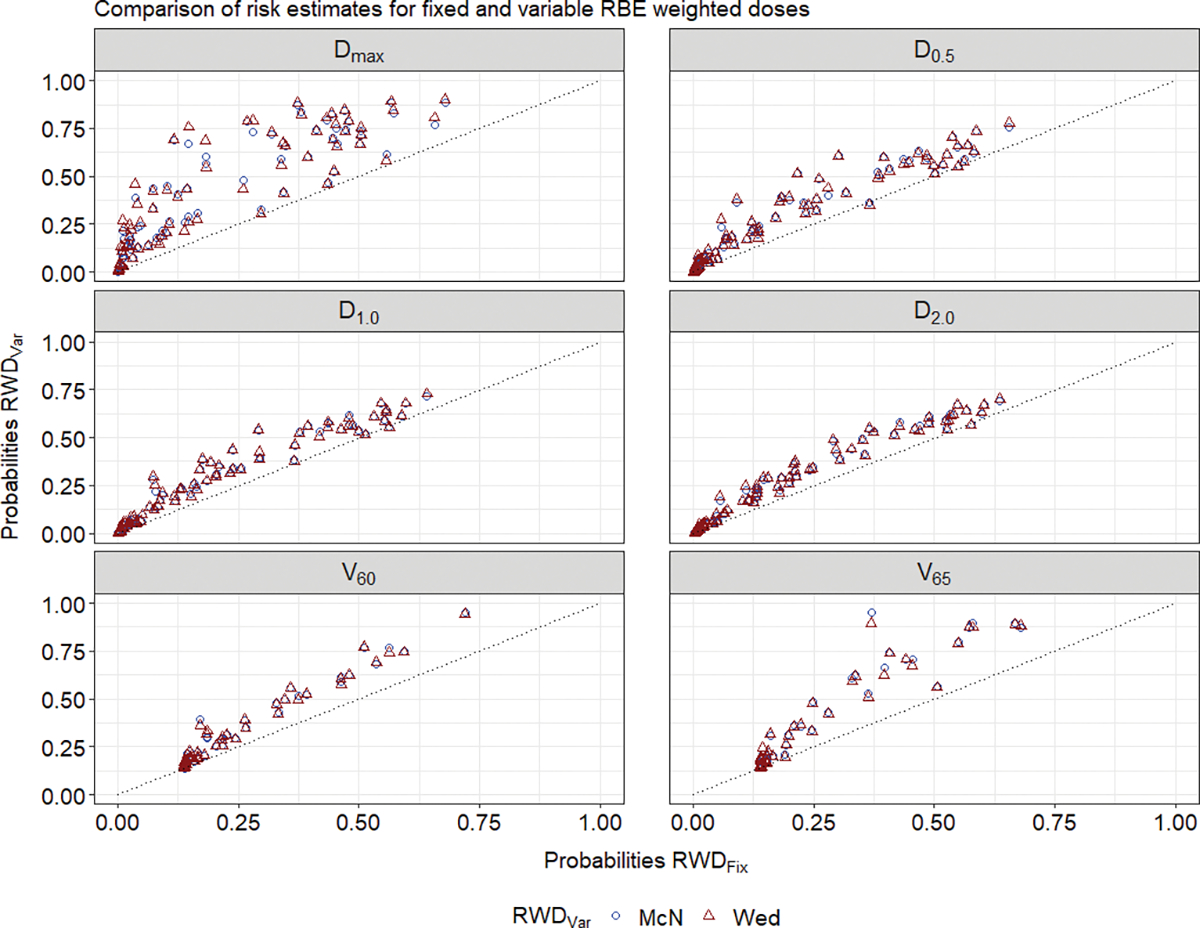
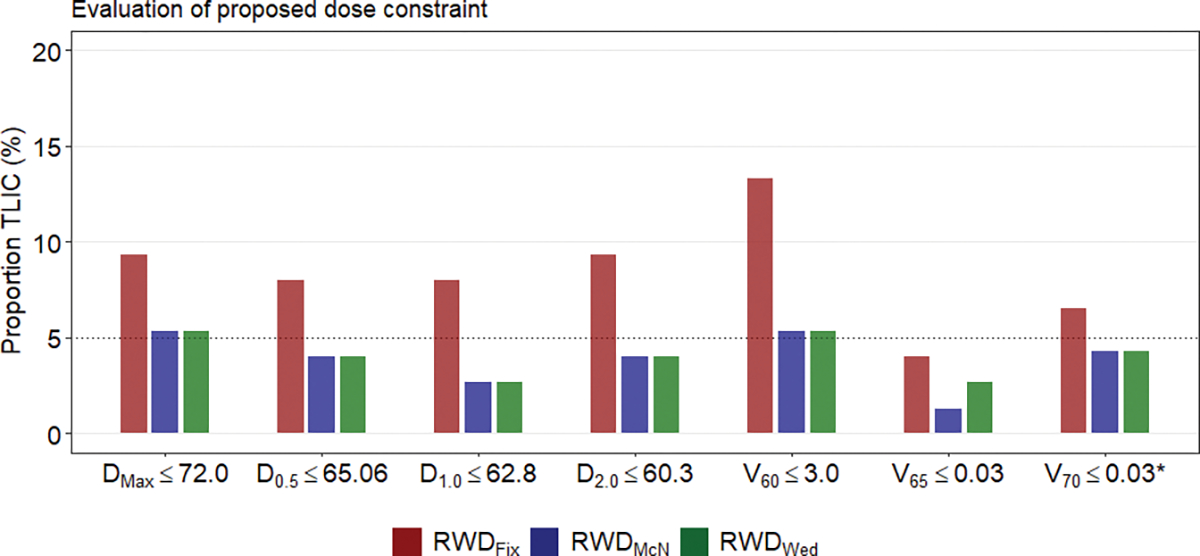
Results: RWDVar were significantly higher than RWDFix (p < 0.01). NTCP model performance was good (AUC:0.79-0.84). The median difference in estimated probability between RWDFix and RWDVar ranged between 5.3% and 20.0% points (p < 0.01), with V60GyRBE and DMax at the smallest and largest differences, respectively. The proportion of TLIC was higher for RWDFix (4.0%-13.1%) versus RWDVar (1.3%-5.3%). For V65GyRBE ≤ 0.03 cc the proportion of TLIC was less than 5% for both RWDFix and RWDVar.
Conclusion: NTCP estimates were significantly influenced by RBE variations. Dmax as model predictor resulted in the largest deviations in risk estimates between RWDFix and RWDVar. V65GyRBE ≤ 0.03 cc was the most consistent dose constraint for RWDFix and RWDVar.
Keywords: Proton therapy; cerebral necrosis; head and neck neoplasm; normal tissue complication probability; relative biological effectiveness; toxicity.
Conflict of interest statement
Disclosure of conflict of interest:
Engeseth has nothing to disclose. Hysing has nothing to disclose. Yepes has nothing to disclose. Pettersen has nothing to disclose. Mohan has nothing to disclose. Fuller reports grants from National Institutes of Health, grants, personal fees, non-financial support and other from Elekta AB, personal fees from American Association of Physicists in Medicine, personal fees from Oregon Health & Science University, outside the submitted work. Stokkevåg has nothing to disclose. Wu has nothing to disclose. Zhang has nothing to disclose. Dr. Frank reports grants from Hitachi, personal fees from Varian, grants from Eli Lilly, personal fees from Boston Scientific, outside the submitted work. Dr Gunn has nothing to disclose.
Figures
References
-
- International Commission on Radiation Units and Measurements. Report 78: Prescribing, Recording and Reporting Proton-Beam Therapy. Oxford: International Commission on Radiation Units and Measurements; 2007.
-
- Paganetti H Relative biological effectiveness (RBE) values for proton beam therapy. Variations as a function of biological endpoint, dose, and linear energy transfer. Phys Med Biol. 2014;59(22):R419–72. - PubMed
-
- Carabe A, Moteabbed M, Depauw N, Schuemann J, Paganetti H. Range uncertainty in proton therapy due to variable biological effectiveness. Phys Med Biol. 2012;57(5):1159–72. - PubMed
-
- Carabe-Fernandez A, Dale RG, Jones B. The incorporation of the concept of minimum RBE (RbEmin) into the linear-quadratic model and the potential for improved radiobiological analysis of high-LET treatments. Int J Radiat Biol. 2007;83(1):27–39. - PubMed
MeSH terms
Grants and funding
LinkOut - more resources
Full Text Sources
Other Literature Sources
Medical
Miscellaneous