Clinical application of home sleep apnea testing in children: a prospective pilot study
- PMID: 34534072
- PMCID: PMC8805000
- DOI: 10.5664/jcsm.9650
Clinical application of home sleep apnea testing in children: a prospective pilot study
Abstract
Study objectives: (1) To determine the sensitivity and specificity of the home sleep apnea test (HSAT) performed in typically developing children who were diagnosed with moderate to severe obstructive sleep apnea during overnight attended laboratory polysomnography (LPSG). (2) To determine the utility of a screening questionnaire to identify children at increased risk for obstructive sleep apnea.
Methods: Participants completed 2 consecutive study nights, the first night with the HSAT followed by LPSG on the second night. The SHOOTS questionnaire, composed of 6 questions (snoring, hyperactivity, obesity, observed apnea, tonsillar hypertrophy, and sleepiness) concerning sleep-disordered breathing, was administered by the clinician before the first study night.
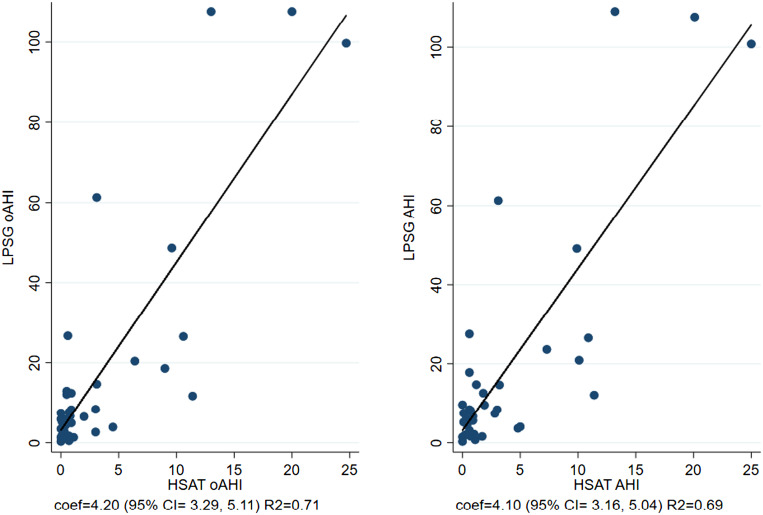
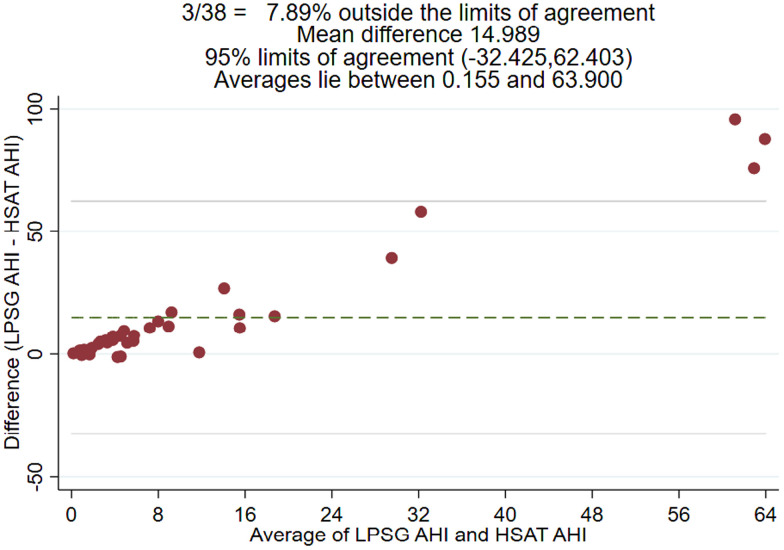
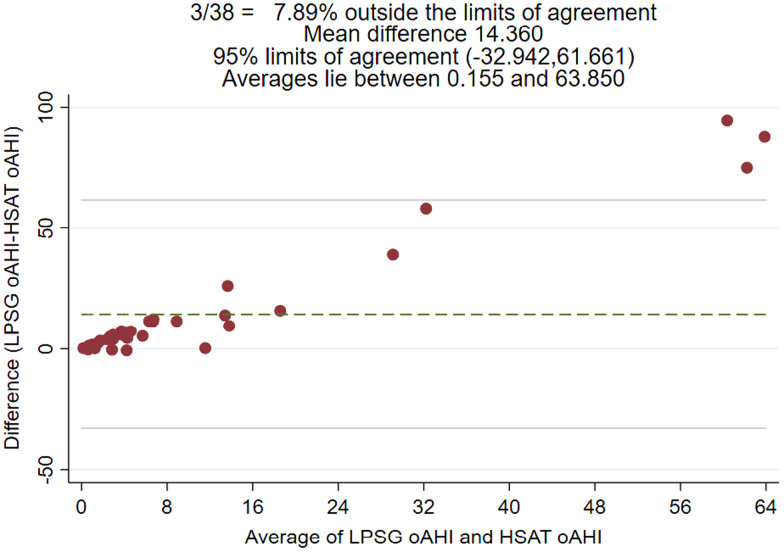
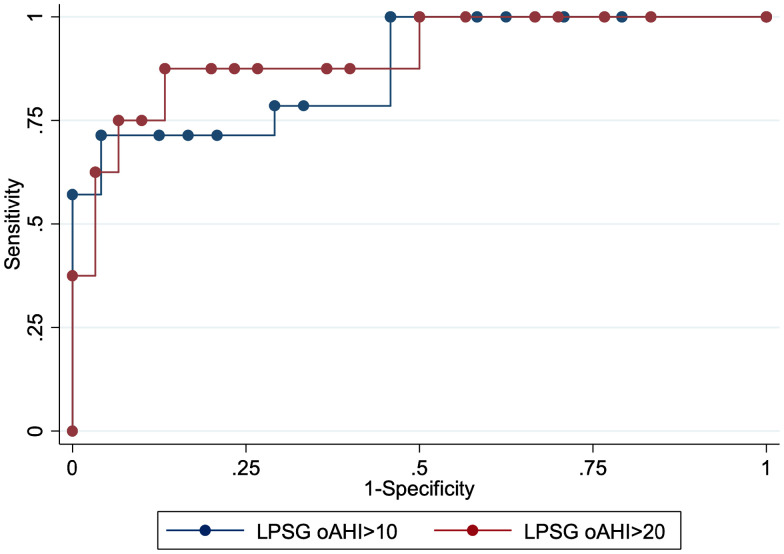
Results: Thirty-eight participants completed both studies. The mean age was 13.8 ± 3.0 years. Twenty (53%) were male. Most participants were obese. The mean LPSG total sleep time was 7.34 ± 1.19 hours; the mean HSAT total recording time was 8.86 ± 1.73 hours (P < .001). The median obstructive apnea-hypopnea index for LPSG and HSAT was 6.6 and 0.8 events/h, respectively. For an obstructive apnea-hypopnea index ≥ 3.1 events/h by HSAT, the sensitivity was 71.43% (95% confidence interval, 41.9-91.6) and the specificity was 95.83% (95% confidence interval, 78.9-99.9) for identifying those with an LPSG obstructive apnea-hypopnea index of ≥ 10 events/h. For a SHOOTS score with ≥ 4 "yes" responses, the sensitivity and specificity were 85.7% (95% confidence interval, 57.2-98.2) and 54.2% (95% confidence interval, 32.8-74.4), respectively, for identifying those with an LPSG obstructive apnea-hypopnea index ≥ 10 events/h.
Conclusions: Using HSAT, we clinically applied cutoff values to identify moderate to severe obstructive sleep apnea in typically developing children. The SHOOTS questionnaire may aid in identifying children at risk for obstructive sleep apnea and who are candidates for HSAT.
Citation: Revana A, Vecchio J, Guffey D, Minard CG, Glaze DG. Clinical application of home sleep apnea testing in children: a prospective pilot study. J Clin Sleep Med. 2022;18(2):533-540.
Keywords: HSAT; OSA; home sleep apnea test; obstructive sleep apnea; pediatrics.
© 2022 American Academy of Sleep Medicine.
Conflict of interest statement
All authors on this manuscript have reviewed, edited, and approved the manuscript. Work for this study was performed at Texas Children’s Hospital, Houston, Texas/Baylor College of Medicine, Houston, Texas. The authors report no conflicts of interest.
Figures
References
-
- Greene MG , Carroll JL . Consequences of sleep-disordered breathing in childhood . Curr Opin Pulm Med. 1997. ; 3 ( 6 ): 456 – 463 . - PubMed
-
- Schechter MS ; Section on Pediatric Pulmonology, Subcommittee on Obstructive Sleep Apnea Syndrome . Technical report: diagnosis and management of childhood obstructive sleep apnea syndrome . Pediatrics. 2002. ; 109 ( 4 ): e69 . - PubMed
MeSH terms
LinkOut - more resources
Full Text Sources
Medical