. 2022 Jan 20;34(1):333-350.
doi: 10.1093/plcell/koab229.

COPII Sec23 proteins form isoform-specific endoplasmic reticulum exit sites with differential effects on polarized growth

Affiliations

COPII Sec23 proteins form isoform-specific endoplasmic reticulum exit sites with differential effects on polarized growth

Mingqin Chang et al. Plant Cell. .

Abstract

Coat Protein complex II (COPII), a coat protein complex that forms vesicles on the endoplasmic reticulum (ER), mediates trafficking to the Golgi. While metazoans have few genes encoding each COPII component, plants have expanded these gene families, leading to the hypothesis that plant COPII has functionally diversified. In the moss Physcomitrium (Physcomitrella) patens, the Sec23/24 gene families are each composed of seven genes. Silencing Sec23/24 revealed isoform-specific contributions to polarized growth, with the closely related Sec23D/E and Sec24C/D essential for protonemal development. Focusing on Sec23, we discovered that Sec23D/E mediate ER-to Golgi transport and are essential for tip growth, with Sec23D localizing to presumptive ER exit sites. In contrast, Sec23A, B, C, F, and G are dispensable and do not quantitatively affect ER-to-Golgi trafficking. However, Δsec23abcfg plants exhibited reduced secretion of plasma membrane cargo. Of the four highly expressed protonemal Sec23 genes, Sec23F/G are members of a divergent Sec23 clade specifically retained in land plants. Notably, Sec23G accumulates on ER-associated foci that are significantly larger, do not overlap with, and are independent of Sec23D. While Sec23D/E form ER exit sites and function as bona fide COPII components essential for tip-growing protonemata, Sec23G and the closely related Sec23F have likely functionally diversified, forming separate and independent ER exit sites and participating in Golgi-independent trafficking pathways.


Figures

Figure 1
Figure 1
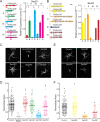
Sec23 and Sec24 are required for polarized growth. Gene models of the P. patens Sec23 (A) and Sec24 (B) genes are shown with exons indicated by boxes and introns by thin black lines. Coding and untranslated regions are denoted by thick and thin boxes, respectively. The lines underneath the gene models represent sequence regions targeted by the RNAi constructs. Scale bar is 500 bp. Graphs depict the relative expression levels of Sec23 and Sec24 genes normalized to UBIQUITIN10 in 8-day-old wild-type moss plants regenerated from protoplasts. N = 3, Error bars are standard error of the mean (sem). C and E, Representative chlorophyll autofluorescence images of 7-day-old plants regenerated from protoplasts expressing the indicated RNAi constructs. Scale bar, 100 µm. D and F, Quantification of plant area is based on the area of the chlorophyll autofluorescence and is presented normalized to the area of the control for each experiment. Means are indicated by horizontal lines. Letters indicate groups with significantly different means, as determined by a one-way ANOVA with a Tukey’s post hoc test (α = 0.05).
Figure 2
Figure 2
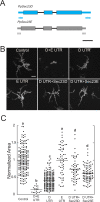
Sec23D and Sec23E are functionally redundant. A, Sec23D and Sec23E gene models are shown with exons indicated by boxes and introns by thin black lines. Coding and untranslated regions are denoted by thick and thin boxes, respectively. The lines underneath the gene models represent sequence regions that were targeted by Sec23D or Sec23E UTR RNAi constructs. Scale bar is 500 bp. B, Representative chlorophyll autofluorescence images of 7-day-old plants regenerated from protoplasts expressing the indicated constructs. Scale bar, 100 µm. C, Quantification of plant area was normalized to the control for each experiment. Letters indicate groups with significantly different means, as determined by a one-way ANOVA with a Tukey’s post hoc test (α = 0.05).
Figure 3
Figure 3
CRISPR-Cas9-mediated deletion of Sec23 isoforms demonstrates that Sec23D is critical for protonemal growth. A, Representative chlorophyll autofluorescence images of 7-day-old plants with the indicated genotype regenerated from protoplasts. Scale bar, 100 µm. B, Quantification of plant area normalized to the wild-type control. C, Representative 3-week-old moss plants with the indicated genotype. Scale bar, 1 mm. D, Quantification of the plant area of 3-week-old moss plants normalized to that of the wild-type control. E, Number of gametophores in 3-week-old moss plants. Letters in (B, D–E) indicate groups with significantly different means, as determined by a one-way ANOVA with a Tukey’s post hoc test (α = 0.05). F, Relative expression of Sec23D and E genes normalized to UBIQUITIN10 in 8-day-old wild-type and Δsec23abcfg-1, and Δsec23abcfg-2 moss plants regenerated from protoplasts. N = 3, Error bars are SEM. No significant difference (n.s.) was determined by a one-way ANOVA with a Tukey’s post hoc test (α = 0.05).
Figure 4
Figure 4
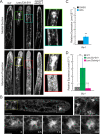
Loss of Sec23D causes ER morphology defects and ER stress. A, Laser scanning confocal images of the ER labeled with GFP-KDEL in the indicated genotype. Colored boxes highlight large and small ER aggregates found in the Δsec23d-B11 mutant. Scale bars, 5 µm. B, Spinning disc confocal super resolution imaging of the ER labeled with GFP-KDEL in a Δsec23d-B11 cell. Scale bar, 5 µm. The box outlined with a yellow dotted line is enlarged to the right, and the box outlined with a white dotted line is enlarged below, with optical sections spaced every 0.5 µm shown for this region of the cell. Scale bars in boxed regions, 2 µm. Also see Movie 1. C and D, Relative expression of PpBip1 in 8-day-old moss plants regenerated from protoplasts. N = 3, Error bars are sem. Asterisks denote t-probability <0.01. n.s. denotes no significant difference. In (B), BFA-treated plants were normalized to DMSO-treated plants and in (C), null mutants were normalized to wild-type plants.
Figure 5
Figure 5
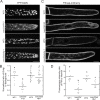
Deletion of Sec23D inhibits Golgi trafficking and secretion to the plasma membrane. A, Representative maximum projections of confocal images of the indicated genotypes expressing a YFP-MAN marker. Scale bar, 10 µm. B, Quantification of the fluorescence intensity ratio within the Golgi to the intensity within the cell. C, Representative medial sections of confocal images of the indicated genotypes expressing a plasma membrane marker (FSnap-mCherry). Scale bar, 10 µm. D, Quantification of the fluorescence intensity ratio of the plasma membrane to the intensity within the cell. Letters in (B and D) indicate groups with significantly different means, as determined by a one-way ANOVA with a Tukey’s post hoc test (α = 0.05).
Figure 6
Figure 6
Sec23 isoforms localize to ER proximal structures with distinct sizes. A, Representative confocal Z-sections of lines where the indicated Sec23 gene was endogenously tagged with 3XmRuby in a line that expresses GFP-KDEL labeling the ER lumen (ER-GFP). Scale bars, 5 µm. Boxed region in the mRuby channel is shown to the right of each image. B, Pearson’s correlation coefficient measured between the Sec23 labeled lines and ER-GFP. O, original ER image; V, vertically flipped ER image; H, horizontally flipped ER image. Asterisks denote P < 0.001, as determined by a one-way ANOVA with a Tukey’s post hoc test (α = 0.05). C, Representative confocal Z-sections of Sec23 genes endogenously tagged with 3XmRuby acquired with the optimal resolution of the confocal imaging system. Scale bars, 5 µm. D, Quantification of average dot size in the Sec23 images, as determined using the diAna tool for Fiji (Gilles et al., 2017). Asterisks denote P < 0.001, as determined by a one-way ANOVA with a Tukey post hoc test (α = 0.05).
Figure 7
Figure 7
Sec23B and Sec23G form ER-associated foci independent of Sec23D. Representative confocal Z-sections of Sec23D-mRuby lines where Sec23B (A) or Sec23G (B) were endogenously tagged with mNeon. Scale bar, 5 µm. Yellow boxed regions are enlarged to the right of the merged image, where Sec23D-mRuby is false-colored magenta; Sec23B-mNeon is false-colored green in (A), and Sec23G-mNeon is false-colored green in (B). C, Percent of Sec23B-mNeon or Sec23G-mNeon dots that co-localized with Sec23D-mRuby and (D) center-to-center distance of co-localized particles, as determined using the diAna tool for Fiji (Gilles et al., 2017). E, Representative confocal Z-sections of wild-type and Δsec23d-5 cells with either Sec23B or Sec23G endogenously tagged with 3XmRuby. Scale bar, 5 µm. F, Quantification of average dot size, as determined using the diAna tool for Fiji (Gilles et al., 2017). Sec23B and Sec23G dot sizes in the wild-type are the same data presented in Figure 6D. Student’s t test was performed for data in (C, D, and F). The t-probability is indicated for each data pair in each graph. n.s. denotes no significant difference.
None

Comment in

  • Back to the roots: A focus on plant cell biology.
    Weijers D, Bezanilla M, Jiang L, Roeder AHK, Williams M. Weijers D, et al. Plant Cell. 2022 Jan 20;34(1):1-3. doi: 10.1093/plcell/koab278. Plant Cell. 2022. PMID: 34755878 Free PMC article. No abstract available.

References

    1. Aridor M (2018) COPII gets in shape: lessons derived from morphological aspects of early secretion. Traffic 19: 823–839 - PubMed
    1. Aridor M, Fish KN, Bannykh S, Weissman J, Roberts TH, Lippincott-Schwartz J, Balch WE (2001) The Sar1 Gtpase coordinates biosynthetic cargo selection with endoplasmic reticulum export site assembly. J Cell Biol 152: 213–230 - PMC - PubMed
    1. Aridor M, Weissman J, Bannykh S, Nuoffer C, Balch WE (1998) Cargo selection by the COPII budding machinery during export from the ER. J Cell Biol 141: 61–70 - PMC - PubMed
    1. Augustine RC, Pattavina KA, Tüzel E, Vidali L, Bezanilla M (2011) Actin interacting protein1 and actin depolymerizing factor drive rapid actin dynamics in Physcomitrella patens. Plant Cell 23: 3696–3710 - PMC - PubMed
    1. Barlow LD, Dacks JB (2018) Seeing the endomembrane system for the trees: evolutionary analysis highlights the importance of plants as models for eukaryotic membrane-trafficking. Semin Cell Dev Biol 80: 142–152 - PubMed

Publication types

MeSH terms