. 2021 Nov 9;54(11):2481-2496.e6.
doi: 10.1016/j.immuni.2021.08.020. Epub 2021 Sep 16.

Antigen and checkpoint receptor engagement recalibrates T cell receptor signal strength

Affiliations

Antigen and checkpoint receptor engagement recalibrates T cell receptor signal strength

Thomas A E Elliot et al. Immunity. .

Abstract

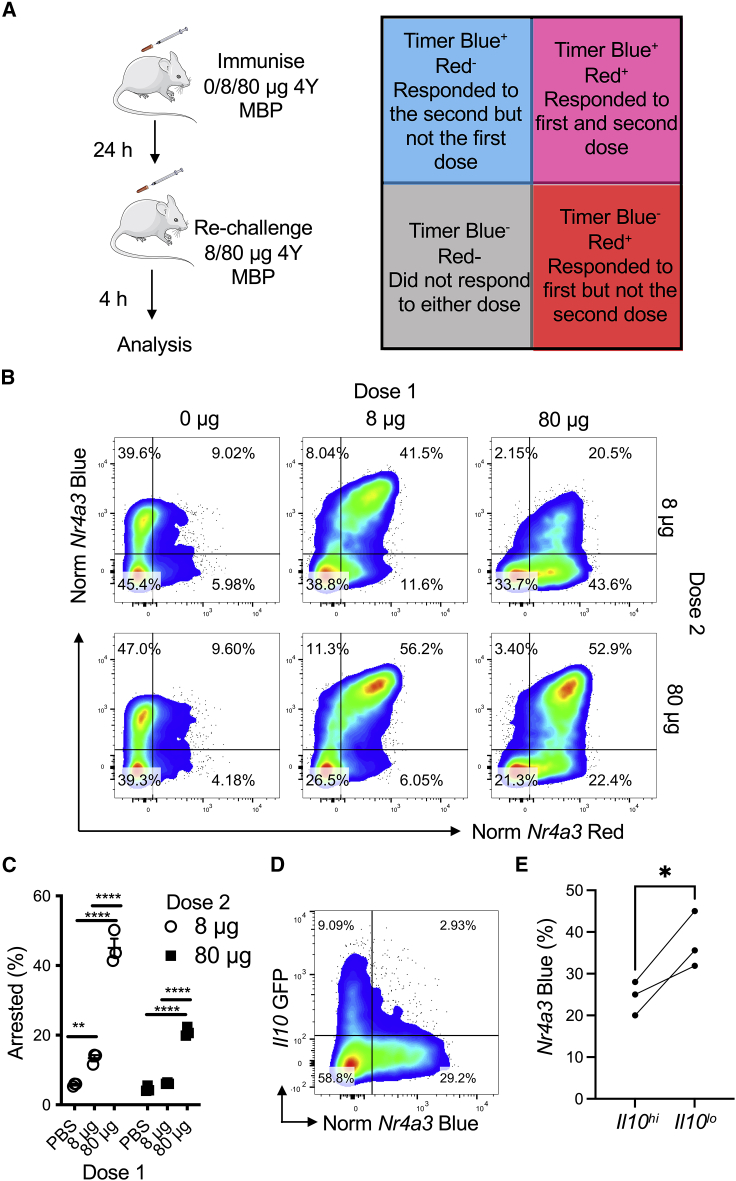
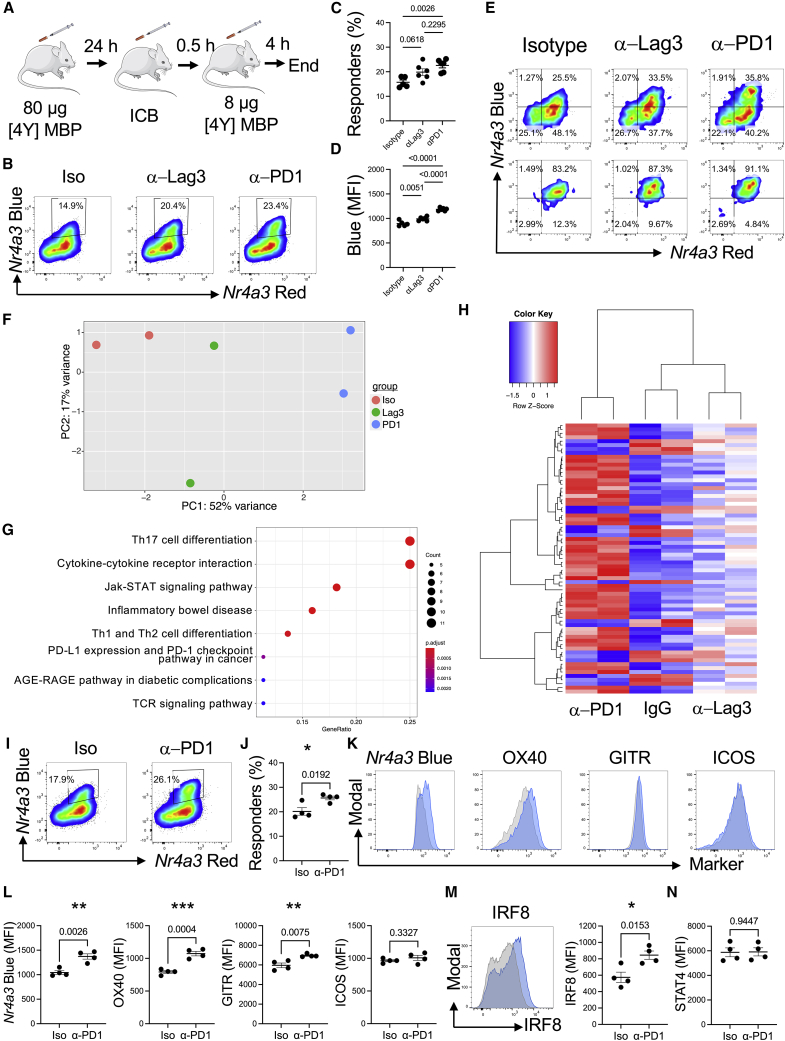
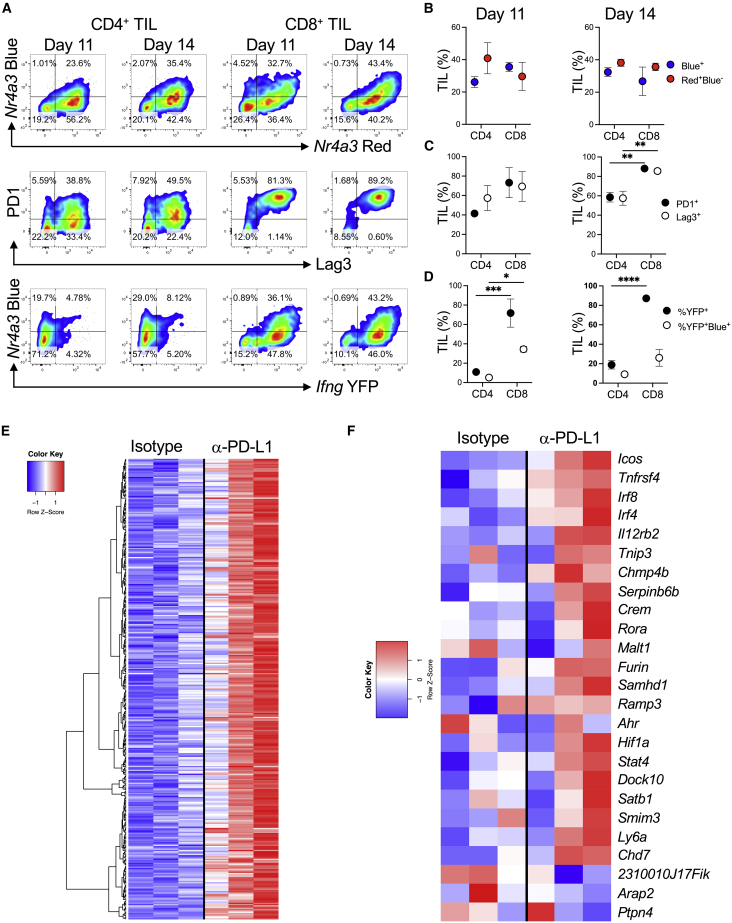
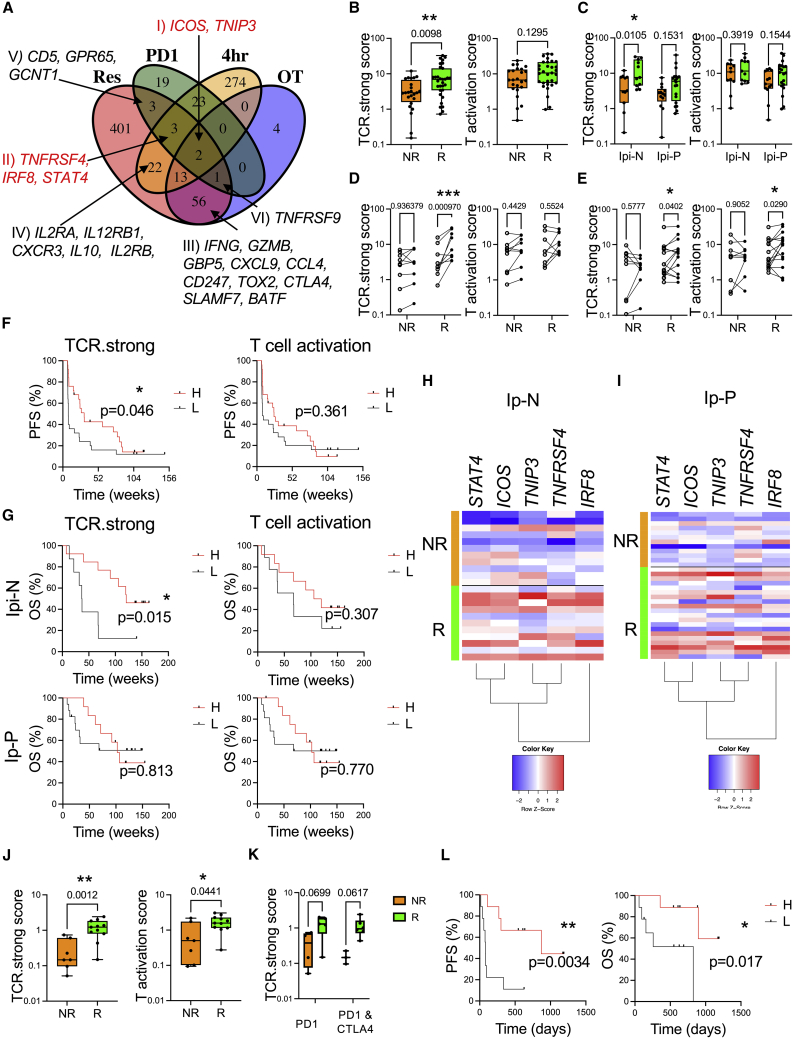
How T cell receptor (TCR) signal strength modulates T cell function and to what extent this is modified by immune checkpoint blockade (ICB) are key questions in immunology. Using Nr4a3-Tocky mice, we characterized early quantitative and qualitative changes that occur in CD4+ T cells in relation to TCR signaling strength. We captured how dose- and time-dependent programming of distinct co-inhibitory receptors rapidly recalibrates T cell activation thresholds and visualized the immediate effects of ICB on T cell re-activation. Our findings reveal that anti-PD1 immunotherapy leads to an increased TCR signal strength. We defined a strong TCR signal metric of five genes upregulated by anti-PD1 in T cells (TCR.strong), which was superior to a canonical T cell activation gene signature in stratifying melanoma patient outcomes to anti-PD1 therapy. Our study therefore reveals how analysis of TCR signal strength-and its manipulation-can provide powerful metrics for monitoring outcomes to immunotherapy.

Keywords: ICOS; IRF8; Nr4a3; OX40; PD1; TCR signaling; TCR.strong; immunotherapy; melanoma; nivolumab.


Conflict of interest statement

Declaration of interests The authors declare no competing interests.

Figures

None
Graphical abstract
Figure 1
Figure 1
Antigen dose drives digital Nr4a3 activation at the single-cell level but graded responses at population and phenotypic levels (A) Tg4 Nr4a3-Tocky Il10-GFP system. (B) Tg4 Nr4a3-Tocky Il10-GFP mice were immunized s.c. with 0.8 μg, 8 μg, or 80 μg of [4Y] MBP peptide (without adjuvant) and splenic CD4+ T cell responses analyzed for Nr4a3-Red versus Nr4a3-Blue expression in live CD4+ Tg4 T cells. (C and D) Summary data of (C) the percent of CD4+ Tg4 T cells exhibiting active TCR signaling (percentage of total cells Nr4a3-Blue+ irrespective of Red status) or (D) mean Nr4a3-Timer Angle in 0.8 μg (white), 8 μg (black), or 80 ug (red) immunized mice. Circles represent mean ± SEM. Statistical analysis by two-way Anova with Tukey’s multiple comparisons test. Significant differences (p < 0.05) between 80 μg and 0.8 μg (), 80 μg and 8 μg (#), or 8 μg and 0.8 μg (!). (E) Tg4 Nr4a3-Tocky Il10-GFP mice were immunized s.c. with 0.8 μg, 8 μg, or 80 μg of [4Y] MBP peptide and splenic CD4+ T cell responses analyzed for CD4 versus Il10-GFP in Nr4a3-Timer+ T cells at 24 h post immunization. (F) Summary data of Il10-GFP expressers (percent of CD4+) in the three experimental groups. n = 4, bars represent mean ± SEM, statistical analysis by one-way Anova with Tukey’s multiple comparisons test. ∗∗∗p < 0.001, ∗∗ = p < 0.01. Please also see Figure S1.
Figure 2
Figure 2
CD4+ T cells rapidly discriminate stimulation strength through transcriptionally distinct and time-dependent activation profiles (A) Tg4 Nr4a3-Tocky Il10-GFP mice were immunized s.c. with 0.8 μg or 80 μg of [4Y] MBP peptide (without adjuvant) and splenic CD4+ T cell responses analyzed for Nr4a3-Timer Red versus Nr4a3-Timer Blue expression in live CD4+ Tg4 T cells at the indicated time points. (B) RNA was extracted from the sorted populations and 3′ mRNA sequencing performed. PCA of the normalized expression data identifies 7 clusters. (C) Differentially expressed genes (DEGs) identified using DESeq2 between 80 μg and 0.8 μg stimulated T cells at indicated time points. Up DEG are in red and down DEG in blue. (D) Venn diagram analysis of up and down DEG at 4-, 12-, and 24-h time points. (E and F) KEGG pathway analysis of DEG between 80 μg and 0.8 μg at 4-h (E) or 12-h (F) time points. (G) Z score heatmap analysis of log2 transformed and normalized counts. Please also see Figure S2 and Tables S1 and S2.
Figure 3
Figure 3
Strong TCR signaling drives high amounts of immune checkpoint expression (A) Heatmap comparing key inhibitory receptors and their relationships to Nr4a expression from Figure 2G. (B) PD1 expression on live CD4+Nr4a3-Timer+ T cells 12 h following immunization, n = 3. Bars represent mean ± SEM. Statistical analysis by one-way Anova with Tukey’s multiple comparisons test. ∗∗p < 0.01, ∗∗∗p < 0.001; ns, not significant. (C and D) Lag3 (C, n = 6) or Tigit (D, n = 6) expression on live CD4+Nr4a3-Timer+ T cells 24 h after immunization. Statistical analysis by one-way Anova with Tukey’s multiple comparisons test. Bars represent mean ± SEM. ∗∗p < 0.01, ∗∗∗∗p < 0.0001; ns, not significant. (E) CD4 versus intracellular CTLA-4 expression in live CD4+ T cells 24 h after immunization with the stated doses. (F) Lag3 and Tigit expression on live CD4+Il10-GFPhi (green) or Il10-GFPlo (gray) Nr4a3-Timer+ T cells 24 h after immunization with 80 μg [4Y] MBP. (G) Summary data of (F), n = 3. Statistical analysis by unpaired t test. Bars represent mean ± SEM. ∗∗p < 0.01, ∗∗∗p < 0.001
Figure 4
Figure 4
Nr4a3 activation threshold is calibrated by dose dependent negative feedback (A) Experimental setup and interpretation for part (B). (B) Tg4 Nr4a3-Tocky Il10-GFP mice were immunized s.c. with 0 μg, 8 μg, or 80 μg of [4Y] MBP. 24 h later mice were randomized to receive either 8 μg or 80 μg [4Y] MBP re-challenge before splenic CD4+ T cells were analyzed for normalized Nr4a3-Timer Blue versus normalized Nr4a3-Timer Red analysis 4 h after peptide re-challenge. (C) Summary data of the frequency of arrested TCR signaling T cells from (B), n = 3, bars represent mean ± SEM, statistical analysis by two-way Anova with Sidak’s multiple comparisons test. (D) Tg4 Nr4a3-Tocky Il10-GFP mice were immunized for 24 h with 80 μg [4Y] MBP before re-challenge for 4 h with 8 μg [4Y] MBP and then normalized Nr4a3-Timer Blue versus Il10-GFP analyzed in CD4+ Tg4 T cells. (E) Summary data of percent of Nr4a3-Blue+ following 8 μg re-challenge in (D) in Il10-GFPhi versus Il10-GFPlo cells, n = 3. Statistical analysis by paired t test. Please also see Figure S3.
Figure 5
Figure 5
Co-inhibitory receptors exert distinct quantitative and qualitative control over T cell re-activation (A) Experimental design for blockade of co-inhibitory receptors. (B) Tg4 Nr4a3-Tocky Il10-GFP mice were immunized s.c. with 80 μg of [4Y] MBP. 24 h later mice were randomized to receive either 0.5 mg isotype pool (1:1 ratio of rat IgG1 and rat IgG2a), anti-Lag3, or anti-PD1 30 min prior to re-challenge with 8 μg [4Y] MBP peptide. Splenic CD4+ T cells were analyzed for Nr4a3-Blue versus Nr4a3-Red analysis 4 h after peptide re-challenge. (C and D) Summary data from (B) detailing the percentage of responders (percent of Nr4a3-Blue+Red+, C) or median Nr4a3-Blue within Nr4a3-Blue+Red+ CD4+ T cells (D) in isotype (n = 5), anti-Lag3 (n = 6), or anti-PD1 (n = 6) treated mice. Bars represent mean ± SEM, dots represent individual mice. Statistical analysis by one-way ANOVA with Tukey’s multiple comparisons test. (E) Tg4 Nr4a3-Tocky Il10-GFP mice were immunized s.c. with 80 μg of [4Y] MBP. 24 h later, mice were randomized to receive 0.8 mg isotype pool, 0.8 mg anti-Lag3, or 0.8 mg anti-PD1 30 min prior to re-challenge with 8 μg [4Y] MBP peptide. Splenic CD4+ T cells expression of Nr4a3-Blue versus Nr4a3-Red 4 h after peptide re-challenge in pre-sorted (top) and sorted (bottom) populations. (F) RNA was extracted from the sorted populations and 3′ mRNA-seq performed. PCA of the normalized expression data identified 3 clusters, n = 2. (G) KEGG pathway analysis of DEG between isotype and anti-PD1 treated groups. (H) Z score heatmap analysis of log2 transformed and normalized counts displaying the 69 DEG between isotype and anti-PD1 groups, in isotype, anti-PD1, or anti-Lag3 groups. (I) Tg4 Nr4a3-Tocky Il10-GFP mice were immunized s.c. with 80 μg of [4Y] MBP. 24 h later mice received 0.5 mg rat IgG2a or or anti-PD1 30 min prior to re-challenge with 8 μg [4Y] MBP peptide. Splenic CD4+ T cells were analyzed for Nr4a3-Blue versus Nr4a3-Red analysis 4 h after peptide re-challenge. Gates were set on responding T cells. (J) Summary data from (I) for cells responding to dose 2 (n = 4). Bars represent mean ± SEM. ∗p < 0.05 by unpaired t test. (K) Histograms showing expression of Nr4a3, OX40, GITR and ICOS in responding T cells (indicated by gates in I) between isotype (gray)- or anti-PD1 (blue)-treated cells. (L) Summary data of the median of expression of the stated markers in responding T cells, n = 4. Bars represent mean ± SEM. Statistical analysis by unpaired t test. ∗∗p < 0.01, ∗∗∗p < 0.001. (M) Analysis of intracellular IRF8 in CD4+ Tg4 T cells from isotype (gray)- or anti-PD1 (blue)-treated mice, n = 4. Bars represent mean ± SEM. Statistical analysis by unpaired t test. ∗p < 0.05.. (N) Analysis of intracellular STAT4 in isotype or anti-PD1 treated mice. Bars represent mean ± SEM, n = 4. Please also see Figures S4 and S5 and Table S3.
Figure 6
Figure 6
Strong TCR signaling signatures in tumors of anti-PD-L1-treated mice (A) 0.25 M MC38 cells were injected s.c. into Nr4a3-Tocky Ifng-YFP mice. CD4+ and CD8+ TILs were analyzed for Nr4a3-Blue versus Red (top), PD1 versus Lag3 (middle), or Nr4a3-Blue versus Ifng-YFP (bottom) expression. (B–D) Summary data of percentage of TIL for (B) Nr4a3-Blue+ (blue) or Nr4a3-Red+Blue (red), (C) PD1+ (black) or Lag3+ (white), and (D) Ifng-YFP+ (black) or percentage of Ifng+Nr4a3-Blue+ (white), n = 3. Circles represent mean ± SEM. Statistical analysis by two-way Anova with Sidak’s multiple comparisons test. ∗p < 0.05, ∗∗p < 0.01, ∗∗∗p < 0.001, ∗∗∗∗p < 0.0001. (E) Heatmap of log2 transformed and normalized counts for genes significantly upregulated (>1.5-fold and adjusted p value < 0.05) in C57BL/6 mice injected with 0.5 M MC38 cells then treated with isotype or anti-PD-L1 every 3 to 4 days before whole tumors were excised and 3′ mRNA-seq was performed (GEO: GSE93018) (Efremova et al., 2018). (F) Z score heatmap analysis of log2 transformed and normalized counts for genes pre-selected from Figure S5A and also expressed in GEO: GSE93018 (Efremova et al., 2018). See also Figure S6.
Figure 7
Figure 7
Identification of a strong TCR signal metric that stratifies melanoma patient responses to nivolumab therapy (A) DEG from 4-h time point of 80 μg versus 0.8 μg [4Y] MBP (4 h; Figure 2), isotype versus anti-PD1 (PD1; Figure 5) were intersected with DEG from melanoma patients who received nivolumab therapy (Riaz et al., 2017). The DEG in these patients were then classified based on (1) the change in expression that occurred on therapy regardless of response compared with pre-therapy samples (OT) and (2) DEG that changed compared with pre-therapy samples in those patients showing clinical responses (Res). For human datasets, a log fold-change > 0.5 and adjusted p value < 0.1 was set. Genes of interest within the sets are annotated. Full lists of genes upregulated in the four datasets are listed in Table S4. (B) TCR.strong (left) or T activation scores in on-therapy samples in responder (green, n = 31) and non-responder (orange, n = 24) statistical analysis by Mann-Whitney U test. Box plot with bars displaying median and IQR and whiskers the min and max values. ∗∗p < 0.01. (C) TCR.strong or T activation score in on-therapy samples in responder (green, Ipi-P n = 20, Ipi-N n = 11) and non-responder (orange, Ipi-P n = 13, Ipi-N n = 11) patients. Box plot with bars displaying median and IQR and whiskers the min and max values. Statistical analysis by two-way ANOVA with Sidak's multiple compaisons test. ∗p < 0.05. (D) TCR.strong or T activation scores in Ipi-N patients before and after therapy (paired samples indicated by lines), in non-responder (NR, n = 9) or responder (R, n = 9). Statistical analysis by repeated measures two-way ANOVA with Sidak's multiple compaisons test. ∗∗∗p < 0.001. (E) TCR.strong or T activation scores in Ipi-P patients before and after therapy in non-responder (NR, n = 9) or responder (R, n = 15). Statistical analysis by repeated measures two-way ANOVA with Sidak's multiple compaisons test. ∗p < 0.05. Dots represent individual patients and lines pairing of samples in (D) and (E). Statistical analysis by two-way ANOVA with Sidak’s multiple comparisons test. (F) Kaplan Meier progression free survival (PFS) curves based on median TCR.strong or T activation scores (n = 50). Statistical analysis by Log-rank test, ∗p < 0.05. (G) Kaplan Meier survival curves for melanoma patients in Ipi-N (top, n = 21) or Ipi-P (bottom, n = 29) based on median (from F) TCR.strong (left) or T activation (right scores). Statistical analysis by Log-rank test, ∗p < 0.05. (H and I) Comparison of survival curves by log-rank test. Z score heatmap analysis of log2 transformed and normalized counts for TCR.strong metric genes in Ipi-N (H) or Ipi-P (I) patients. Orange indicates non-responder patients, green indicates responder. (J) TCR.strong (left) or T activation scores (right) in early during therapy samples from (Gide et al., 2019) in responder (green, n = 11) and non-responder (orange, n = 7), Box plot with bars displaying median and IQR and whiskers the min and max values. statistical analysis by Mann-Whitney U test. ∗p < 0.05, ∗∗p < 0.01. (K) TCR.strong scores in responder (green, anti-PD1 n = 5; anti-PD1 and anti-CTLA4 n = 6) and non-responder (orange, anti-PD1 n = 4, anti-PD1 and anti-CTLA4 n = 3) patients. Box plot with bars displaying median and IQR and whiskers the min and max values. Statistical analysis by two-way ANOVA with Sidak's multiple comparisons test. (L) Kaplan Meier PFS (left) or OS (right) curves split by median TCR.strong scores (n = 18) in (Gide et al., 2019) early during therapy cohort. Statistical analysis by Log-rank test, ∗p < 0.05, ∗∗p < 0.01. Please also see Figure S7 and Tables S4, S5, and S6.

References

    1. Altan-Bonnet G., Germain R.N. Modeling T cell antigen discrimination based on feedback control of digital ERK responses. PLoS Biol. 2005;3:e356. - PMC - PubMed
    1. Ayers M., Lunceford J., Nebozhyn M., Murphy E., Loboda A., Kaufman D.R., Albright A., Cheng J.D., Kang S.P., Shankaran V., et al. IFN-γ-related mRNA profile predicts clinical response to PD-1 blockade. J. Clin. Invest. 2017;127:2930–2940. - PMC - PubMed
    1. Bending D., Paduraru A., Ducker C.B., Prieto Martín P., Crompton T., Ono M. A temporally dynamic Foxp3 autoregulatory transcriptional circuit controls the effector Treg programme. EMBO J. 2018;37:e99013. - PMC - PubMed
    1. Bending D., Prieto Martín P., Paduraru A., Ducker C., Marzaganov E., Laviron M., Kitano S., Miyachi H., Crompton T., Ono M. A timer for analyzing temporally dynamic changes in transcription during differentiation in vivo. J. Cell Biol. 2018;217:2931–2950. - PMC - PubMed
    1. Bevington S.L., Ng S.T.H., Britton G.J., Keane P., Wraith D.C., Cockerill P.N. Chromatin Priming Renders T Cell Tolerance-Associated Genes Sensitive to Activation below the Signaling Threshold for Immune Response Genes. Cell Rep. 2020;31:107748. - PMC - PubMed

Publication types

MeSH terms