. 2021 Sep 30;184(20):5247-5260.e19.
doi: 10.1016/j.cell.2021.08.025. Epub 2021 Sep 16.

Genome-wide functional screen of 3'UTR variants uncovers causal variants for human disease and evolution

Affiliations

Genome-wide functional screen of 3'UTR variants uncovers causal variants for human disease and evolution

Dustin Griesemer et al. Cell. .

Abstract

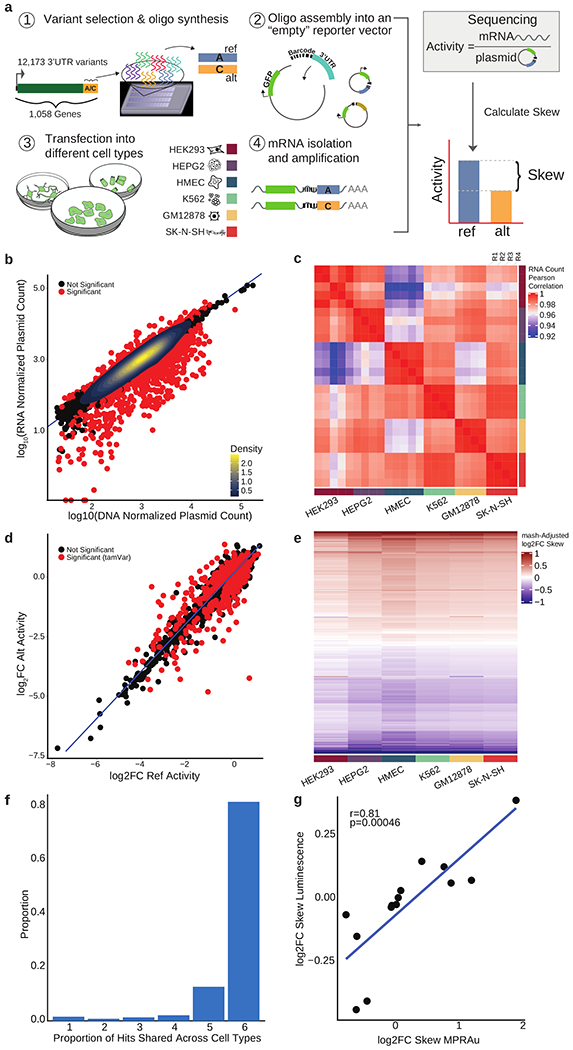
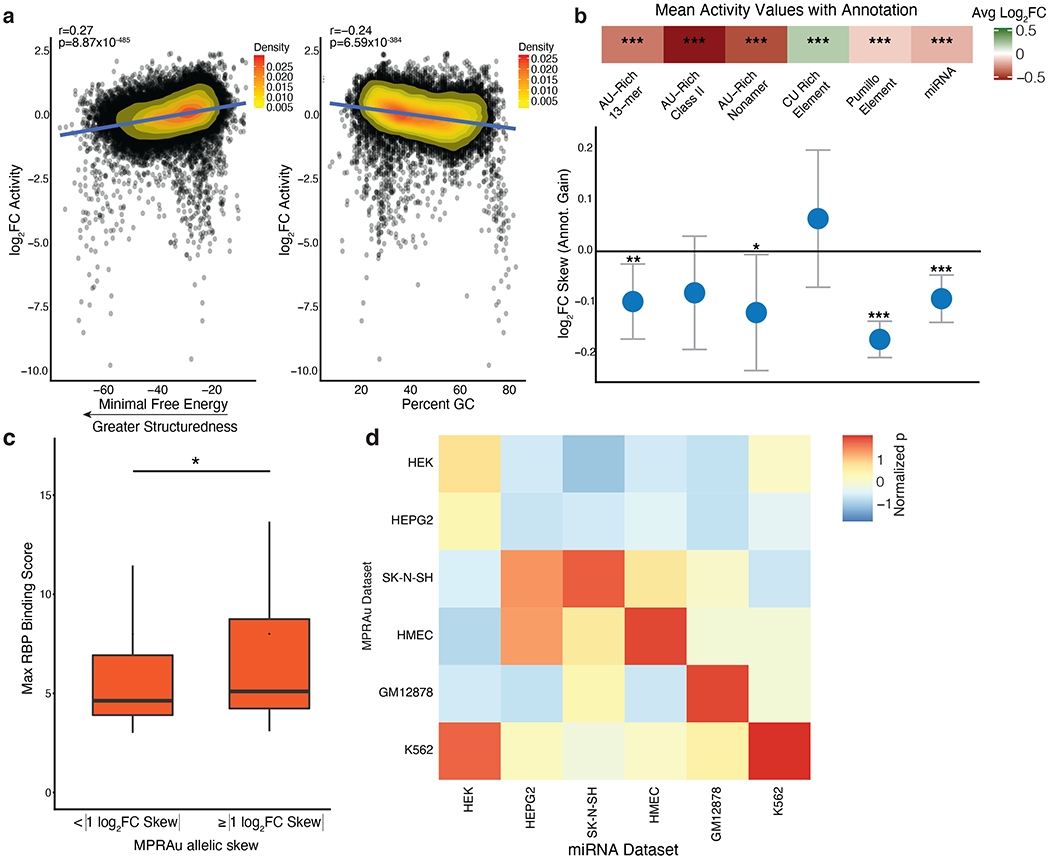
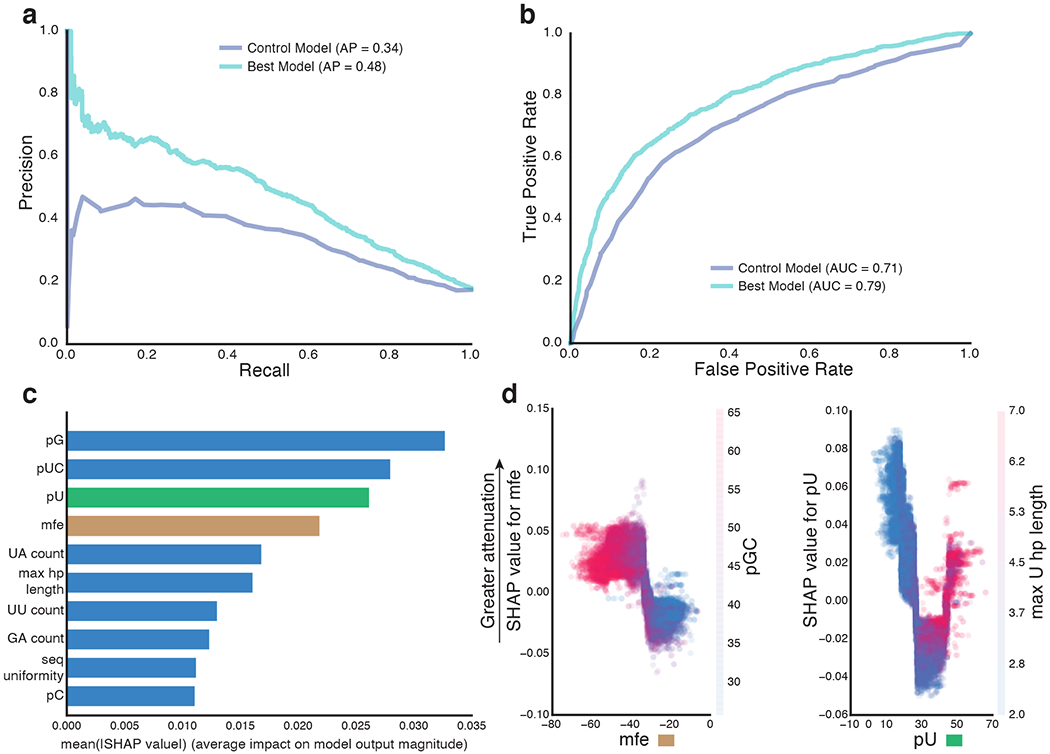
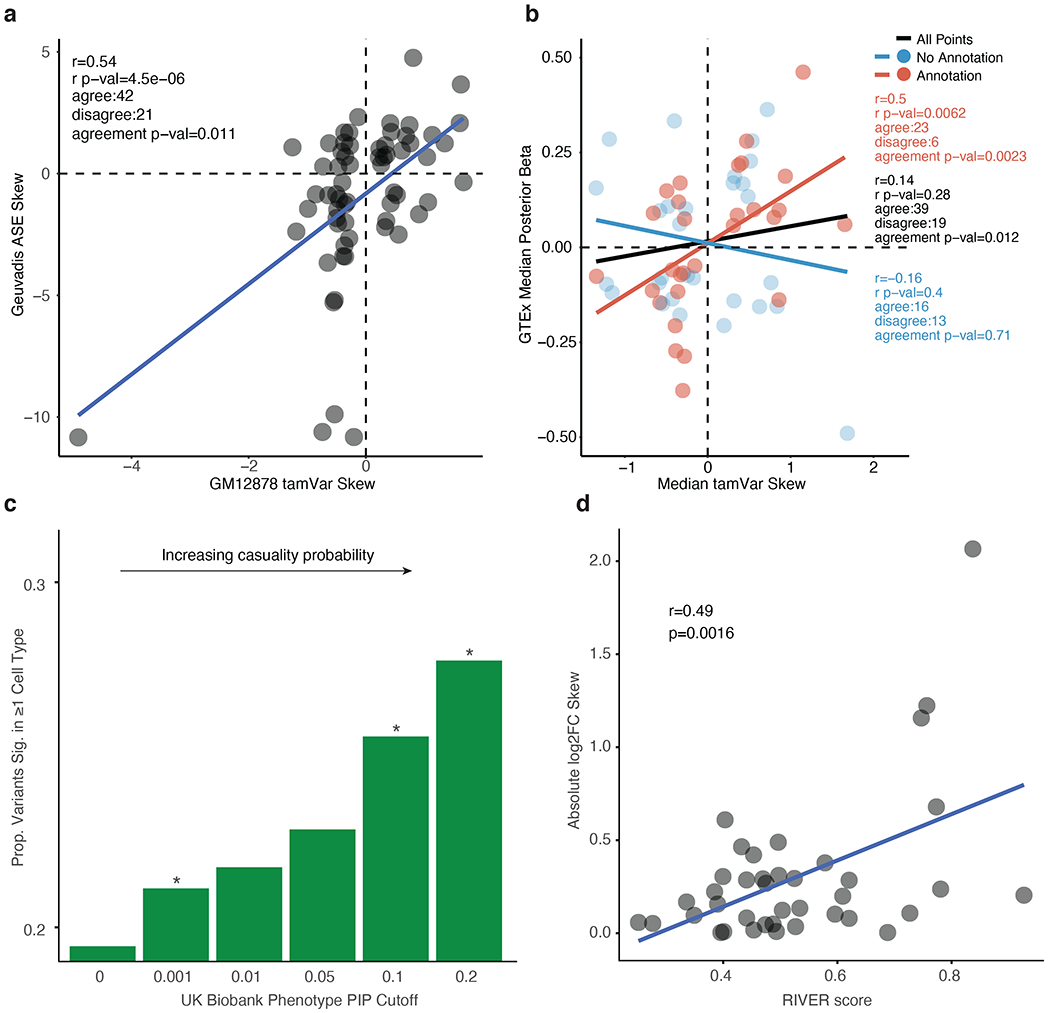
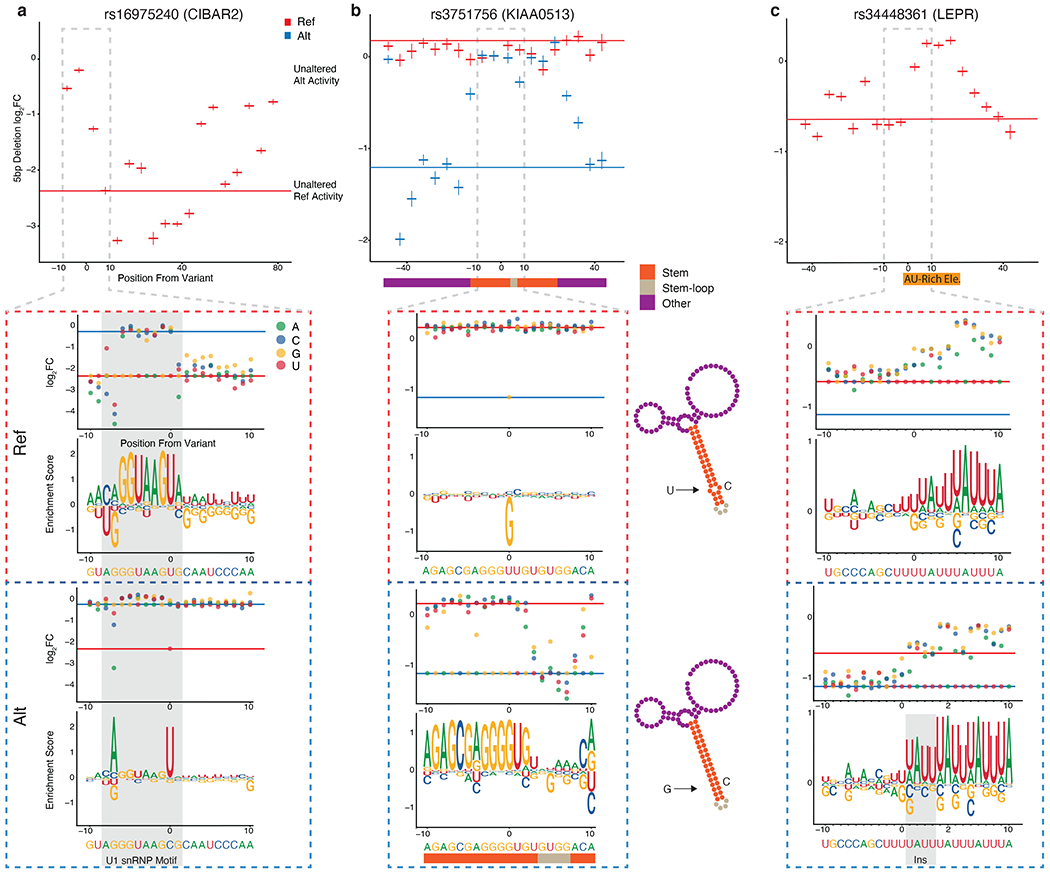
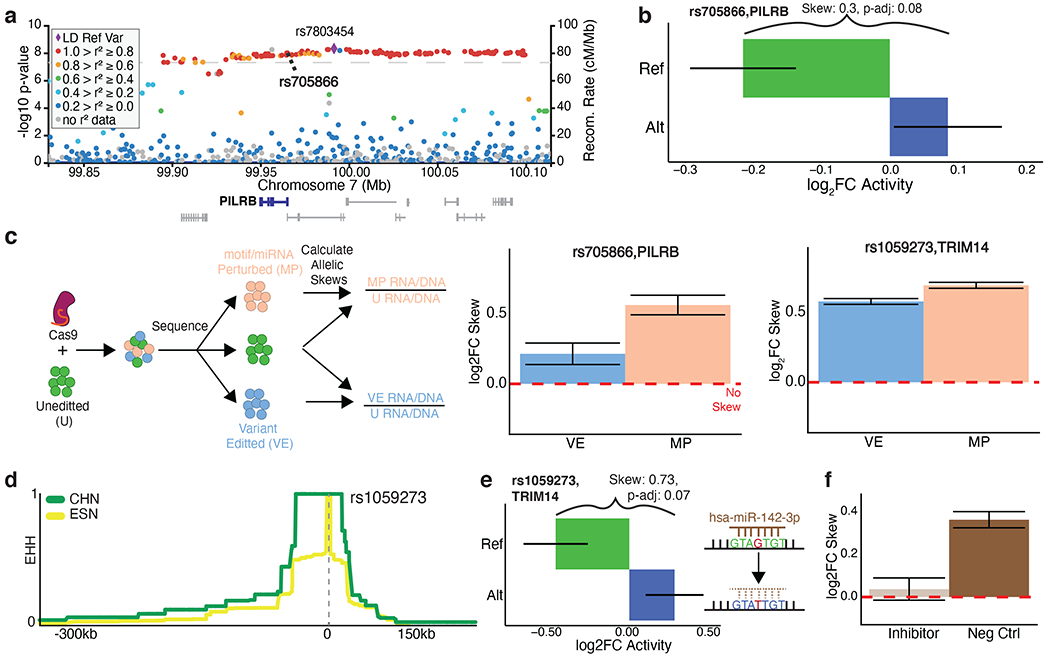
3' untranslated region (3'UTR) variants are strongly associated with human traits and diseases, yet few have been causally identified. We developed the massively parallel reporter assay for 3'UTRs (MPRAu) to sensitively assay 12,173 3'UTR variants. We applied MPRAu to six human cell lines, focusing on genetic variants associated with genome-wide association studies (GWAS) and human evolutionary adaptation. MPRAu expands our understanding of 3'UTR function, suggesting that simple sequences predominately explain 3'UTR regulatory activity. We adapt MPRAu to uncover diverse molecular mechanisms at base pair resolution, including an adenylate-uridylate (AU)-rich element of LEPR linked to potential metabolic evolutionary adaptations in East Asians. We nominate hundreds of 3'UTR causal variants with genetically fine-mapped phenotype associations. Using endogenous allelic replacements, we characterize one variant that disrupts a miRNA site regulating the viral defense gene TRIM14 and one that alters PILRB abundance, nominating a causal variant underlying transcriptional changes in age-related macular degeneration.

Keywords: 3'UTR; GWAS; MPRA; evolution; functional genomics; genetic variants; regulatory genomics.


Conflict of interest statement

Declaration of interests P.C.S. is a co-founder of and consultant to Sherlock Biosciences and Board Member of Danaher Corporation. She is a shareholder in both companies.

Figures

Figure 1:
Figure 1:. MPRAu reproducibly recapitulates known 3’UTR activity
a, Overview of MPRAu: (1) Synthesis of oligonucleotide 3’UTR elements with genomic variants. (2) Oligos are PCR-amplified and cloned into a vector 3’ of GFP and adjacent to a random hexamer barcode. (3) The vector pool is transfected into cells, (4) GFP mRNA is extracted and sequenced. mRNA sequencing counts (4) are compared to plasmid counts (2) to determine the relative expression of ref and alt alleles. b, Scatterplot of normalized RNA versus DNA counts in HEK293 cells. Most oligos with significant activity are observed having attenuating effects. c, Heatmap of the pairwise correlation of RNA counts across all replicates. d, Identification of tamVars (red), variants with significantly different alt versus ref activity (data for HEK293 plotted). e, mash adjusted log2FC allelic skews for all variants with significant effects in at least one cell type (rows) across all tested cell types. f, Barplot depicting tamVar sharing across one to all six cell types. g, tamVar allelic skews concordance with low-throughput luciferase assays. Pearson’s r and its statistical significance are displayed.
Figure 2:
Figure 2:. Functional 3’UTR elements overlap known 3’UTR annotations
a, Scatterplot comparing correlations between activity effects and 3’UTR structure (more negative minimum free energy, left) and percent GC (right). HMEC log2FC activity data is representative and plotted. Pearson’s r and its statistical significance are displayed. b, (top panel) Enrichment of significantly active 3’UTRs with known 3’UTR attenuating (AU-rich, Pumillo, and miRNA) and augmenting (CU-rich Element) annotations. Average log2FC of 3’UTR activity in MPRAu across all cell types with specified annotation plotted, significance denoted as *** p-value<0.001, ** p-value<0.01, * p-value<0.05, using a two-sided Wilcoxon rank-sum test. (bottom panel) Barplot of the allelic skews for variants that acquire 3’UTR annotations of the class listed above. c, Variants with high allelic skew (| log2FC Skew |≥1 ) have greater in-vivo eCLIP RBP binding scores than variants with a lesser allelic skew (* p-value<0.05, using a one-sided Wilcoxon rank-sum test). d, Each box in the heatmap measures the significance of attenuation (t-test) when cell-type-specific MPRAu-measured 3’UTR activity (y-axis) is subsetted on the top 10 most abundant miRNAs across the cell types tested (x-axis). Across 4 cell types (K562, HMEC, GM12878, SK-N-SH), 3’UTR activity was most significantly attenuated when subsetting on cell-type matched miRNAs.
Figure 3:
Figure 3:. Computational modeling of 3’UTR activity uncovers features important for accurate prediction
Precision-recall (a) and receiver operating characteristic curve (b) for the best model (xgboost) trained on predicting 3’UTR activity attenuation (data displayed is for HMEC). The results from a control model (one-variable decision tree model using percent U) are also plotted for comparison. c, Plot of the top 10 most important predictor variables of model performance, ranked by mean (| SHAP value |). d, SHAP values of minimal free energy (mfe, left) and percent U (pU, right) compared to that variable’s magnitude. Greater SHAP values indicate higher impact on model prediction towards attenuation. The magnitude of related variables, percent GC (pGC, left) and max U homopolymer (hp) length (right), are depicted by the color scale. mfe displays a monotonic effect on attenuation (left), with high pGC associated with attenuation and low mfe (blue). pU displays a nonlinear effect on attenuation (right), with attenuation especially observed in sequences with long homopolymer Us (red).
Figure 4:
Figure 4:. tamVars are responsible for gene expression and phenotype changes
a, GM12878 tamVar allelic skew correlated with cell-type matched Geuvadis allelic skew. b, Correlation between all-tissue median eQTL allelic skew (posterior beta) in GTEx that have a high probability of being causal via genetic fine-mapping (PIP>0.2) and strong tamVar (BH p-adj<0.05) median skew across all cell types. PIP is an estimate for the probability of a variant to casually affect a gene expression change (measured from GTEx) or a phenotypic trait collected from the UK Biobank. c, GWAS variants from the UK Biobank with increasing PIP cutoffs display increasing enrichment (* p-value<0.05, Fisher’s exact test) for variants significant via MPRAu in at least one tested cell type. d, tamVar allelic skew correlation with RIVER score, a functionality estimate for rare variants (data for HMEC is representative and shown). Pearson’s r and its statistical significance are displayed.
Figure 5:
Figure 5:. MPRAu uncovers functional sequence architectures via SNV and deletion tiling
For a-c, Top, 5 bp deletion tiling of the targeted variant using the ref (red) or alt (blue) sequence context across 100 bp. Bottom, SNV tiling +/− 10 bp around each variant showing log2 fold change and motif enrichment score in both variant contexts. HEK293 3’UTR activity data is plotted for all panels. a, Plots for tiling at rs16975420 (CIBAR2), including the sequence motif for U1 snRNP (gray shading). b, Plots for tiling at rs3751756 (KIAA0513), overlaid with a predicted structure of the RNA element (bottom middle). Large magnitude changes observed in SNV tiling are predicted to disrupt bases in the stem structure. c, Plots for tiling at rs34448361 (LEPR) with an AU-rich element denoted.
Figure 6:
Figure 6:. rs705866 and rs1059273 are endogenously validated tamVars impacting human disease and adaptation phenotypes
a, Age-related macular degeneration GWAS association plot surrounding the tag SNP rs7803454 with rs705866 (MPRAu tested SNP) in bold. b, MPRAu allelic results for rs705866. c, Schematic of the HDR experimental pipeline (left). Allelic skews estimated from HDR for rs705866 (center), and rs1059273 (right) exhibit the same directionality as the MPRAu results. d, EHH score surrounding rs1059273 suggests evolutionary selection in Han Chinese (CHN). For comparison, EHH scores for Esan in Nigeria (ESN) are also shown. e, MPRAu shows significant attenuating activity in the allelic background (ref) with the unperturbed miRNA binding site for rs1059273. f, Allelic skew result after transfection of a miRNA inhibitor for hsa-miR-142-3p versus a negative control miRNA inhibitor.

References

    1. 1000 Genomes Project Consortium, Auton A, Brooks LD, Durbin RM, Garrison EP, Kang HM, Korbel JO, Marchini JL, McCarthy S, McVean GA, et al. (2015). A global reference for human genetic variation. Nature 526, 68–74. - PMC - PubMed
    1. Abella V, Scotece M, Conde J, Pino J, Gonzalez-Gay MA, Gómez-Reino JJ, Mera A, Lago F, Gómez R, and Gualillo O (2017). Leptin in the interplay of inflammation, metabolism and immune system disorders. Nat. Rev. Rheumatol 13, 100–109. - PubMed
    1. Andreassi C, and Riccio A (2009). To localize or not to localize: mRNA fate is in 3’UTR ends. Trends Cell Biol. 19, 465–474. - PubMed
    1. van Arensbergen J, Pagie L, FitzPatrick VD, de Haas M, Baltissen MP, Comoglio F, van der Weide RH, Teunissen H, Võsa U, Franke L, et al. (2019). High-throughput identification of human SNPs affecting regulatory element activity. Nat. Genet 51, 1160–1169. - PMC - PubMed
    1. Bakheet T, Frevel M, Williams BR, Greer W, and Khabar KS (2001). ARED: human AU-rich element-containing mRNA database reveals an unexpectedly diverse functional repertoire of encoded proteins. Nucleic Acids Res. 29, 246–254. - PMC - PubMed

Publication types