. 2021 Sep 30;184(20):5122-5137.e17.
doi: 10.1016/j.cell.2021.08.024. Epub 2021 Sep 16.

Natural sensory context drives diverse brain-wide activity during C. elegans mating

Affiliations

Natural sensory context drives diverse brain-wide activity during C. elegans mating

Vladislav Susoy et al. Cell. .

Abstract

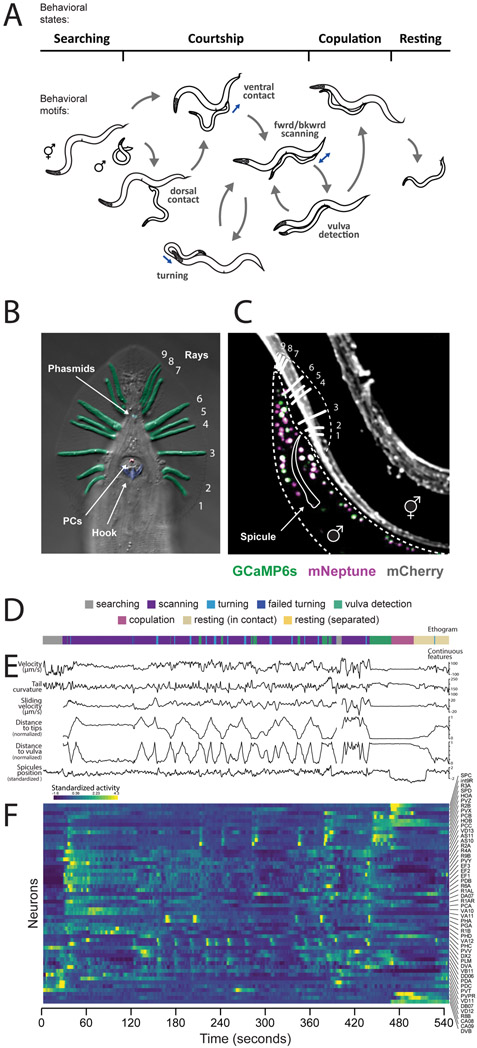
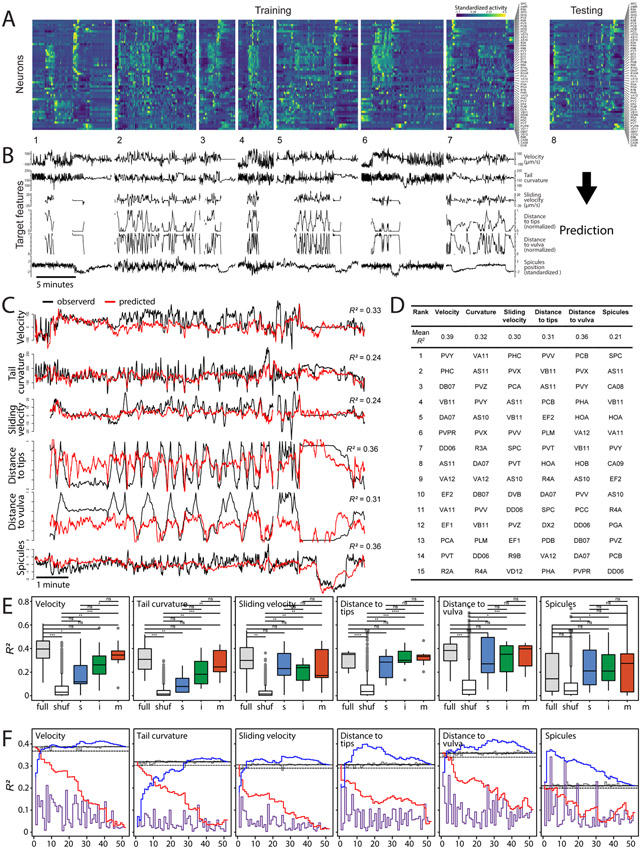
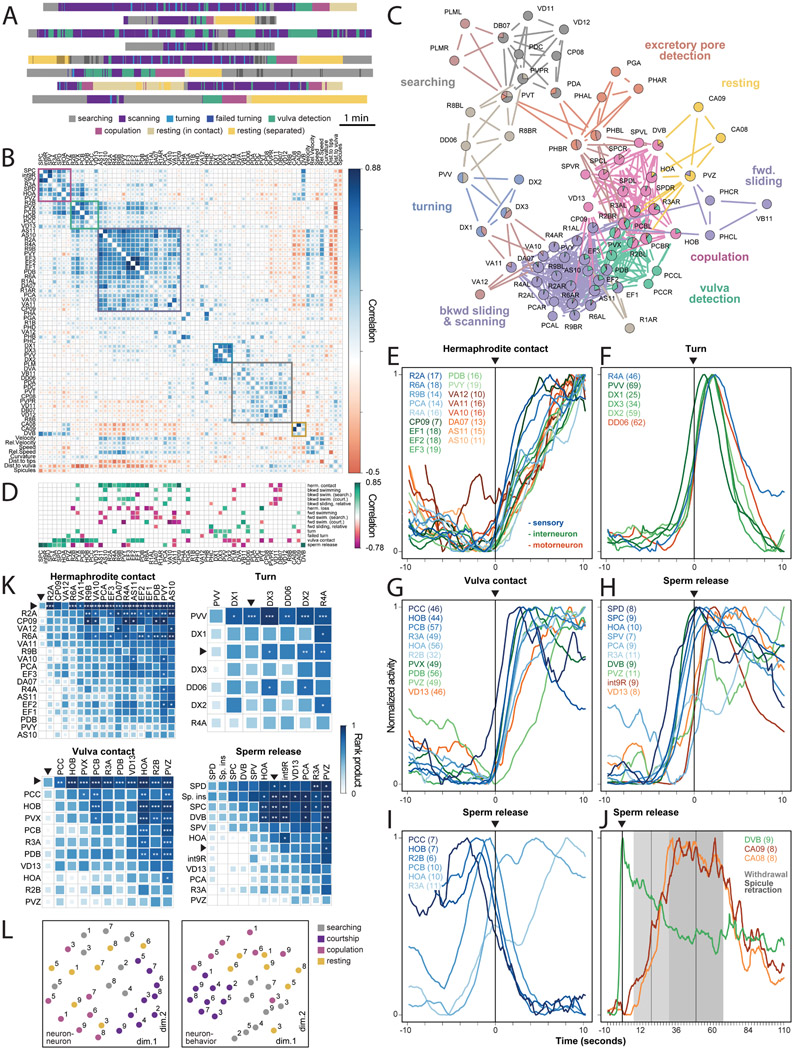
Natural goal-directed behaviors often involve complex sequences of many stimulus-triggered components. Understanding how brain circuits organize such behaviors requires mapping the interactions between an animal, its environment, and its nervous system. Here, we use brain-wide neuronal imaging to study the full performance of mating by the C. elegans male. We show that as mating unfolds in a sequence of component behaviors, the brain operates similarly between instances of each component but distinctly between different components. When the full sensory and behavioral context is taken into account, unique roles emerge for each neuron. Functional correlations between neurons are not fixed but change with behavioral dynamics. From individual neurons to circuits, our study shows how diverse brain-wide dynamics emerge from the integration of sensory perception and motor actions in their natural context.

Keywords: C. elegans; complex behavior; mating; neuroethology; systems neuroscience; whole brain imaging.


Conflict of interest statement

Declaration of interests The authors declare no competing interests.

Figures

Figure 1.
Figure 1.. Mating in the male C. elegans is a multi-step behavior.
(A) The male switches between behavioral motifs using inputs from tail sensory organs including 9 pairs of sensory rays (pseudo-colored green) with two neurons each, the hook (blue) with two sensory neurons, two postcloacal sensilla (pink) with three neuron pairs, and two phasmids (aqua) with three neuron pairs (B). (C) A tracking microscope simultaneously recorded male behavior and neuron activity a nuclear-localized calcium indicator (GCaMP6s) and a red fluorescent marker (mNeptune). Fluorescent hermaphrodites were used to track behavior. (D) An ethogram showing a behavioral trajectory for a single mating. (E) Continuous behavioral features were extracted from animal movements. (F) The activity of all visible neurons in the tail was continuously recorded. Most neurons could be identified. See also Video S1, Figure S1, Table S1 and S2.
Figure 2.
Figure 2.. Continuous behavioral features can be decoded from neuronal activity across animals.
(A) Concatenated activity traces of 52 neurons were used to train sparse linear models to predict continuous behavioral features (B). (C) These models were able to predict male velocity, tail curvature, and male tail distance to the hermaphrodite tips and vulva. Observed and predicted behavioral features for one of eight datasets are shown. (D) Prediction accuracy (mean R2) for eight training-testing iterations. Individual neurons ranked based on their importance for predicting specific behavioral features. Top 15 neurons are shown. (E) Prediction accuracy for models built and tested on all neurons (’full’), using shuffled ids in the testing set (‘shuf’), and models built and tested using activities of sensory ‘s’, inter- ‘i’, and motor neurons ‘m’. *p<0.05, **p<0.01, ***p<0.001, ns – not significant. (F) Prediction accuracy (mean R2) for models built using activities of single neurons (ordered by their rank as in D) (purple), models built using traces of all except one neuron (gray), models built by sequentially adding neurons in the order of rank (blue), and models built by sequentially removing neurons in the order of rank (red). Solid and dashed gray lines show 100% and 95% of the full model performance respectively. See also Tables S3 and S4 and Extended Data S1.
Figure 3.
Figure 3.. Functional organization of the mating circuit.
(A) Each male exhibited unique behavioral dynamics represented by distinct ethograms. (B) Matrix of pairwise correlations for 57 neuron types and 8 continuous behavioral features generated from the recordings of 22 males. Hierarchical clustering reveals groups of neurons with similar activities and associated with specific behavioral motifs. (C) A network of functional correlations between neurons. Several neurons belong to multiple partly overlapping functional communities, shown with different colors. (D) Many neurons consistently increase (green) or decrease (magenta) their activity at the onset of discrete behavioral motifs such as turning or stopping at the vulva. All traces are scaled to have a minimum value of 0 and a maximum of 1. Neurons with significant activity changes are shown (FDR-corrected p-values < 0.05). (E to J) Activities of selected neurons from all males aligned to the onset of hermaphrodite contact, turning, vulva contact, and sperm release. The number of events recorded for each neuron are in parenthesis. Colors indicate sensory, inter-, and motor neurons. (I) At the onset of copulation, vulva-tuned sensory neurons PCC, HOB, R2B, and PCB decrease their activity, although contact with the vulva remains. (J) Inter/motor neurons CA8, CA9, and DVB are active after copulation and during resting. Withdrawal from the vulva and spicule retraction events ± SD are shown. (K) Event-triggered sequences. Pairwise rank products (shown with color) indicate the number of times the half-peak of a row neuron (or an event) is before that of a column neuron (or event). Asterisks show the chance probability of the same rank product. *p<0.05, **p<0.01, ***p<0.001. Neurons are ordered by their median half-peak time. Arrows indicate the corresponding events. ‘sp. ins’ – spicule insertion. (L) Unsupervised arrangement of neuron-neuron and neuron-behavior correlation patterns for each animal and behavioral state using multidimensional scaling. The correlations are more strongly grouped by behavioral state (distinguished by color) than by animal (distinguished by the dataset number). See also Table S5 and Figures S2-S5 and Extended Data S1.
Figure 4.
Figure 4.. Mapping functional and synaptic connectivity.
(A) Most functionally-linked neurons are not directly connected by synapses. Direct synapses, particularly electrical synapses, are more likely to occur between neurons that are more strongly functionally-linked. Functional weight as a function of the number of electrical (B) and chemical (C) synapses between neurons. Solid circles indicate imputed correlations between the left-right neuron pairs. Orange solid lines and black dashed lines indicate observed Pearson and partial correlations respectively and the histograms show the distribution of correlation coefficients when the functional weights are shuffled. (D) Overlapping communities of functionally-linked neurons extracted with link clustering. Three different partitioning schemes are shown. (E) Community interaction motifs for ten different partitioning schemes. Assortative, disassortative, and core-periphery community interactions involving electrical and chemical synaptic networks are shown. See also Table S6 and Extended Data S1.
Figure 5.
Figure 5.. Circuit dissection of stimulus-triggered behavioral motifs.
(A) The male adjusts his tail posture to keep contact with the hermaphrodite using motif-specific circuits (B). Neurons involved in PVV-mediated turning and PDB-mediated curvature control are shown in blue and orange respectively. (C) PVV becomes active when the tail flexes to turn around the ends of the hermaphrodite. PVV activities from eight males relative to tail position on the hermaphrodite reveal high specificity of PVV activation. Mean activity is shown in blue. (D) PVV ablation compromises turning. (E) PDB-ablated males show less dorsal curvature when in contact with the hermaphrodite, particularly at the vulva. (F) Correlation coefficients between curvature and neuronal activity for control and PDB-ablated males. (G) Chemosensory PHA activates when the tail is near the hermaphrodite excretory pore. (H) Control males discriminate between the ventral and dorsal sides of the vulvaless hermaphrodites and pause near the excretory pore. ceh-14 mutants do not pause at the excretory pore. (I) The ray sensory neuron R2B is activated upon vulva contact. (J) Males in which R2B is ablated often lose contact with the vulva. *p<0.05, **p<0.01, ***p<0.001, ns – not significant. See also Extended Data S1.
Figure 6.
Figure 6.. Signal amplification and inhibition within and across circuits control switching between behavioral motifs.
(A) Vulva detection involves a circuit that is recurrently connected by electrical and chemical synapses. (B) In control males, PCB, PCC, HOA, HOB, R2B, and PVX become active when the tail is at the vulva. (C) Ablation of HOA leads to spurious activation of neurons involved in vulva detection. Repeated bursts of activation of the vulva-detecting circuit coincide with the spicule insertion attempts away from the vulva compromising scanning and reaching the vulva. (D) Ablation of PCA leads to spurious activation of the vulva-tuned neurons, but less frequently than in HOA-ablated males. (E to G) Double ablations of HOA and PCB and PCC but not HOB attenuate the HOA ablation phenotype and revert scanning and vulva detecting behavior to nearly normal. See also Figure S6 and Extended Data S1.
Figure 7.
Figure 7.. Conceptual diagram of stimulus-triggered information flow in the posterior brain.
Distinct sensory patterns from the hermaphrodite at different steps of mating are used by the male to execute different motor actions and behavioral motifs. Stimulus patterns from the hermaphrodite act on diverse and specialized sensory neurons. Sensory perception requires multisensory integration in the brain that is carried out by direct interactions between sensory neurons and by downstream circuits. Multiple circuits use overlapping sets of interneurons to affect the movement decision. Circuits for motif-specific posture control use a common set of motor neurons and muscles. Circuits for different motifs interact with one another to control behavioral transitions. Sensory feedback is used to keep track of behavior, enabling error correction and the proper sequence of behavioral motifs. The diagram illustrates known and hypothetical positive, negative, and context-dependent interactions. Dashed lines indicate hypothetical interactions with undetermined synaptic mechanisms.

References

    1. Adai AT, Date SV, Wieland S, and Marcotte EM (2004). Lgl: creating a map of protein function with an algorithm for visualizing very large biological networks. Journal of molecular biology 340, 179–190. - PubMed
    1. Ahn YY, Bagrow JP, and Lehmann S (2010). Link communities reveal multiscale complexity in networks. nature 466, 761–764. - PubMed
    1. Aicher C, Jacobs AZ, and Clauset A (2015). Learning latent block structure in weighted networks. Journal of Complex Networks 3, 221–248.
    1. Benjamini Y, and Hochberg Y (1995). Controlling the false discovery rate: a practical and powerful approach to multiple testing. Journal of the Royal statistical society: series B (Methodological) 57, 289–300.
    1. Betzel RF, Bertolero MA, and Bassett DS (2018). Non-assortative community structure in resting and task-evoked functional brain networks. bioRxiv p. 355016.

Publication types