. 2021 Sep 15;109(18):2914-2927.e5.
doi: 10.1016/j.neuron.2021.08.030.

Signature morpho-electric, transcriptomic, and dendritic properties of human layer 5 neocortical pyramidal neurons

Affiliations

Signature morpho-electric, transcriptomic, and dendritic properties of human layer 5 neocortical pyramidal neurons

Brian E Kalmbach et al. Neuron. .

Abstract

In the neocortex, subcerebral axonal projections originate largely from layer 5 (L5) extratelencephalic-projecting (ET) neurons. The unique morpho-electric properties of these neurons have been mainly described in rodents, where retrograde tracers or transgenic lines can label them. Similar labeling strategies are infeasible in the human neocortex, rendering the translational relevance of findings in rodents unclear. We leveraged the recent discovery of a transcriptomically defined L5 ET neuron type to study the properties of human L5 ET neurons in neocortical brain slices derived from neurosurgeries. Patch-seq recordings, where transcriptome, physiology, and morphology were assayed from the same cell, revealed many conserved morpho-electric properties of human and rodent L5 ET neurons. Divergent properties were often subtler than differences between L5 cell types within these two species. These data suggest a conserved function of L5 ET neurons in the neocortical hierarchy but also highlight phenotypic divergence possibly related to functional specialization of human neocortex.

Keywords: cross-species; dendrite; dendritic spike; gene expression; human; intrinsic membrane properties; patch-clamp physiology; patch-seq; pyramidal neuron; transcriptomics.


Conflict of interest statement

Declaration of interests L.T.G., T.L.D., J.T.T., E.L., B.K., H.Z., and B.T. are inventors on a PCT application (PCT/US2019/059927) related to this work. All authors declare no other competing interests.

Figures

Figure 1-
Figure 1-. Cross species comparison of relative abundance and gene expression of L5 ET neurons.
A) Representative inverted images of DAPI-stained sections of human, macaque and mouse temporal cortex. Dots denote the location of cells labeled using mFISH for FAM84B and SLC17A7. Horizontal bars denote putative layer boundaries. B) Example mFISH images of FAM84B and SLC17A7 labeling in L5 pyramidal neurons in human, macaque and mouse temporal cortex. C) Quantification of the proportion of SLC17A7 + cells expressing the ET markers FAM84B or POU3F1 in temporal cortex of mouse, macaque and human expressed as a fraction of the total number of excitatory cells in L5. Individual data points are denoted by symbols. Line graphs of D) axon guidance and E) synaptic regulation related genes with expression enrichment in L5 ET versus IT neurons in human MTG (> 1 log2 fold-difference) and their respective enrichment in L5 ET neurons in mouse VISp and ALM. Notable conserved (red) and human specific (blue) genes are highlighted. Human L5 ET neuron enriched F) ion channel and G) Neuromodulator receptor gene expression and their expression in the mouse VISp and ALM.
Figure 2-
Figure 2-. Patch-seq analysis reveals distinctive membrane properties of transcriptomically defined L5 ET neurons.
A) We obtained whole cell patch clamp recordings from L5 pyramidal neurons in human brain slices prepared from neurosurgical specimens. For a subset of experiments, Patch-seq analysis was performed which permitted post-hoc assignment of a transcriptomic cell type to the physiologically probed neuron. Several physiological features were extracted from all recordings and these features were used to define electrophysiological types (e-types). B) Glutamatergic transcriptomic cell types in human MTG are shown, with the number of Patch-seq samples that mapped with high confidence to each type indicated by the bar plots. Transcriptomic cell type names are adapted from Hodge et al., 2019. C) Heat map of a subset of genes detected in Patch-seq samples. Each column is a separate Patch-seq sample. ET enriched genes are highly expressed in L5 ET transcriptomic types compared to L5 IT transcriptomic types. IT enriched genes are highly expressed in L5 IT transcriptomic types compared to L5 ET transcriptomic types. Columns are color coded for transcriptomic cell types at the bottom row. D) Heat map of physiological features of human L5 pyramidal neurons. These features were used to cluster cells into physiologically defined types (e-types) using Ward’s algorithm. The dendrogram represents the outcome of this clustering. tSNE projection of the features shown in D) color-coded by E) electrophysiologically-defined cell type and F) transcriptomically defined cell type.
Figure 3-
Figure 3-. Subthreshold membrane properties of L5 neuron types in human MTG.
A) Example voltage response of L5 neuron types to a chirp stimulus. B) ZAP (bottom) and normalized frequency response (top) constructed from the voltage responses in A). Dashed lines indicate resonant frequency (ZAP) and 3dB cutoff (normalized curve). Pairwise comparisons of C) resonant frequency and D) 3 dB cutoff. E) Example voltage responses to a series of hyperpolarizing and depolarizing current injections. Scale is the same for ET-like and IT-like 1 sweeps, but different for IT-like 2 sweeps. Pairwise comparisons of F) Input resistance and G) Sag ratio. H) Resonant frequency as a function of input resistance. For example sweeps, mapped transcriptomic cell type is listed in parentheses. For summary plots, triangles and circles denote Patch-seq samples and physiology only samples, respectively. Legend in H) applies to all summary plots. * p < .05, FDR corrected Mann-Whitney U test.
Figure 4-
Figure 4-. Suprathreshold membrane properties of L5 neuron types in human MTG.
A) Example voltage responses to near threshold current injection (middle) and +500 pA (bottom). (top)- Expanded view of spikes at near rheobase current injection. B) The number of action potentials evoked as a function of current injection amplitude. C) First instantaneous frequency plotted as a function of current injection amplitude above rheobase. D) (middle) The percentage of action potentials occurring within 50 ms of the first spike and (right) maximum instantaneous firing rate for the first current injection producing at least 5 spikes. The legend (left) applies to subsequent panels in this figure. E) Example action potentials (left) and corresponding phase-plane plots (right). Differences in F) action potential threshold, G) maximum dV/dt H) minimum dV/dt and I) action potential width at half-maximum amplitude. For example sweeps the mapped transcriptomic cell type is listed in parentheses. For box plots, triangles and circles denote Patch-seq samples and physiology only samples, respectively.* p < .05, FDR corrected Mann-Whitney U test. Full table of p values and effect size can be found in Tables S1,2.
Figure 5-
Figure 5-. Morphological features of L5 ET- and IT- like neurons in human MTG.
Dendritic reconstructions of A) ET-like and B) IT-like neurons in human MTG. Apical and basal dendrites are denoted by different shades of green or red. Neurons mapping to a transcriptomic cluster from Patch-seq experiments are denoted by an arrow. Approximate layer 4/5 and layer 5/6 boundaries are denoted by dashed lines. Comparison of C) basal and apical dendritic length, D) number of basal and apical dendritic branches, E) average dendrite diameter and F) total dendritic surface area between L5 ET and IT neurons. G) Example biocytin fills of perisomatic regions for L5 ET and IT-like neurons. Comparison of H) soma width I) height and J) initial apical shaft width. For box plots, triangles denote transcriptomically defined cell types (Exc L4–5 FEZF2 SCN4B for ET-like and Exc L4–5 RORB FOLH1B for IT-like). * p < 0.05, FDR corrected Mann-Whitney U test.
Figure 6-
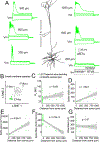
Figure 6-. Putative ET neurons display strong dendritic electrogenesis.
A) Direct electrical recordings of dendritic membrane properties were performed at various distances from the soma in separate neurons. For a subset of experiments, the soma was subsequently patched with a separate electrode. Example voltage responses to hyperpolarizing and depolarizing current injections are shown. Depolarizing current injections were capable of eliciting an all-or-none plateau potential. Example sweeps are from different neurons. B) tSNE projection of somatic membrane properties of cells in which the dendritic properties were probed are shaded in green. C) Input resistance, D) spike width, E) plateau potential area, F) maximum dV/dt and G) rheobase plotted as a function of distance from soma. Values near 0 reflect thin spikes similar to the example sweep at 200 um in A. FDR corrected Pearson’s correlation p values are listed for each plot. Shaded region corresponds to SEM. For D-H, green dots denote cells (n = 5) in which the somatic properties were also probed.
Figure 7-
Figure 7-. Cross-species comparison reveals conserved and divergent L5 ET neuron somatic membrane properties.
A) tSNE of intrinsic membrane properties for human and mouse L5 pyramidal neurons color coded by (left) physiologically-defined cell type and (right) transcriptomic cell type or labeling by an ET-enhancer virus. B) The top 10 largest effect sizes resulting from ANOVA with cell type (ET versus IT) and species (human versus mouse) as the factors. C) Physiological features plotted as a function of species and cell type for the five features with the largest effect sizes. For box plots, triangles denote neurons that mapped to a transcriptomic cell type during Patch seq experiments, or neurons labeled by an ET enhancer virus. Black bars denote p < 0.05, FDR corrected Mann-Whitney U test.

References

    1. Allman JM, Tetreault NA, Hakeem AY, Manaye KF, Semendeferi K, Erwin JM, Park S, Goubert V, and Hof PR (2010). The von Economo neurons in frontoinsular and anterior cingulate cortex in great apes and humans. Brain Struct. Funct 214, 495–517. - PubMed
    1. Anastasiades PG, Marlin JJ, and Carter AG (2018). Cell-Type Specificity of Callosally Evoked Excitation and Feedforward Inhibition in the Prefrontal Cortex. CellReports 22, 679–692. - PMC - PubMed
    1. Arlotta P, Molyneaux BJ, Chen J, Inoue J, Kominami R, and Macklis JD (2005). Neuronal Subtype-Specific Genes that Control Corticospinal Motor Neuron Development In Vivo. Neuron 45, 207–221. - PubMed
    1. Avesar D, and Gulledge AT (2012). Selective serotonergic excitation of callosal projection neurons. Front. Neural Circuits 6, 1–11. - PMC - PubMed
    1. Baker A, Kalmbach B, Morishima M, Kim J, Juavinett A, Li N, and Dembrow N (2018). Specialized Subpopulations of Deep-Layer Pyramidal Neurons in the Neocortex: Bridging Cellular Properties to Functional Consequences. J. Neurosci 118–150. - PMC - PubMed

Publication types