. 2021 Sep 16;184(19):4996-5014.e26.
doi: 10.1016/j.cell.2021.08.020.

Antigen dominance hierarchies shape TCF1+ progenitor CD8 T cell phenotypes in tumors

Affiliations

Antigen dominance hierarchies shape TCF1+ progenitor CD8 T cell phenotypes in tumors

Megan L Burger et al. Cell. .

Abstract

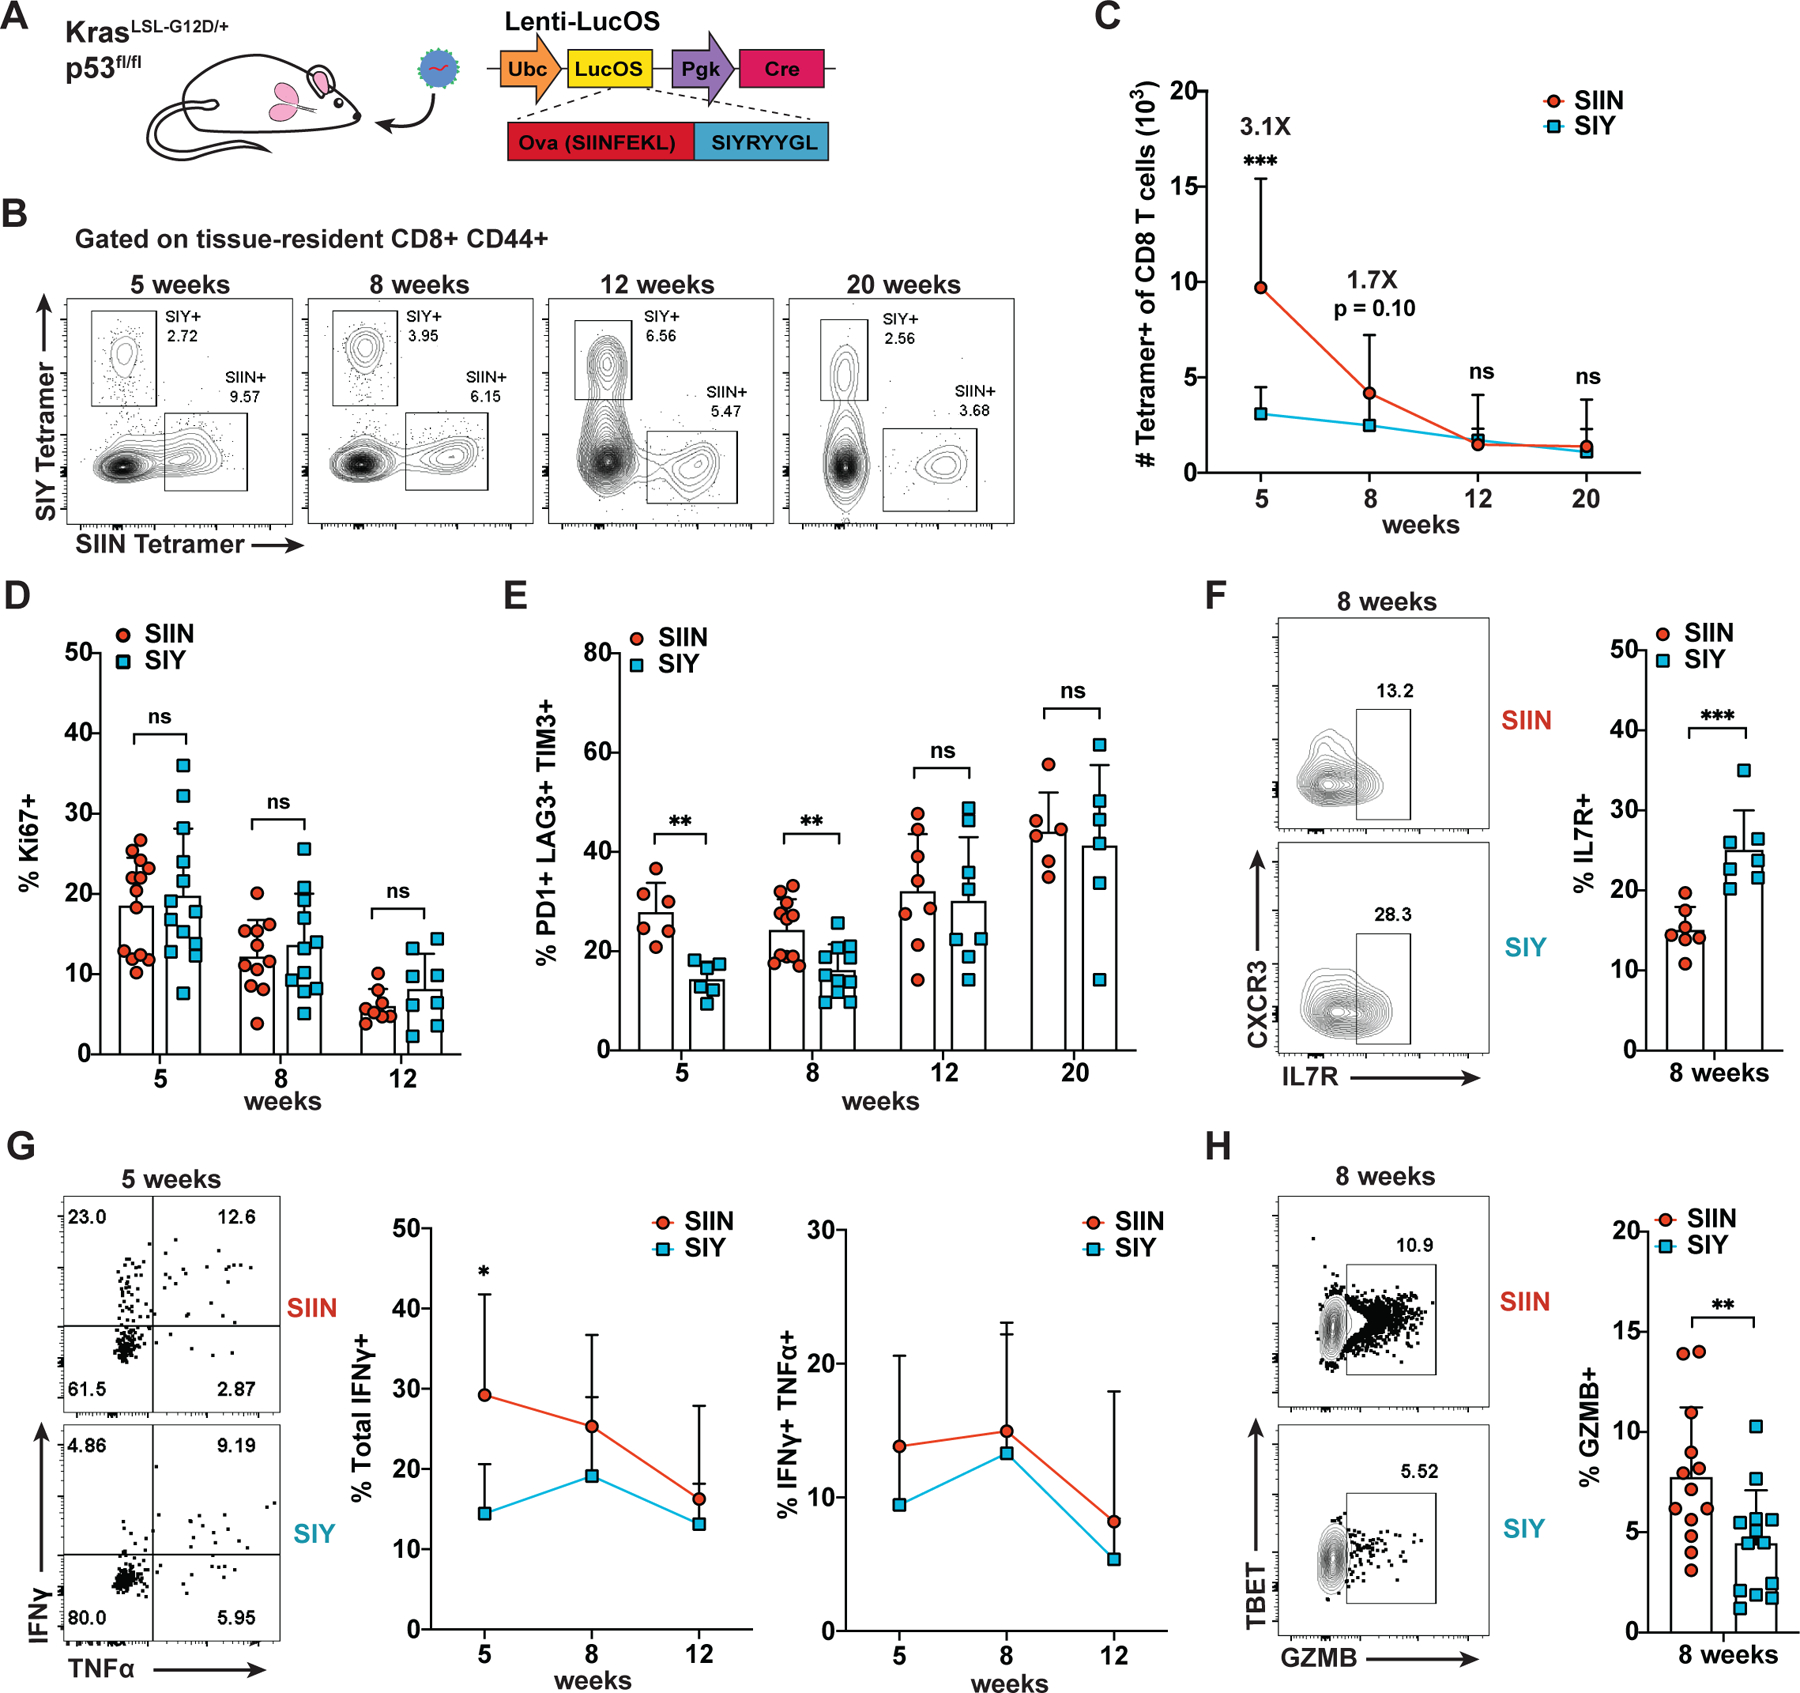
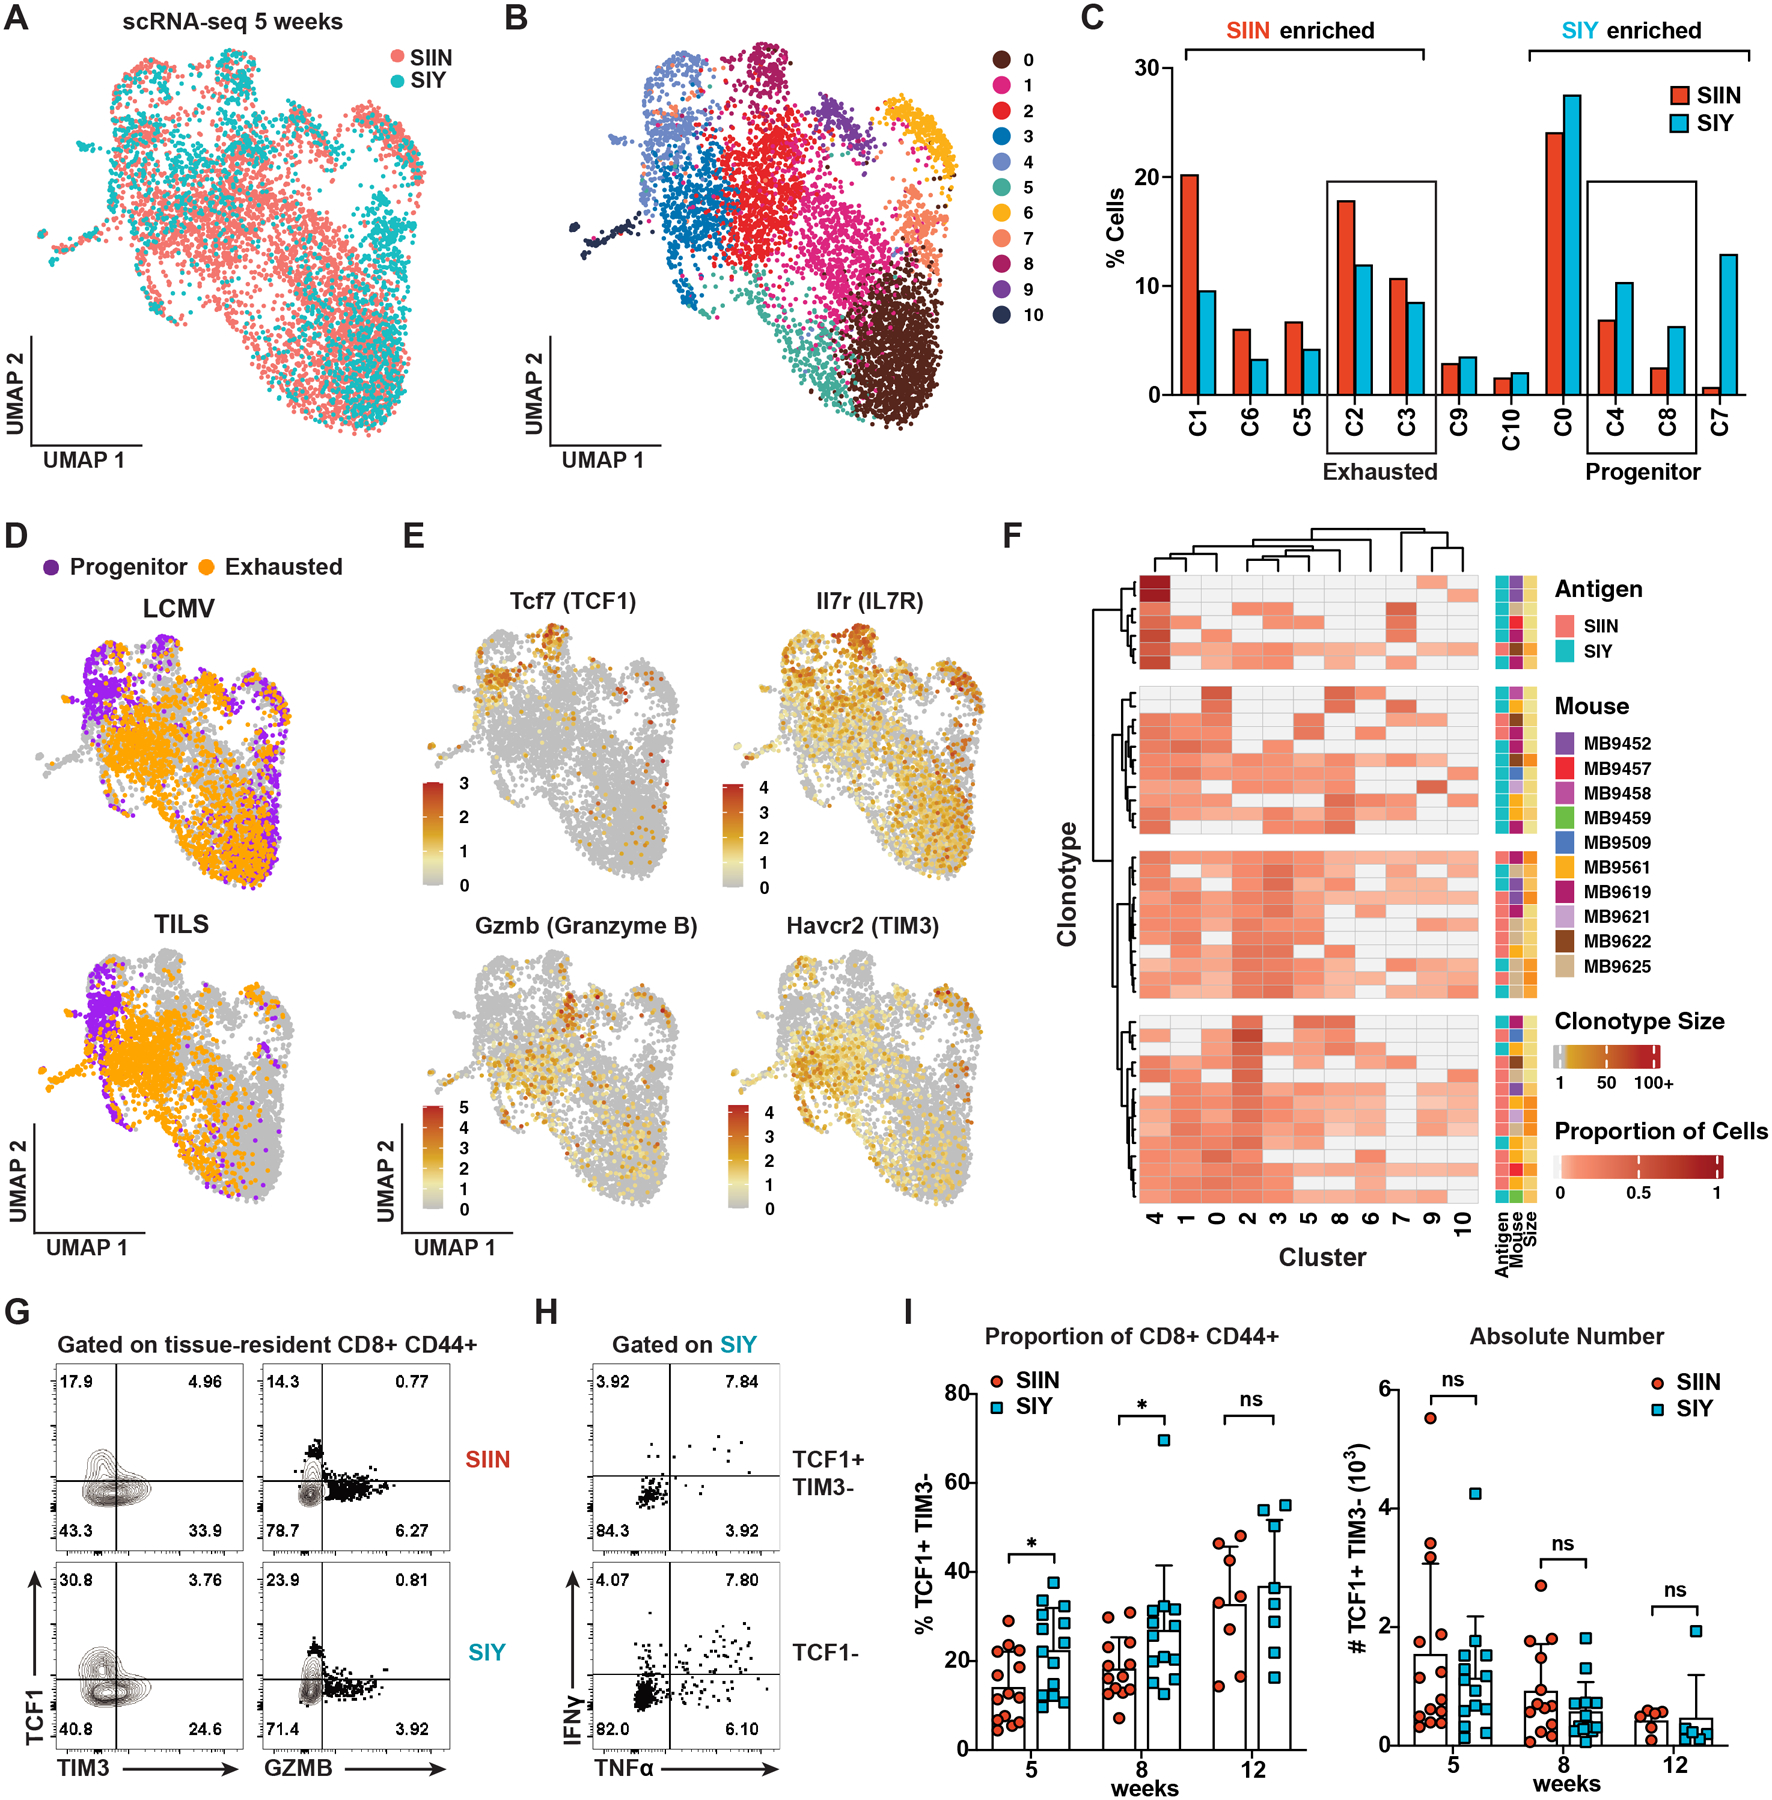
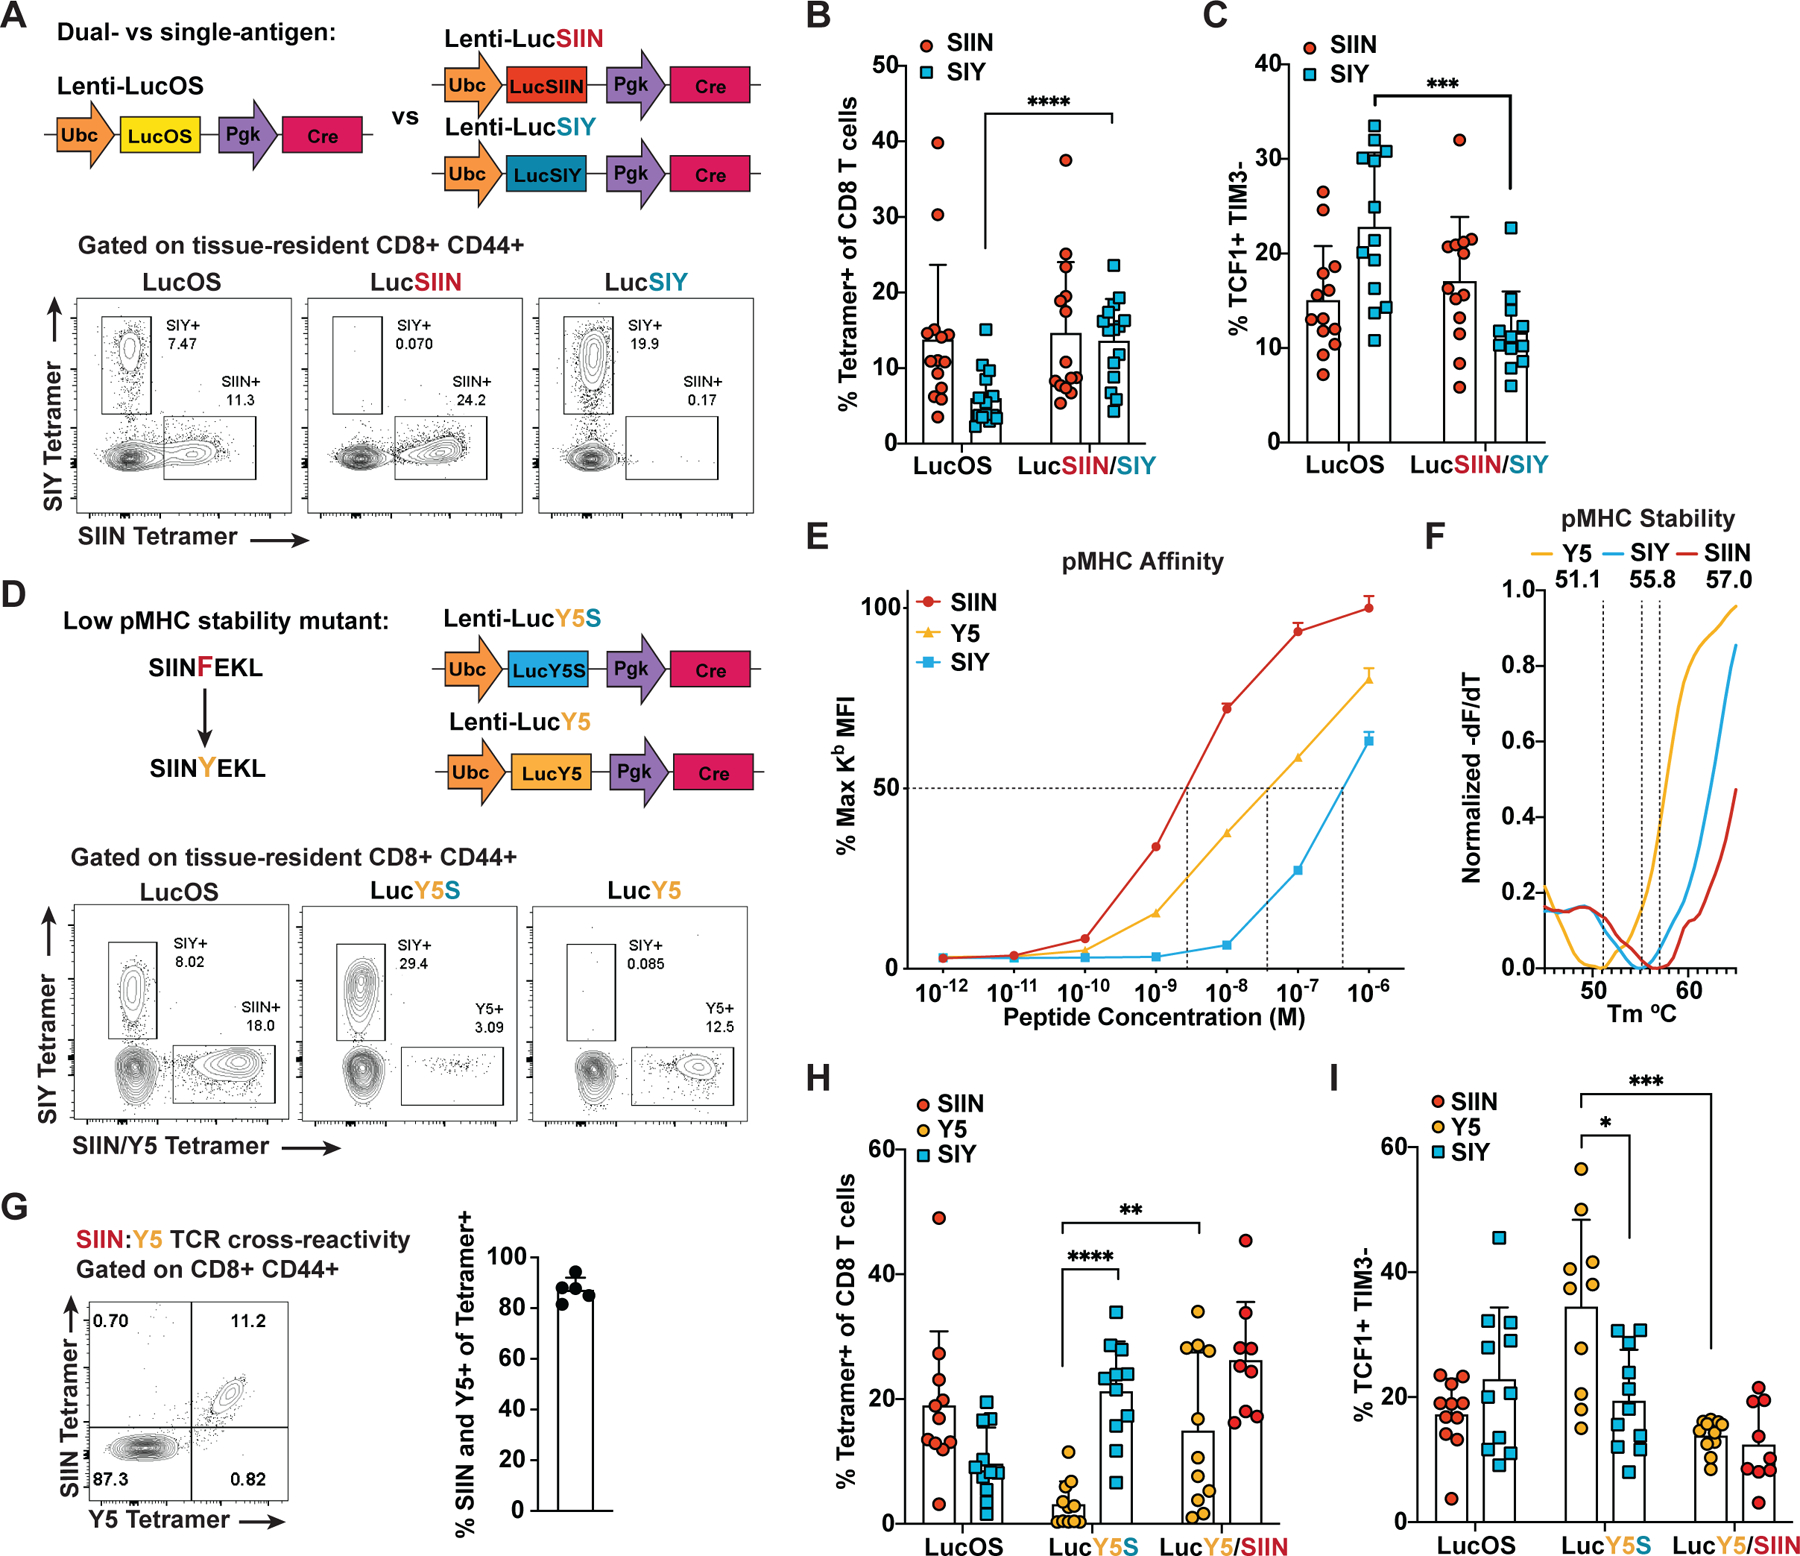
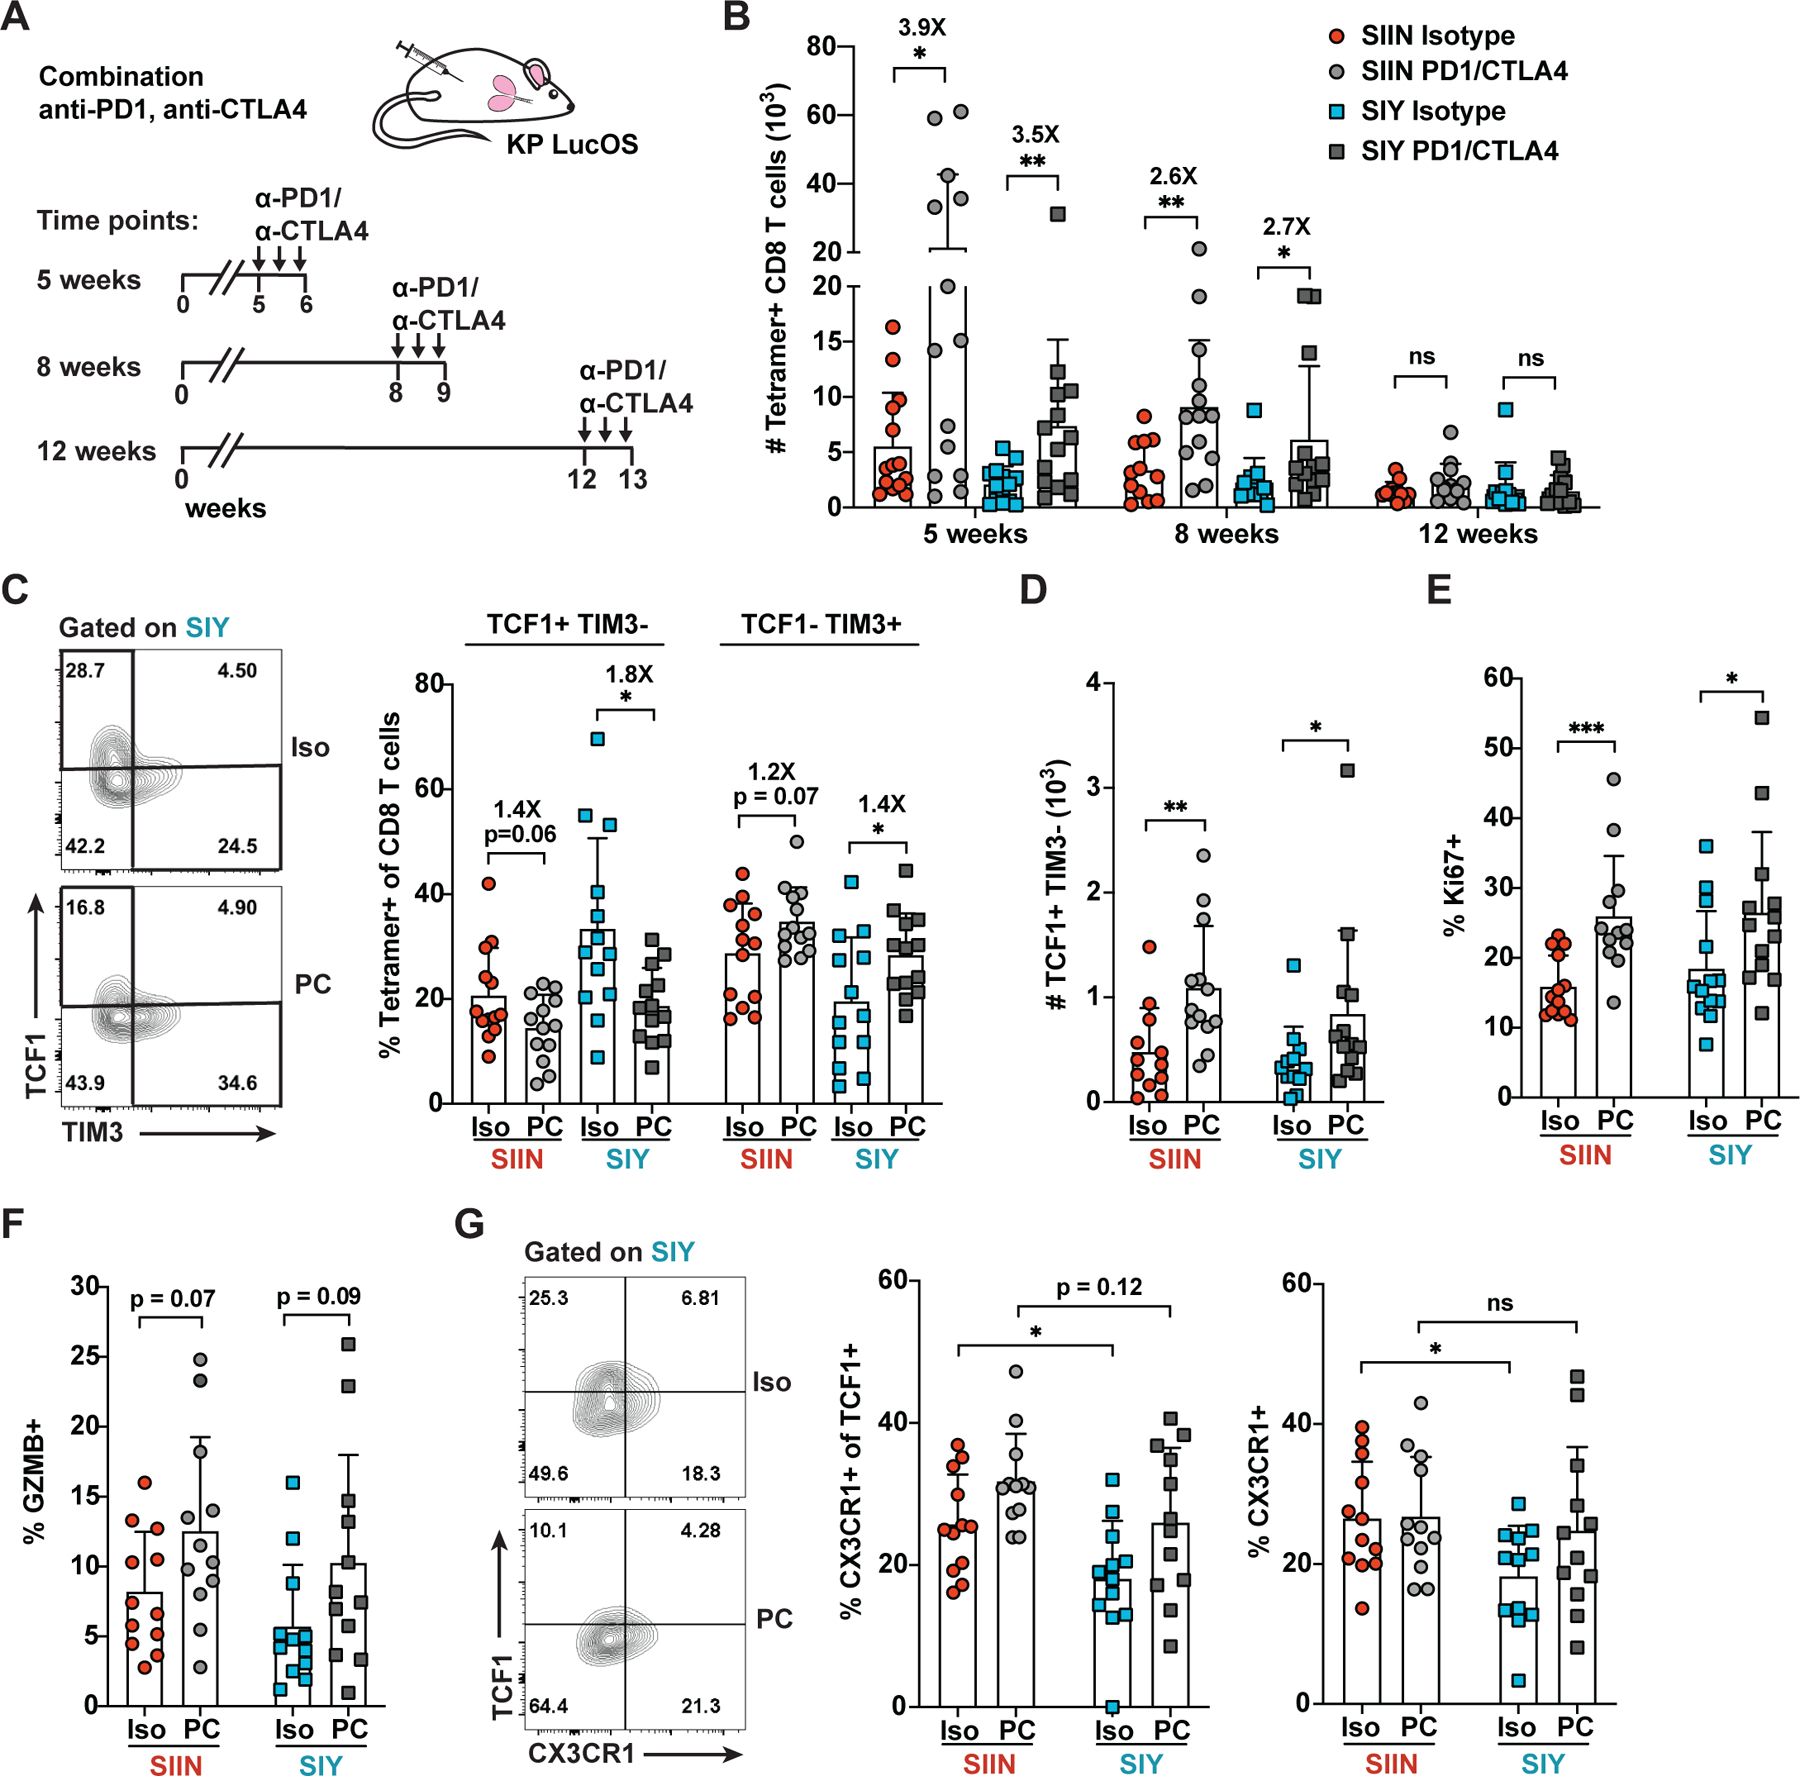
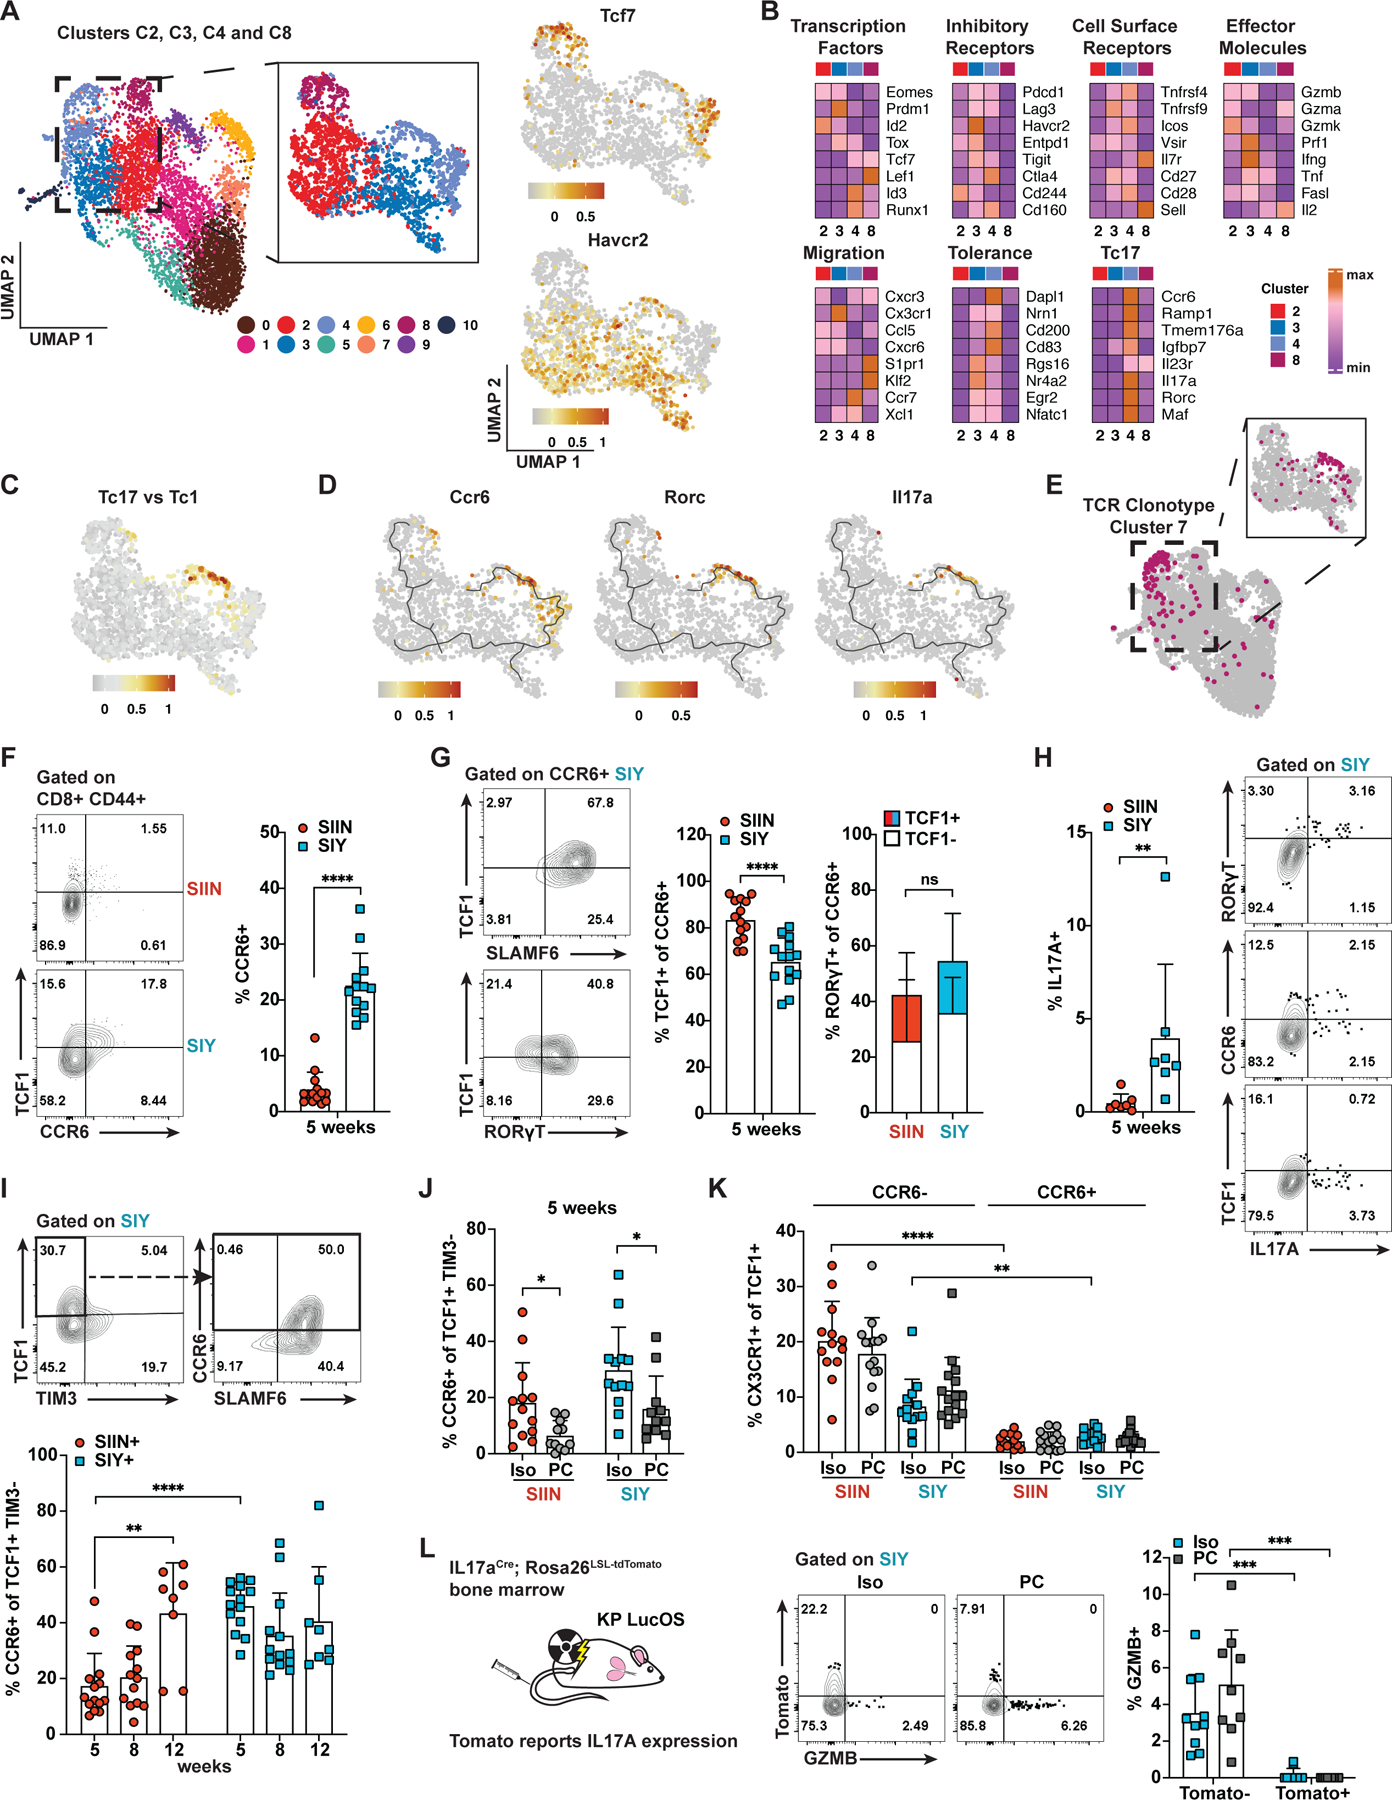
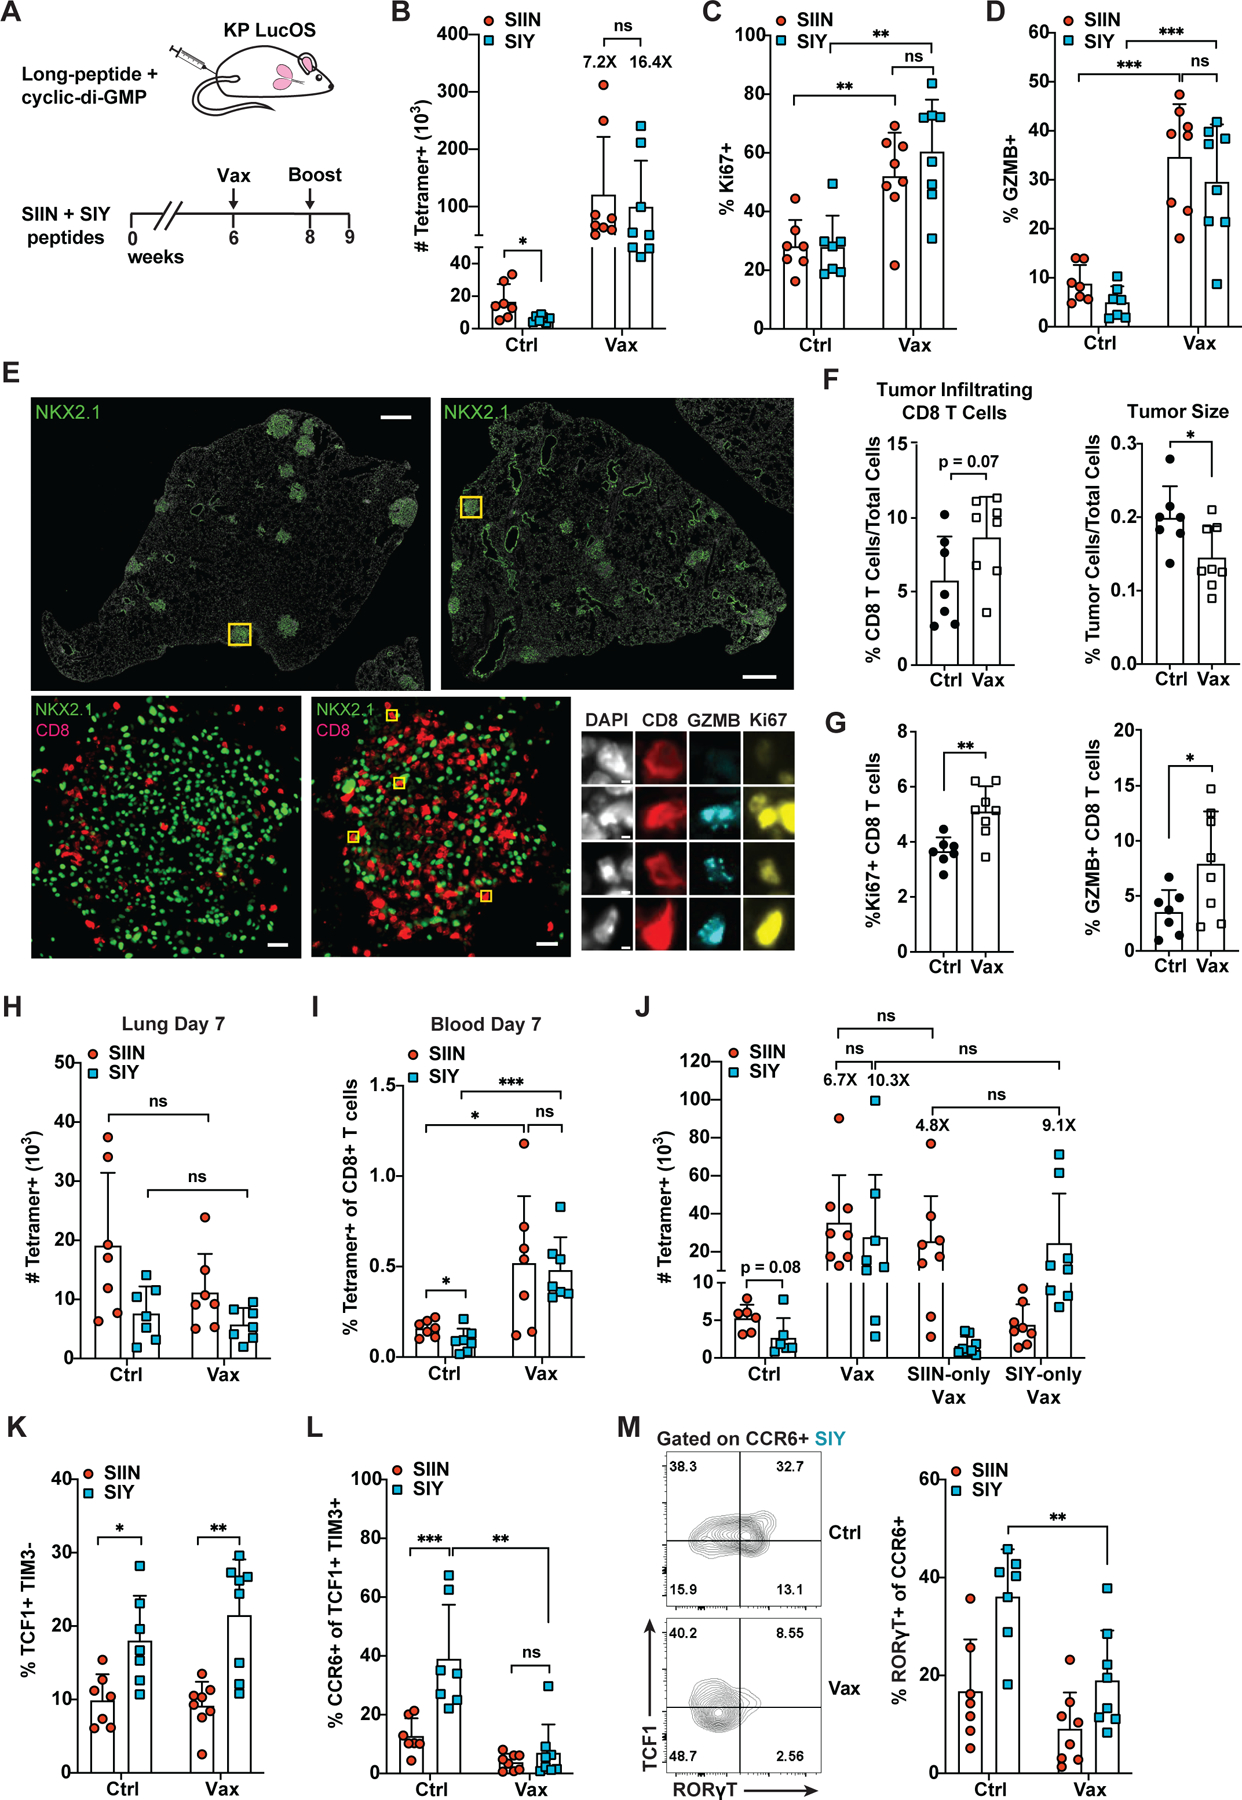
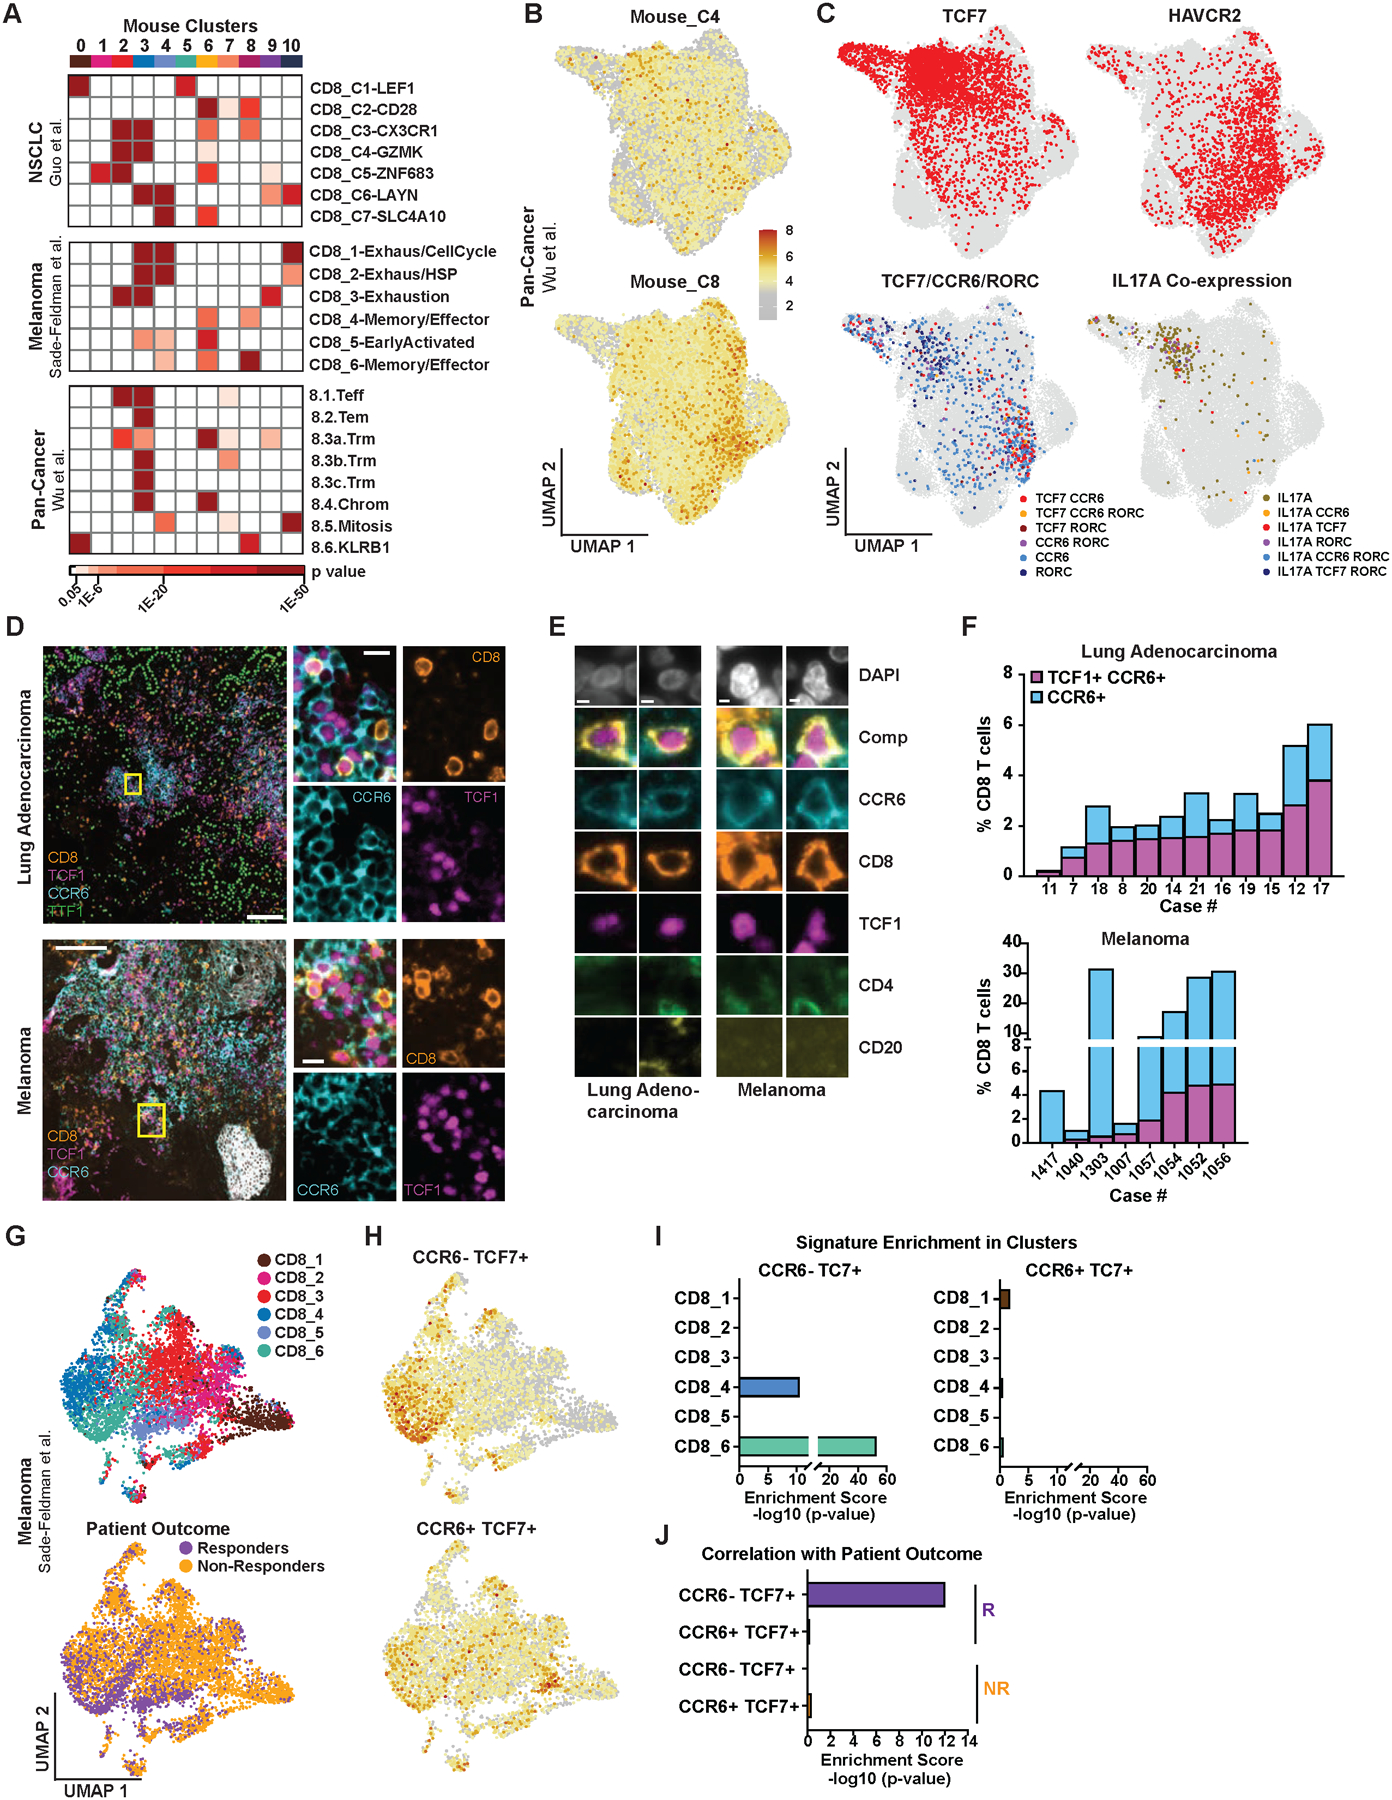
CD8 T cell responses against different tumor neoantigens occur simultaneously, yet little is known about the interplay between responses and its impact on T cell function and tumor control. In mouse lung adenocarcinoma, we found that immunodominance is established in tumors, wherein CD8 T cell expansion is predominantly driven by the antigen that most stably binds MHC. T cells responding to subdominant antigens were enriched for a TCF1+ progenitor phenotype correlated with response to immune checkpoint blockade (ICB) therapy. However, the subdominant T cell response did not preferentially benefit from ICB due to a dysfunctional subset of TCF1+ cells marked by CCR6 and Tc17 differentiation. Analysis of human samples and sequencing datasets revealed that CCR6+ TCF1+ cells exist across human cancers and are not correlated with ICB response. Vaccination eliminated CCR6+ TCF1+ cells and dramatically improved the subdominant response, highlighting a strategy to optimally engage concurrent neoantigen responses against tumors.

Keywords: CCR6; CD8 T cell; TCF1; Tc17; checkpoint blockade; immunodominance; lung cancer; neoantigen; vaccine.


Conflict of interest statement

Declaration of interests T.J. is on the board of directors of Amgen and ThermoFisher Scientific, a co-founder of Dragonfly Therapeutics and T2 Biosystems, an SAB member of Dragonfly Therapeutics, SQZ Biotech, and Skyhawk Therapeutics and is president of Break Through Cancer. The T.J. lab receives funding from the Johnson & Johnson Lung Cancer Initiative and The Lustgarten Foundation for Pancreatic Cancer Research, but this funding did not support this research. A.R. is a founder and equity holder of Celsius Therapeutics, an equity holder in Immunitas Therapeutics and until August 31, 2020, was an SAB member of Syros Pharmaceuticals, Neogene Therapeutics, Asimov, and ThermoFisher Scientific. A.R. is an employee of Genentech (Roche Group) from August 1, 2020. S.S. is a consultant for RareCyte, Inc. A.M.C. interned at Skyhawk Therapeutics. None of these affiliations represent a conflict of interest with respect to the design or execution of this study or interpretation of data presented in this manuscript.

Figures

Figure 1.
Figure 1.. Longitudinal Analysis Uncovers Heterogeneity Between CD8 T Cell Responses to Different Neoantigens in Lung Adenocarcinoma
(A) KP LucOS genetically engineered mouse model of lung adenocarcinoma expressing tumor-specific neoantigens SIINFEKL (SIIN) and SIYRYYGL (SIY). (B-C) Percentage (B) and absolute number (C) of SIIN- and SIY-specific CD8+ CD44+ T cells in tumor-bearing lung tissue by H-2Kb peptide-MHC tetramer staining and flow cytometry. (D-H) Percentage of SIIN- and SIY-specific CD8 T cells expressing Ki67 (D), PD1, LAG3 and TIM3 (E), IL7R (F), IFNɣ and TNFα (G) and GZMB (H) by flow cytometry. (B-H) are representative of ≥ 3 independent experiments per time point, n ≥ 5 mice per group. Results here and in the following figures are expressed as mean + SD. Statistics were calculated by two-tailed Student’s t test: ns = not significant, * p < 0.05, ** p < 0.01, *** p < 0.001.
Figure 2.
Figure 2.. Single-Cell RNA-Sequencing Reveals Enrichment of a TCF1+ Progenitor Cell Phenotype Amongst SIY-Specific CD8 T Cells
(A) UMAP embedding of scRNA-seq 5’ gene expression data comparing SIIN- and SIY-specific CD8 T cells at 5 weeks post-tumor initiation. n = 10 mice, 4,023 SIIN and 1,861 SIY cells. (B) Unsupervised clustering of the scRNA-seq data in (A). (C) Assignment of SIIN- versus SIY-specific cells to the clusters in (B). Brackets indicate significant enrichment (p < 0.05) for SIIN- or SIY-specific cells. (D) Classification of individual cells from (A) using the ProjecTILs pipeline (Andreatta et al., 2021). SIY-specific cells are enriched for a progenitor phenotype (TIL p = 0.002; LCMV p = 2.51E-15); SIIN-specific cells are enriched for an exhausted phenotype (TIL p = 4.01E-17; LCMV p = 1.52E-10). (E) Log-normalized expression of genes associated with progenitor (Tcf7 and Il7r) or exhausted Gzmb and Havcr2) cell states. (F) Heatmap depicting proportions of TCR clonotypes (rows) assigned to each cluster (columns), for clonotypes ≥ 5 cells with ≥ 1 cell assigned to TCF1+ progenitor clusters C4 or C8. (G-H) Percentage of SIIN- versus SIY-specific cells expressing TCF1, TIM3 and GZMB (G) and the proportion of SIY-specific TCF1+ TIM3− and TCF1− cells expressing IFNɣ and TNFα (H) at 5 weeks by flow cytometry. (I) Percentage and absolute number of SIIN- and SIY-specific TCF1+ TIM3− cells over time by flow cytometry. (G-I) are representative of 3 independent experiments, n ≥ 5 mice per group.
Figure 3.
Figure 3.. Enrichment of TCF1+ Progenitor Cells in the SIY Response is Driven by an Antigen Dominance Hierarchy
(A) Lentiviral constructs expressing SIIN and SIY (LucOS), SIIN-only (LucSIIN) and SIY-only (LucSIY) and representative flow cytometry plots of antigen-specific cells in the lung 5–6 weeks post-tumor initiation. (B and C) Percentage of SIIN- and SIY-specific cells of CD8 T cells (B) and the proportion that are TCF1+ TIM3− (C) in LucOS, LucSIIN and LucSIY mice at 5–6 weeks by flow cytometry. (D) Lentiviral constructs expressing SIINYEKL (Y5) in combination with SIY (LucY5S) or alone (LucY5) and representative flow cytometry plots of antigen-specific cells in the lung 5–6 weeks post-tumor initiation. (E) pMHC affinity for each antigen assessed by flow cytometric quantification of H-2Kb stabilization on TAP-deficient RMA-S cells. Dotted lines = 50% binding concentration, which approximates the affinity (Kd) of each peptide for H-2Kb. (F) pMHC complex stability (Koff) for each antigen measured by Differential Scanning Fluorimetry of pMHC thermal melting. Dotted lines = melting temperature (Tm) of each pMHC complex. Displayed Tm values are averaged from 3 experiments. (G) TCR cross-reactivity measured by SIIN and Y5 tetramer co-staining of CD8 T cells from spleens of SIIN-vaccinated mice. Percentage of tetramer+ cells stained by both tetramers is graphed. (H-I) Percentage of Y5-, SIIN- and SIY-specific cells of CD8 T cells (H) and the proportion that are TCF1+ TIM3− (I) at 5–6 weeks in LucOS, LucY5S, LucY5 and LucSIIN mice. (A-F) and (H-I) are representative of ≥ 3 independent experiments, n ≥ 5 mice per group. (E and G) are representative of 2 independent experiments.
Figure 4.
Figure 4.. Subdominant Antigen-Specific T Cells Do Not Preferentially Benefit from anti-PD1/CTLA4 Therapy
(A) Time course of anti-PD1/CTLA4 therapy initiated at 5, 8 or 12 weeks post-tumor initiation, comprised of 3 doses (arrows) of isotype control (Iso) or anti-PD1/CTLA4 (PC) antibodies in LucOS mice. (B-G) Absolute number of SIIN- versus SIY-specific CD8 T cells (B), the proportion expressing TCF1+ TIM3− versus TCF1− TIM3+ (C), the absolute number of TCF1+ TIM3− cells (D), and the proportion expressing Ki67 (E), GZMB (F) and CX3CR1 (TCF1+ and total; G) assessed by flow cytometry in LucOS mice following treatment with Iso or PC starting at 8 weeks unless otherwise indicated. Representative of ≥ 3 independent experiments, n ≥ 5 mice per group.
Figure 5.
Figure 5.. The Subdominant CD8 T Cell Response is Enriched for a CCR6+ TCF1+ Progenitor Cell Subset with a Tc17 Differentiation Trajectory
(A) UMAP embedding of clusters C2, C3, C4 and C8 from the scRNA-seq data in Figure 2B and log-normalized expression of Tcf7 and Havcr2. (B) Expression (mean log(expression +1)) of genes associated with the indicated classifications across clusters C2, C3, C4 and C8. (C) Scoring of cells from (A) for enrichment of a gene signature differentially upregulated in Tc17 versus Tc1 CD8 T cells in the skin of mice infected with S. epidermidis (Linehan et al., 2018; Table S2). (D) Monocle3 lineage trajectories overlaid with UMAP visualizations of Ccr6, Rorc and Il17a expression. (E) TCR clonotype cluster 7 (see Figures S4A and S4D) highlighted on the UMAP plots from (A). (F-G) Percentage of SIIN- and SIY-specific cells expressing CCR6 (F) and the proportion of these cells expressing TCF1, SLAMF6 and RORɣT (G) at 5 weeks by flow cytometry. CCR6+ RORɣT+ cells are subsetted by TCF1 expression. (H) Percentage of SIIN- and SIY-specific cells expressing IL17A at 5 weeks and flow cytometry plots showing co-expression of IL17A with CCR6, RORɣT and TCF1 on SIY-specific cells. (I-J) Percentage of SIIN- and SIY-specific TCF1+ TIM3− cells expressing CCR6 over time and following one week of treatment with isotype (Iso) or anti-PD1/CTLA4 (PC) antibodies starting at 5 weeks. (K) Percentage of SIIN- and SIY-specific TCF1+ cells that express CX3CR1 subsetted by CCR6 expression following Iso or PC treatment at 5 weeks. (L) Irradiated KP mice were reconstituted with IL17aCre × Rosa26LSL-tdTomato bone marrow and LucOS tumors were initiated. Flow cytometric analysis of the percentage of SIY-specific cells expressing Tomato (marking current/prior IL17A expression) following one week of Iso or PC treatment starting at 5 weeks is shown. Data are compiled from 2 independent experiments. Data in (F-K) are representative of ≥ 3 independent experiments, n ≥ 5 mice per group.
Figure 6.
Figure 6.. Therapeutic Vaccination Breaks Antigen Dominance and Eliminates the CCR6+ Subset of TCF1+ Progenitor Cells
(A) SIIN and SIY long-peptide and cyclic di-GMP vaccine. Mice were vaccinated at 6 weeks (s.c. tail base), boosted at 8 weeks and analyzed 9 weeks post-tumor initiation. (B-D) Absolute number of SIIN- and SIY-specific cells (B) and the percentage expressing Ki67 (C) and GZMB (D) in PBS control (Ctrl) versus vaccine (Vax) treated mice by flow cytometry. (E-G) Tissue-based cyclic immunofluorescence (t-CyCIF) imaging of lung lobes of Ctrl versus Vax-treated mice (E) and quantification of CD8 T cell infiltration and tumor size (F) and the percentage of Ki67 and GZMB positive CD8 T cells in tumors (G). Results are averaged from all tumors from two lung lobes per mouse. (H-I) Absolute number of SIIN- and SIY-specific cells in the lung (H) and the percentage in the blood (I) of Ctrl versus Vax treated mice 7 days after the initial vaccine dose. (J) Absolute number of SIIN- and SIY-specific cells in mice treated with Ctrl, Vax, SIIN-only vaccine or SIY-only vaccine as in (A). (K-L) Percentage of SIIN- and SIY-specific cells that are TCF1+ TIM3− (K) and the proportion of these cells that express CCR6 (L) in Ctrl versus Vax treated mice by flow cytometry. (M) Proportion of CCR6+ SIIN- and SIY-specific cells expressing RORɣT in Ctrl versus Vax treated mice by flow cytometry. (B-D) and (J-M) are representative of ≥ 3 independent experiments, n ≥ 5 mice per group. (H-I) are compiled from 2 independent experiments.
Figure 7.
Figure 7.. CCR6+ TCF1+ and Tc17 Cells are Found Across Human Cancers
(A) Enrichment of CD8 gene signatures from three human cancer scRNA-seq datasets (Table S4) in the mouse scRNA-seq clusters from Figure 2B. Human clusters, right; mouse clusters, top. Colored boxes indicate significant enrichment, p ≤ 0.05. (B-C) UMAP of tumor CD8 T cells from a human pan-cancer scRNA-seq dataset (Wu et al., 2020) showing enrichment of gene signatures derived from mouse progenitor clusters C4 and C8 (B) and expression of TCF7, HAVCR2, co-expression of TCF7, CCR6 and RORC and co-expression of IL17A with TCF7, CCR6 and/or RORC (C). (D-F) t-CYCIF images of human lung adenocarcinoma and metastatic melanoma samples (D-E) and quantification of CD8 T cells expressing TCF1 and CCR6 (F). (G) UMAP embedding of CD8 T cells from an anti-PD1 and/or anti-CTLA4 melanoma scRNA-seq dataset (Sade-Feldman et al., 2018) showing cell assignment to published clusters CD8_1 thru CD8_6 and responder versus non-responder patients. (H) Scoring of cells in (G) for enrichment of gene signatures (Table S3) derived from mouse Ccr6Tcf7+ and Ccr6+ Tcf7+ cells. (I-J) Enrichment of the gene signatures from (H) in clusters CD8_1 thru CD8_6 (I) and responders versus non-responders (J). In (C) and (I-J), mucosal invariant T (MAIT) cells that phenotypically resemble Tc17 cells were excluded from the analysis based on TCR sequence (Table S6; STAR methods).

References

    1. Anagnostou V, Smith KN, Forde PM, Niknafs N, Bhattacharya R, White J, Zhang T, Adleff V, Phallen J, Wali N, et al. (2017). Evolution of Neoantigen Landscape during Immune Checkpoint Blockade in Non-Small Cell Lung Cancer. Cancer Discov 7, 264–276. - PMC - PubMed
    1. Anderson KG, Mayer-Barber K, Sung H, Beura L, James BR, Taylor JJ, Qunaj L, Griffith TS, Vezys V, Barber DL, et al. (2014). Intravascular staining for discrimination of vascular and tissue leukocytes. Nat Protoc 9, 209–222. - PMC - PubMed
    1. Andreatta M, Corria-Osorio J, Muller S, Cubas R, Coukos G, and Carmona SJ (2021). Interpretation of T cell states from single-cell transcriptomics data using reference atlases. Nat Commun 12, 2965. - PMC - PubMed
    1. Baldarelli RM, Smith CM, Finger JH, Hayamizu TF, McCright IJ, Xu J, Shaw DR, Beal JS, Blodgett O, Campbell J, et al. (2020). The mouse Gene Expression Database (GXD): 2021 update. Nucleic Acids Res. - PMC - PubMed
    1. Bentzen AK, Such L, Jensen KK, Marquard AM, Jessen LE, Miller NJ, Church CD, Lyngaa R, Koelle DM, Becker JC, et al. (2018). T cell receptor fingerprinting enables in-depth characterization of the interactions governing recognition of peptide-MHC complexes. Nat Biotechnol. - PMC - PubMed

Publication types

MeSH terms