. 2021 Sep 16;184(19):5031-5052.e26.
doi: 10.1016/j.cell.2021.08.023.

Proteogenomic characterization of pancreatic ductal adenocarcinoma

Collaborators, Affiliations

Proteogenomic characterization of pancreatic ductal adenocarcinoma

Liwei Cao et al. Cell. .

Abstract

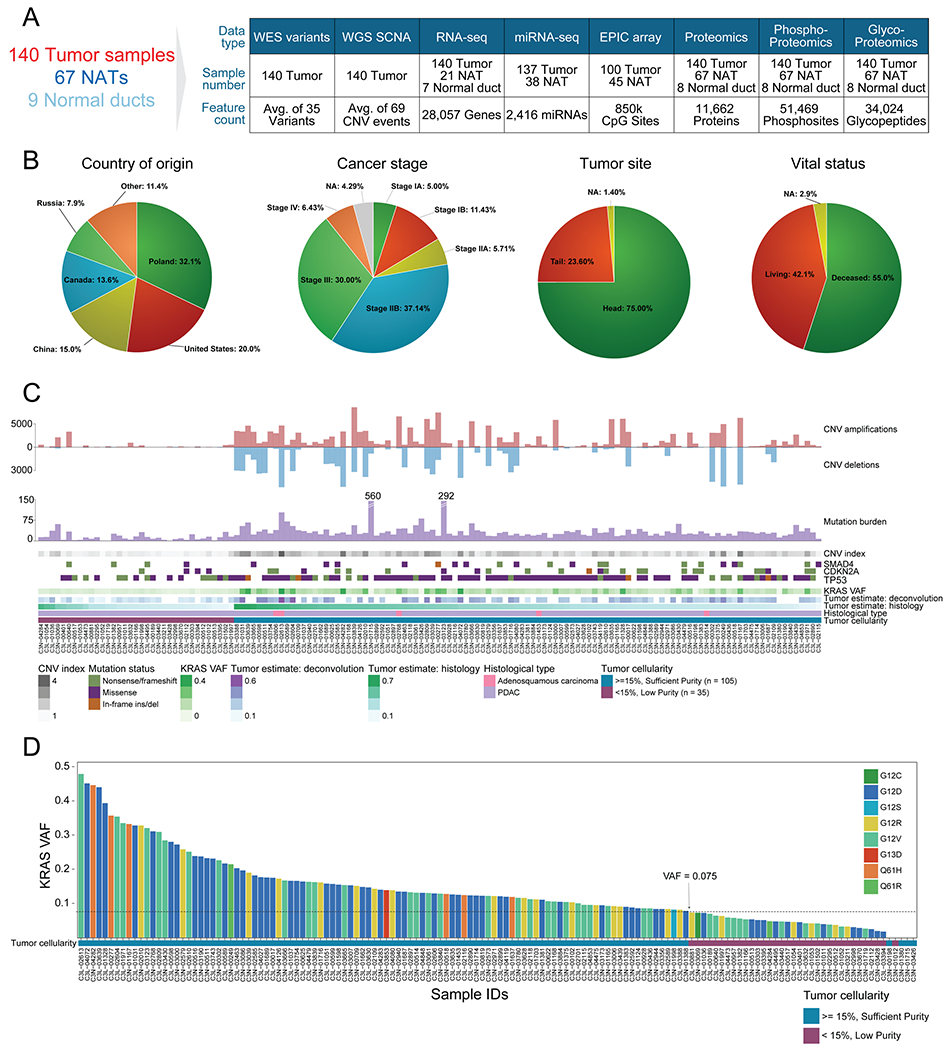
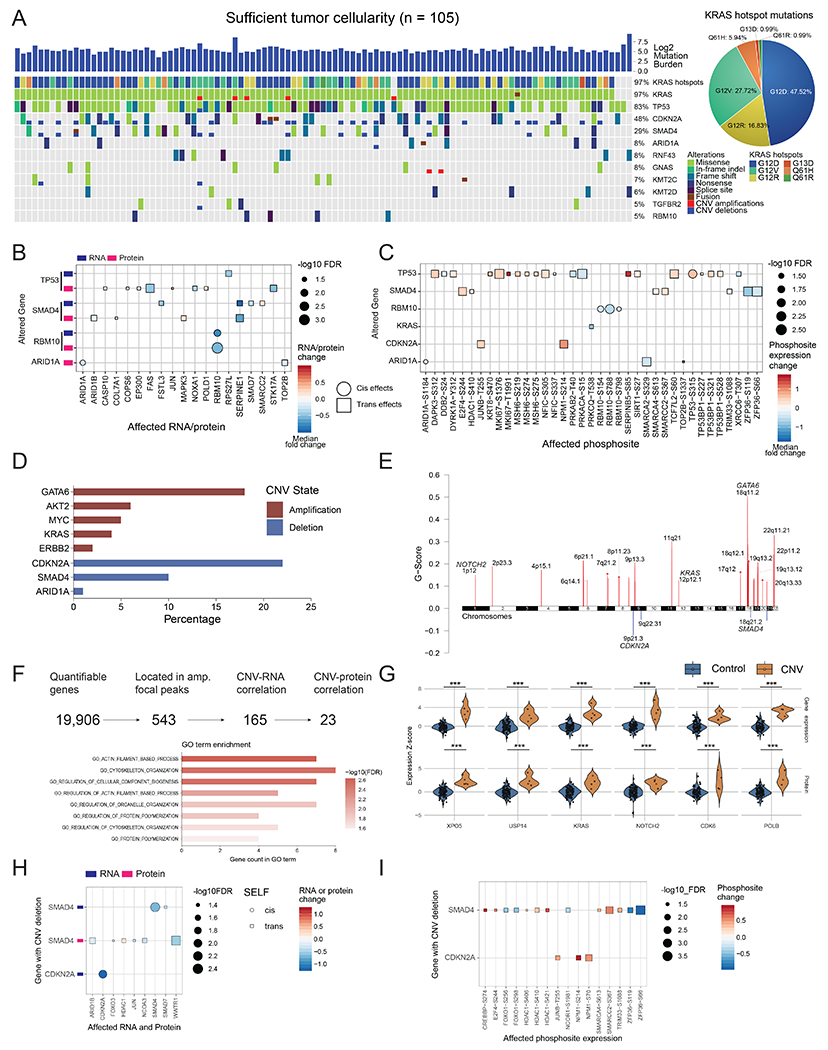
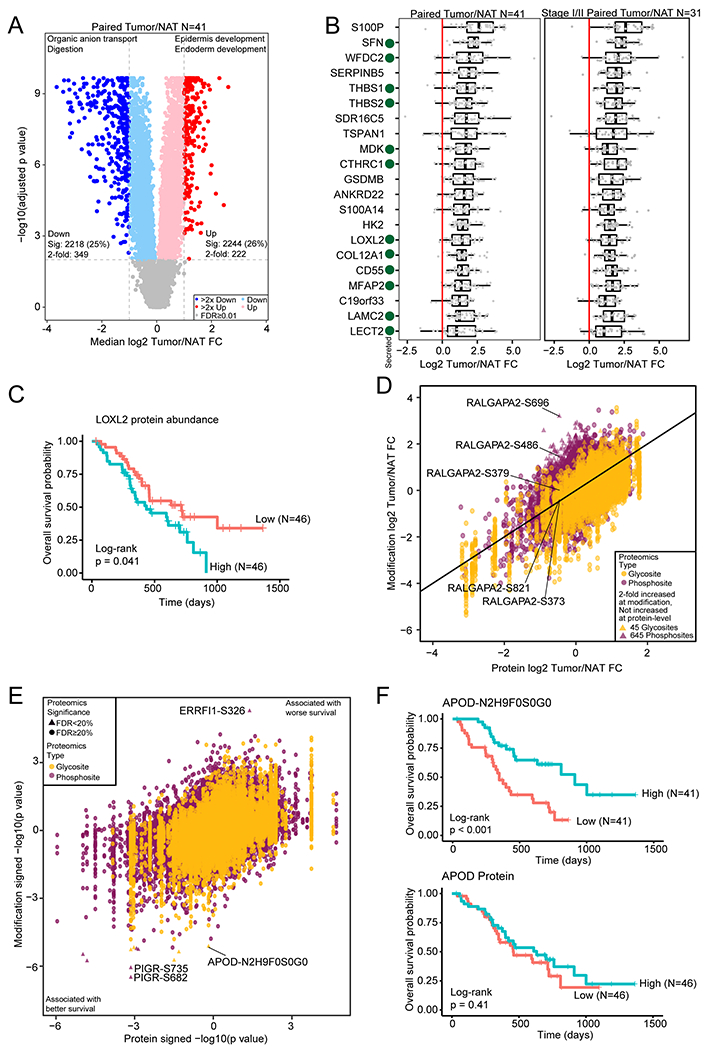
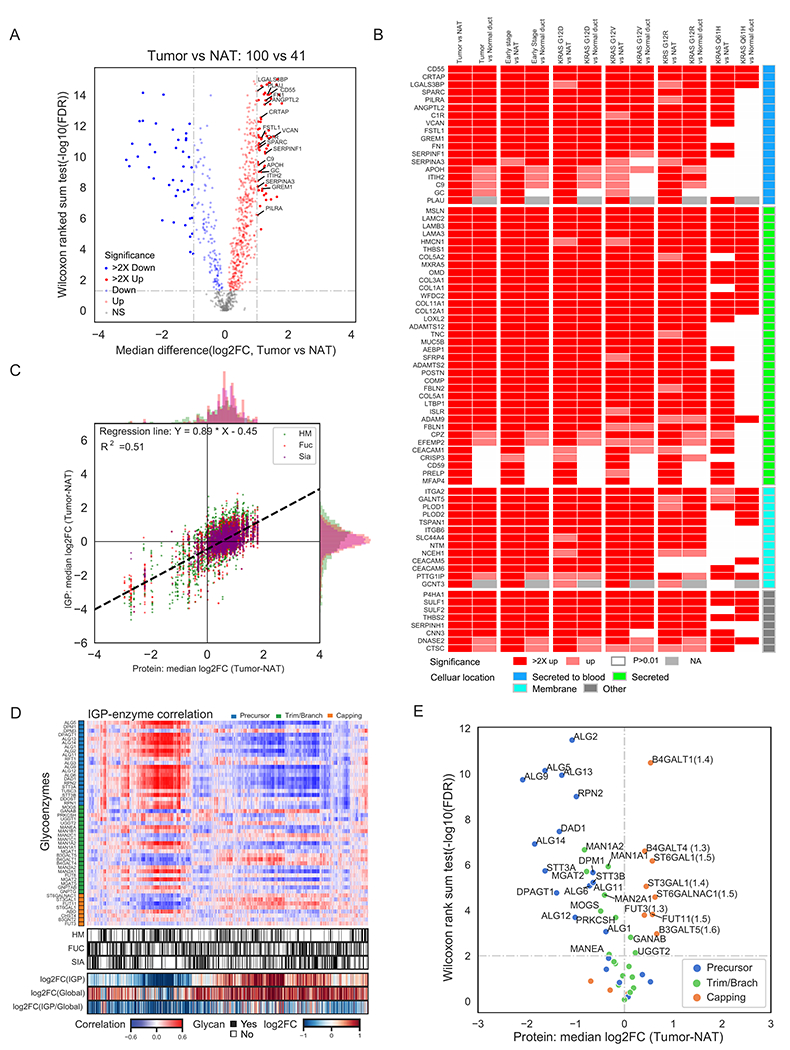
Pancreatic ductal adenocarcinoma (PDAC) is a highly aggressive cancer with poor patient survival. Toward understanding the underlying molecular alterations that drive PDAC oncogenesis, we conducted comprehensive proteogenomic analysis of 140 pancreatic cancers, 67 normal adjacent tissues, and 9 normal pancreatic ductal tissues. Proteomic, phosphoproteomic, and glycoproteomic analyses were used to characterize proteins and their modifications. In addition, whole-genome sequencing, whole-exome sequencing, methylation, RNA sequencing (RNA-seq), and microRNA sequencing (miRNA-seq) were performed on the same tissues to facilitate an integrated proteogenomic analysis and determine the impact of genomic alterations on protein expression, signaling pathways, and post-translational modifications. To ensure robust downstream analyses, tumor neoplastic cellularity was assessed via multiple orthogonal strategies using molecular features and verified via pathological estimation of tumor cellularity based on histological review. This integrated proteogenomic characterization of PDAC will serve as a valuable resource for the community, paving the way for early detection and identification of novel therapeutic targets.

Keywords: CPTAC; KRAS; endothelial cell; glycoproteins; immune-cold tumors; kinase inhibitors; neoplastic cellularity; pancreatic ductal adenocarcinoma; proteogenomics; tumor subtyping.


Conflict of interest statement

Declaration of interests R.H.H. has the potential of receiving royalty payments from Thrive Earlier Diagnosis for the GNAS invention in a relationship overseen by Johns Hopkins University. The remaining authors declare no competing interests.

Figures

Figure 1.
Figure 1.. Proteogenomic landscape of the PDAC cohort.
A) Sample numbers and omics data types of the cohort. B) Country of origin, cancer stage, tumor site, and vital status proportions in the cohort. C) Molecular and histology-based tumor estimates are used to classify samples into “sufficient” and “low” purity groups. D) KRAS VAF distribution in the cohort colored by KRAS hotspot amino acid change. The sufficient neoplastic purity KRAS VAF cutoff, denoted by a dashed line, is 0.075 (15% neoplastic cellularity). The 4 samples with no KRAS mutations detected were also included in the sufficient tumor cellularity group since they had high mutation burden (n > 25), high CNV (index > 1), and/or additional driver events in TP53, CDKN2A, and SMAD4.
Figure 2.
Figure 2.. Impact of genomic alterations on the transcriptome, proteome, and phosphoproteome.
A) Genomic landscape of the cohort with sufficient tumor cellularity (n = 105) showing mutated genes with a frequency ≥0.05. All mutation types are considered, including missense, frameshift, splice-site, copy number alterations, and fusion events. G12D, G12R, and G12V are the most common KRAS driver mutations present in the cohort. B) Cis- and trans-effects of genomic alterations on RNA and protein levels. C) Cis- and trans-effects of genomic alterations on phosphosites. Protein levels are used as a covariate to remove protein abundance-related effects. In B and C, cis-effects are denoted by circles while trans-effects are denoted with squares. D) Major gene copy number amplification and deletion rates in the cohort. The log ratio cutoffs used are [−0.4, 0.4] (See STAR Methods). E) Significant arm level focal peaks detected using GISTIC. Several of these peaks contain known driver genes in PDAC such as GATA6, CDKN2A, and SMAD4. F) CNV driver approach schematic. From all genes with copy number events, 543 are located in the GISTIC focal peaks, of which 165 have RNA effects and 23 also have protein level effects. These 23 genes have roles in actin filament and cytoskeleton organization pathways. G) Violin plots showing the impact of copy number in a select number of proteins from these 23 putative CNV drivers. *** Denote p < 0.001. The control group in each comparison includes all samples without the copy number event for each gene or protein. The alterations of H) mRNA and proteins, and I) phosphosites associated with CDKN2A and SMAD4 deletions. Samples with wild-type CDKN2A and SMAD4 serve as controls.
Figure 3.
Figure 3.. Identification of tumor-associated proteins and modification sites by comparison of tumor and normal tissues.
A) Differential protein abundance between tumors and paired NATs. Selected GO biological process terms for significantly increased and significantly decreased proteins are shown above the volcano plot. B) Proteins with a median fold change > 2 compared to matched NAT and with significantly increased abundance both compared to normal ductal tissues and after adjusting for epithelial content for all samples and the subset of stage I/II samples. Secreted proteins are indicated with a green dot. C) Kaplan-Meier curve for LOXL2 protein abundance association with overall survival. The two groups were separated by median LOXL2 abundance. D) Median phosphosite and N-linked glycosylation site fold change compared to the protein fold change in tumor compared to matched NAT. E) Cox regression signed p value for phosphosite and N-linked glycosylation site abundance association with survival compared to the protein association to survival. F) Kaplan-Meier survival curves for an N-linked glycosylation site on APOD and APOD protein abundance.
Figure 4.
Figure 4.. Glycoproteomic characterization identified N-linked glycoproteins and glycosylation enzymes for the early detection or therapeutic intervention.
A) Differential expression analysis of N-linked glycoproteins in tumors to identify the most significant secreted (highlighted) and membrane N-linked glycoproteins elevated in tumors compared to NATs. B) Up-regulation of N-linked glycoproteins in all tumors, early stage tumors or tumors with different hotspot KRAS mutations relative to NATs and normal ductal tissues (Normal duct) at N-linked glycoprotein expression levels. C) Comparative analysis of the expression of global proteomics and glycoproteomics. IGP: intact glycopeptides; HM: high mannose type glycopeptides; Fuc: fucosylated glycopeptides; Sia: sialylated glycopeptides. D) Association of intact glycopeptide abundance and protein levels of glycosylation enzymes in tumors and NATs. E) Differential protein expression of N-linked glycosylation enzymes between tumors and NATs.
Figure 5.
Figure 5.. Kinase and substrate co-regulation.
A) Differential abundances between 41 tumor/NAT paired tissues of stratified phospho-substrates (top) and their associated kinases (bottom). B) Pathways based on the selected phospho-substrates and kinases, with relevant drugs. Expression changes on mRNA and/or protein/phosphosites between PDAC tumors and NATs/Normal ductal tissues are labeled. C) Expression profiles of PAK1- and PAK2-associated proteins at transcriptomics and proteomics levels. D) Expression profiles of the class I p21-activated kinases (PAKs) in Normal duct, NAT, Tumor, and Early stage. E) Heatmap showing kinases elevated in different KRAS hotspot mutations. The kinases were identified based on their up-regulated phospho-substrates. The drug target annotation is from Human Protein Atlas (https://www.proteinatlas.org/) alongside with the log-transformed druggability score based on the drug sensitivity evaluated in PDAC cell lines from Genomics of Drug Sensitivity in Cancer (https://www.cancerrxgene.org/). Normal duct: normal ductal tissues; NAT: normal adjacent tissues; Tumor: all PDAC tumors; Early stage: Stage I and II PDAC tumors. Asterisks represent significant differences between two groups (Benjamini-Hochberg adjusted p): *p < 0.05; **p < 0.01; ***p<0.001; N.S., not significant. The list of kinase inhibitors/drugs is not exhaustive.
Figure 6.
Figure 6.. Delineation of the cellular composition of PDAC tumors and identification of biological events accounting for the immune-cold phenotype.
A) The 140 tumors were classified into four clusters based on tumor composition (upper heatmap). The cytotoxic T cells, together with endothelial cells enriched in the cluster D are highlighted by a rectangle. The expression of immune cytotoxic factor and checkpoint genes is shown in the sample order (lower heatmap). B) The comparison of endothelial cells between immune hot and cold samples based on the in silico deconvolution using either xCell or MCPCounter. C) Immune cold tumors have reduced endothelial adhesion proteins. D) Immune cold tumors have upregulated VEGF and hypoxia pathways. B-D: **p<0.01, n.s. not significant, Student’s t-test. E) The immune cold tumors had higher levels of glycolytic pathway components. Shown are the comparison of these components between immune cold vs hot at both the RNA and protein level. Some of the pathway components are identified with known functional phosphosites and are highlighted by brown circles. F) Phosphorylation pathway enrichment showed that the immune cold samples have higher phosphorylation levels of cell junction proteins. Shown are immune cold vs. hot fold changes for protein phosphorylation, protein expression and RNA expression. *p<0.05, Student’s t-test. G) The possible working model. VEGF and hypoxia pathways are associated with aberrant tumor vasculature and a hypoxic tumor microenvironment, and downregulated endothelial cell adhesion proteins, increased glycolysis and cell junction further inhibit the cytotoxic immune infiltration and function. H) The clinical outcome associated with CD8+ T cells. I) The clinical outcome associated with VEGF and hypoxia pathway activities. H-I): The p values were derived from logrank test and numbers in parentheses represent sample sizes for each group.
Figure 7.
Figure 7.. Proteogenomic subtyping of 105 high-purity tumors using gene copy number, mRNA, protein, phosphosite, and glycosite abundances largely separated tumors to two subtypes.
A) Heatmap depicting the z-scored abundances of proteogenomic features separating the two clusters as determined by NMF. Cluster membership scores indicating the strength of association of each sample with a given cluster were calculated as proportional weights. The columns of the matrix are ordered by proteogenomic subtype and decreasing cluster membership score. B) Pathway-level analysis on proteogenomic subtypes. Shown are pathway activity scores of cancer hallmark gene sets derived from single sample Gene Set Enrichment Analysis (ssGSEA) applied to the vector of feature weights characterizing each cluster. Asterisks indicate gene sets with FDR < 0.01. cat: category. C) Overrepresentation analysis of clinical variables, RNA-subtypes and somatic mutations in each proteogenomic subtype (Fisher’s exact test). Size of the dots scale with the significance of association. Cyan dots indicate association with the C1 (NMF classical), orange dots with the C2 (NMF basal-like) subtype. Vertical dashed lines correspond to nominal p-value of 0.05. D-G) Kaplan-Meier Plots comparing the survival outcomes between (D) Moffitt classical samples assigned into proteogenomic classical cluster (C1) and proteogenomic basal-like cluster (C2), (E) Moffitt basal-like samples assigned to the two proteogenomic clusters, (F) the two proteogenomic clusters, and (G) the two Moffitt subtypes. The p values were derived from logrank test and numbers in parentheses represent sample sizes for each group. The hazard ratios (HRs) were derived from Cox PH regression and shown as “HR (95% confidence interval)”.

References

    1. Akagi J, Takai E, Tamori Y, Nakagawa K, and Ogawa M (2001). CA19-9 epitope a possible marker for MUC-1/Y protein. International journal of oncology 18, 1085–1091. - PubMed
    1. Allen E, Jabouille A, Rivera LB, Lodewijckx I, Missiaen R, Steri V, Feyen K, Tawney J, Hanahan D, Michael IP, et al. (2017). Combined antiangiogenic and anti-PD-L1 therapy stimulates tumor immunity through HEV formation. Science translational medicine 9. - PMC - PubMed
    1. American Cancer Society (2021). Cancer Facts & Figures 2021. Atlanta: American Cancer Society.
    1. Annan DA, Kikuchi H, Maishi N, Hida Y, and Hida K (2020). Tumor Endothelial Cell-A Biological Tool for Translational Cancer Research. International journal of molecular sciences 21. - PMC - PubMed
    1. Aran D, Hu Z, and Butte AJ (2017). xCell: digitally portraying the tissue cellular heterogeneity landscape. Genome Biol 18, 220. - PMC - PubMed

SI Reference

    1. Arntfield ME, and van der Kooy D (2011). beta-Cell evolution: How the pancreas borrowed from the brain: The shared toolbox of genes expressed by neural and pancreatic endocrine cells may reflect their evolutionary relationship. Bioessays 33, 582–587. - PubMed

Publication types

MeSH terms