

doi: 10.1053/j.gastro.2021.09.022.
Epub 2021 Sep 14.
Genomic and Molecular Analyses Identify Molecular Subtypes of Pancreatic Cancer Recurrence
Collaborators,
Affiliations
- PMID: 34534536
- PMCID: PMC8721486
- DOI: 10.1053/j.gastro.2021.09.022
Item in Clipboard
Genomic and Molecular Analyses Identify Molecular Subtypes of Pancreatic Cancer Recurrence
Gastroenterology.
2022 Jan.
No abstract available
Figures
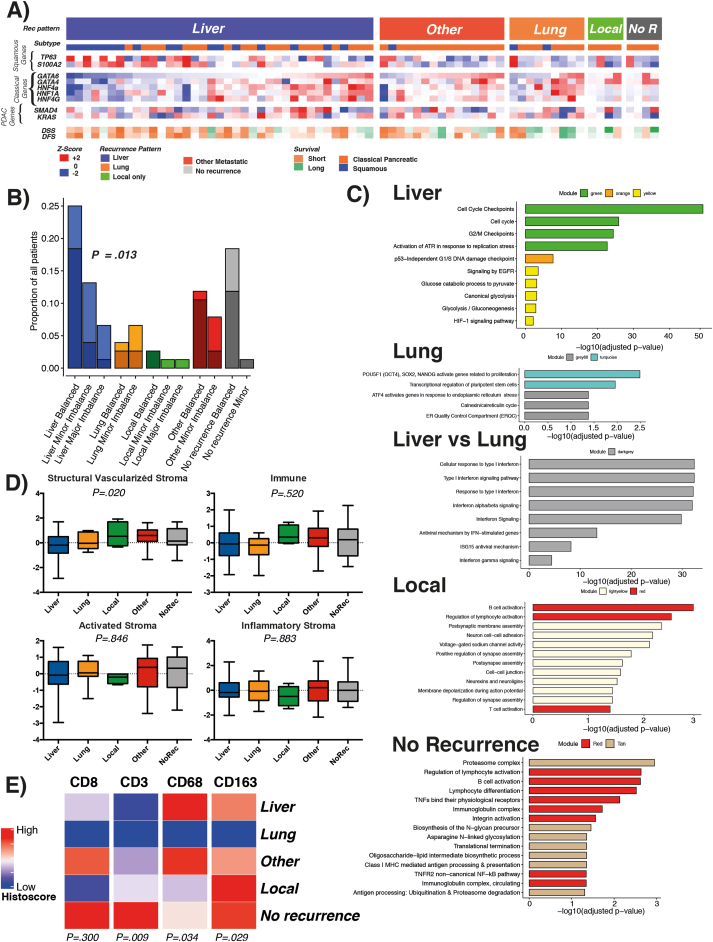
(A) Heatmap of RNA sequenced cases with disease recurrence pattern. Heatmap demonstrates recurrence pattern, molecular subtype, relative expression of key genes of PC, classical and squamous subtype lineage, and outcome. (B) KRAS allelic imbalance and whole genome doubling in recurrence patterns. Scale is based on proportion of overall cohort. Dark shade represents no whole genome doubling and light shade whole genome doubling for each recurrence pattern stratified by KRAS allelic status. P value calculated for KRAS imbalance in liver versus all other recurrence patterns using chi-square test. (C) Relevant molecular pathways enriched in specific recurrence patterns categorized by gene module defined by Bailey et al. Size of bar proportional to statistical weight, horizontal scale numerical for P. (D) Stromal signatures as defined by Puleo et al for each recurrence pattern. P calculated as analysis of variance between groups. (E) Heatmap of relative immune cell infiltration histoscore in different recurrence patterns. Histoscore represents cumulative score for all tissue microarray cores per patient.
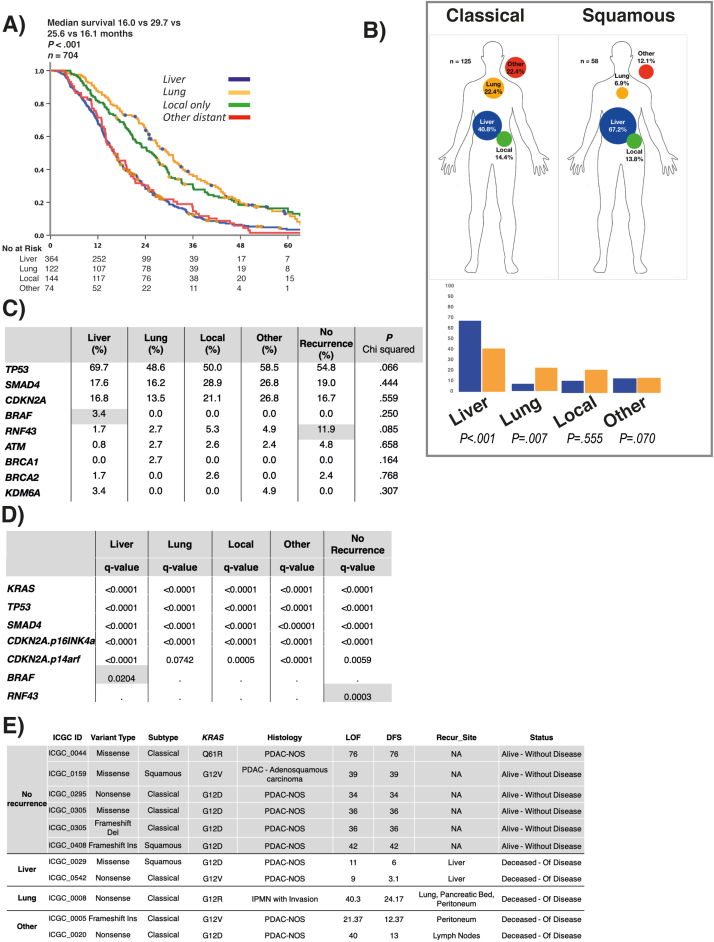
(A) Kaplan-Meier curve of disease-specific survival stratified by recurrence pattern in all 3 cohorts (total n = 1087). Only those with recurrent disease (n = 704) are shown. (B) Proportion of each recurrence pattern in patients with classical and squamous subtype. Squamous subtype enriched for liver recurrence (P < .001); classical subtype associated with lung recurrence (P = .007). Bar chart demonstrates the relative proportions of each molecular subtype in different recurrence patterns. Proportion is based on the frequency of each recurrence pattern per molecular subtype. (C) Proportion of gene mutations in each recurrence pattern. P value calculated using chi-square. (D) Table of significantly mutated gene analysis in recurrence patterns. A significant q value (<0.05) represents an association between mutation and recurrence pattern. Only BRAF (liver) and RNF43 (no recurrence) were significant in specific recurrence patterns. (E) Table of clinical, molecular, and pathologic features of RNF43 mutants in analyzed cohort.
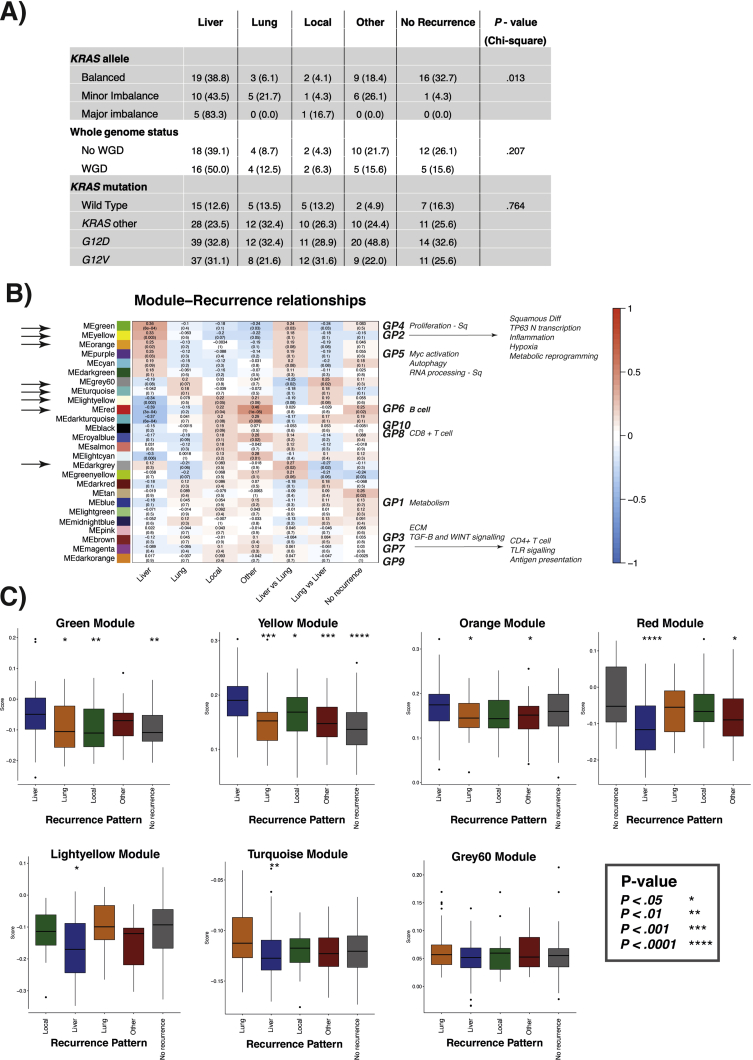
(A) Table demonstrating frequency of KRAS allelic imbalance and whole genome doubling in recurrence patterns of PCAWG cohort. (B) Transcriptional modules defined as significant by Bailey et al in each recurrence group for patients with RNA sequencing data. Significant modules that are associated with recurrence patterns are highlighted with black arrow on left y-axis. Key processes and gene programs previously described by Bailey et al that define squamous and classical pancreatic (pancreatic progenitor, immunogenic, ADEX) subtypes are highlighted along right-hand y-axis. (C) Relative enrichment score of genes associated with recurrence pattern in each module that associated with recurrence pattern, from the APGI microarray cohort. Statistical significance levels are ∗≤.05, ∗∗≤.01, ∗∗∗≤.001, and ∗∗∗∗≤.0001 with the first given recurrence pattern as reference (for example, for green, yellow, and orange modules the reference is liver, for light yellow it is local, and for turquoise and grey 60 the reference is lung).
References
Supplementary References
-
- Bailey P., et al. Nature. 2016;531:47–52. - PubMed
Publication types
MeSH terms
Substances
Grants and funding
LinkOut - more resources
Full Text Sources
Medical
