. 2022 Jan 20:805:150121.
doi: 10.1016/j.scitotenv.2021.150121. Epub 2021 Sep 4.

SARS-CoV-2 RNA concentrations in wastewater foreshadow dynamics and clinical presentation of new COVID-19 cases

Affiliations

SARS-CoV-2 RNA concentrations in wastewater foreshadow dynamics and clinical presentation of new COVID-19 cases

Fuqing Wu et al. Sci Total Environ. .

Abstract

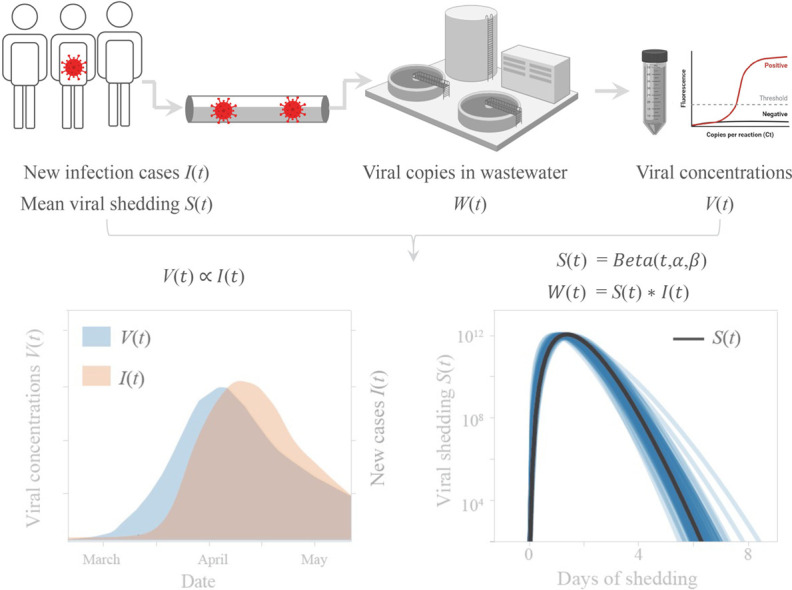
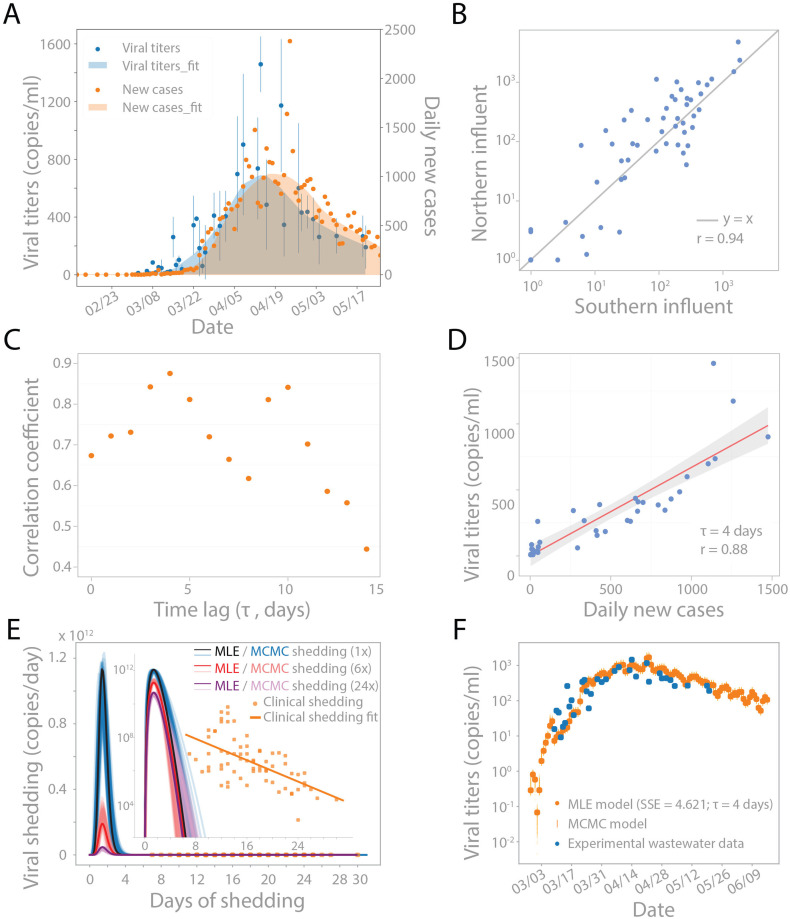
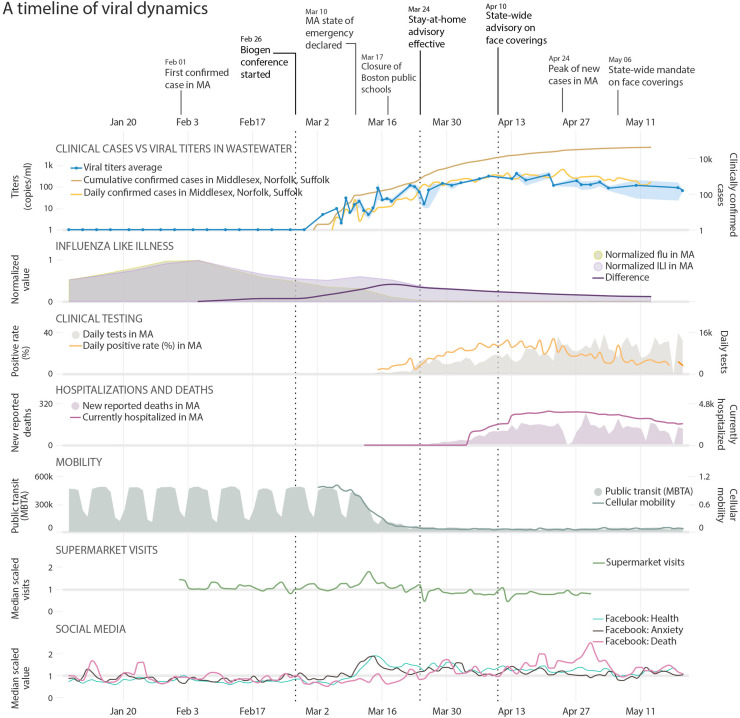
Current estimates of COVID-19 prevalence are largely based on symptomatic, clinically diagnosed cases. The existence of a large number of undiagnosed infections hampers population-wide investigation of viral circulation. Here, we quantify the SARS-CoV-2 concentration and track its dynamics in wastewater at a major urban wastewater treatment facility in Massachusetts, between early January and May 2020. SARS-CoV-2 was first detected in wastewater on March 3. SARS-CoV-2 RNA concentrations in wastewater correlated with clinically diagnosed new COVID-19 cases, with the trends appearing 4-10 days earlier in wastewater than in clinical data. We inferred viral shedding dynamics by modeling wastewater viral load as a convolution of back-dated new clinical cases with the average population-level viral shedding function. The inferred viral shedding function showed an early peak, likely before symptom onset and clinical diagnosis, consistent with emerging clinical and experimental evidence. This finding suggests that SARS-CoV-2 concentrations in wastewater may be primarily driven by viral shedding early in infection. This work shows that longitudinal wastewater analysis can be used to identify trends in disease transmission in advance of clinical case reporting, and infer early viral shedding dynamics for newly infected individuals, which are difficult to capture in clinical investigations.

Keywords: Convolution model; Foreshadow; Longitudinal; SARS-CoV-2; Viral shedding; Wastewater surveillance.


Conflict of interest statement

Declaration of competing interest The authors declare the following financial interests/personal relationships which may be considered as potential competing interests: MM and NG are cofounders of Biobot Analytics. EJA is advisor to Biobot Analytics. CD, KAM, KF, and NE are employees at Biobot Analytics, and all these authors hold shares in the company. PRC and TBE have a financial interest in Biobot Analytics, a company engaged in the collection and analysis of wastewater to develop epidemiological data. PRC and TBE's interests were reviewed and are managed by Brigham and Women's Hospital and Mass General Brigham in accordance with their conflict-of-interest policies.

Figures

Unlabelled Image
Graphical abstract
Fig. 1
Fig. 1
SARS-CoV-2 concentrations in wastewater correlate with new clinical cases, with a temporal offset. (A) Viral RNA concentrations in wastewater samples from March 3 to May 20 (blue dots) and new clinical cases from February 12 to May 20 in Norfolk, Suffolk, and Middlesex counties served by the wastewater treatment plant (orange dots). LOWESS smoothing was applied to show the trends for viral concentrations (shaded blue) and daily new cases (shaded orange). Viral concentrations were normalized by PMMoV concentrations in each sample, and the blue dot represents the mean of northern and southern viral concentrations. (B) Unsmoothed viral concentrations in the northern and southern influents are highly correlated and have similar magnitudes for all the data generated by Method I and II combined (see Materials and methods). Blue line represents y = x. Pearson's r = 0.94. (C) Linear correlation between unsmoothed viral concentrations in wastewater and unsmoothed daily new cases with different time lags from 0 to 14 days. Pearson's correlation coefficient is highest with a 4 day time lag. Grey bar highlighted the points with the 1st and 2nd highest correlation coefficients. (D) Viral concentrations correlate with daily new cases with a 4-d time lag. Red solid line is the linear regression fitting. Grey area: 95% confidence interval from standard error of the fitting. Pearson's r = 0.88. (E–F) Modeling wastewater concentrations as a convolution of new cases per day and virus shedding per day. (E) Beta function with optimal shape and scaling parameters (α, β, c) representing the average viral shedding function S(t) on a linear scale and log scale (inset). The shedding function was inferred using 1× reported cases (black), 6× reported cases (red), and 24× reported cases (purple) based on reports that true case numbers could be 6–24× higher than reported cases. Markov Chain Monte Carlo (MCMC) simulation was used to investigate the uncertainty landscape around the MLE shedding function, and 100 random MCMC results are shown in blue, pink, and lavender for 1×, 6×, and 24× reported cases, respectively. Clinically reported values provided by Wolfel et al. are added in orange for reference, with linear regression fit (Wölfel et al., 2020). (F) Viral concentrations based on the convolution model compared to viral concentrations observed in wastewater. Model output is the convolution of new cases per day I(t) and MLE shedding function S(t) from (E). 100 random MCMC simulation results of the shedding function were convolved with I(t) to illustrate the uncertainty around the MLE model results (orange vertical lines). (For interpretation of the references to color in this figure legend, the reader is referred to the web version of this article.)
Fig. 2
Fig. 2
A timeline of viral dynamics in the context of key events and clinical/behavioral data. Trends are plotted in the same time frame, from January 8 to May 20. Row 1: Timeline of COVID-19 pandemic and important events in MA. Row 2: Clinical Cases vs Viral concentrations in Wastewater: Viral concentrations in wastewater (blue line along the primary y-axis, shaded area represents the minimum/maximum of PMMoV-adjusted viral concentrations), daily (orange line) and cumulative (brown line) confirmed cases along the secondary y-axis. Influenza Like Illness: Visits for influenza-like illness (ILI, purple shading) and confirmed flu cases (light green shading), and the difference between the two after normalization (purple line), which shows a peak of non-flu ILI at March 18. Clinical Testing: Daily SARS-CoV-2 tests and positive rates in MA. Hospitalizations and Deaths: New reported COVID-19 related deaths and hospitalizations in MA. Mobility: Public transit and cellular mobility data. Supermarket Visits: Supermarket visits in MA (normalized by the median value). Social Media: Facebook posts with terms expressing “Health”, “Anxiety”, and “Death”. Dashed lines in all the panels represent the date of the Biogen conference, the stay-at-home advisory in MA, and the state-wide face covering advisory. (For interpretation of the references to color in this figure legend, the reader is referred to the web version of this article.)

References

    1. Ahmed W., Angel N., Edson J., Bibby K., Bivins A., O’Brien J.W., Choi P.M., Kitajima M., Simpson S.L., Li J., Tscharke B., Verhagen R., Smith W.J.M., Zaugg J., Dierens L., Hugenholtz P., Thomas K.V., Mueller J.F. First confirmed detection of SARS-CoV-2 in untreated wastewater in Australia: a proof of concept for the wastewater surveillance of COVID-19 in the community. Sci. Total Environ. 2020;728 doi: 10.1016/j.scitotenv.2020.138764. - DOI - PMC - PubMed
    1. Ahmed W., Bertsch P.M., Bivins A., Bibby K., Farkas K., Gathercole A., Haramoto E., Gyawali P., Korajkic A., McMinn B.R., Mueller J.F., Simpson S.L., Smith W.J.M., Symonds E.M., Thomas K.V., Verhagen R., Kitajima M. Comparison of virus concentration methods for the RT-qPCR-based recovery of murine hepatitis virus, a surrogate for SARS-CoV-2 from untreated wastewater. Sci. Total Environ. 2020;739 doi: 10.1016/j.scitotenv.2020.139960. - DOI - PMC - PubMed
    1. Auerswald H., Yann S., Dul S., In S., Dussart P., Martin N.J., Karlsson E.A., Garcia-Rivera J.A. Assessment of inactivation procedures for SARS-CoV-2. J. Gen. Virol. 2021;102 doi: 10.1099/jgv.0.001539. - DOI - PMC - PubMed
    1. Baker-Polito Administration Announces New Initiatives to Stop Spread of COVID-19 | Mass.gov [WWW Document], n.d. URL https://www.mass.gov/news/baker-polito-administration-announces-new-init... (accessed 6.9.21).
    1. Bao L., Deng W., Huang B., Gao H., Liu J., Ren L., Wei Q., Yu P., Xu Y., Qi F., Qu Y., Li F., Lv Q., Wang W., Xue J., Gong S., Liu M., Wang G., Wang S., Song Z., Zhao Linna, Liu P., Zhao Li, Ye F., Wang H., Zhou W., Zhu N., Zhen W., Yu H., Zhang X., Guo L., Chen L., Wang C., Wang Y., Wang X., Xiao Y., Sun Q., Liu H., Zhu F., Ma C., Yan L., Yang M., Han J., Xu W., Tan W., Peng X., Jin Q., Wu G., Qin C. The pathogenicity of SARS-CoV-2 in hACE2 transgenic mice. Nature. 2020;583:830–833. doi: 10.1038/s41586-020-2312-y. - DOI - PubMed