. 2022 Jan 11;6(1):212-224.
doi: 10.1182/bloodadvances.2021004271.

Association of allele-specific methylation of the ASNS gene with asparaginase sensitivity and prognosis in T-ALL

Affiliations

Association of allele-specific methylation of the ASNS gene with asparaginase sensitivity and prognosis in T-ALL

Koshi Akahane et al. Blood Adv. .

Abstract

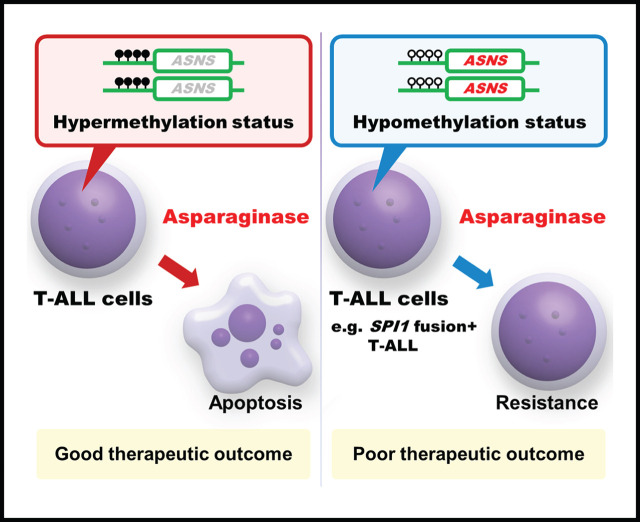
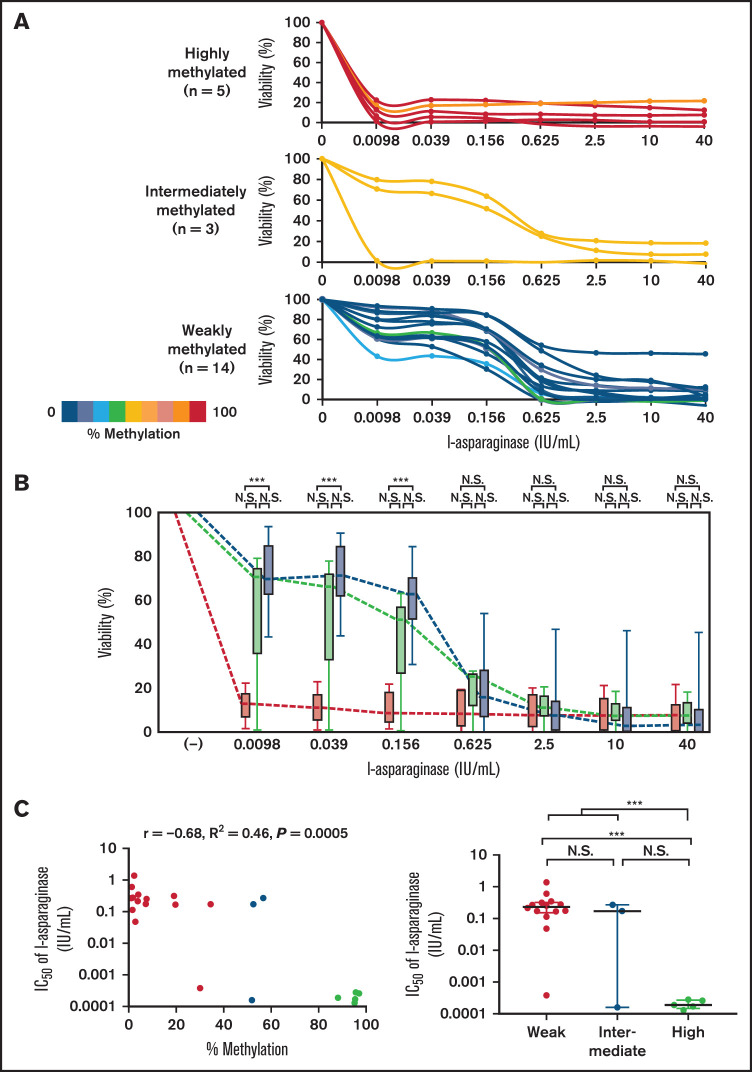
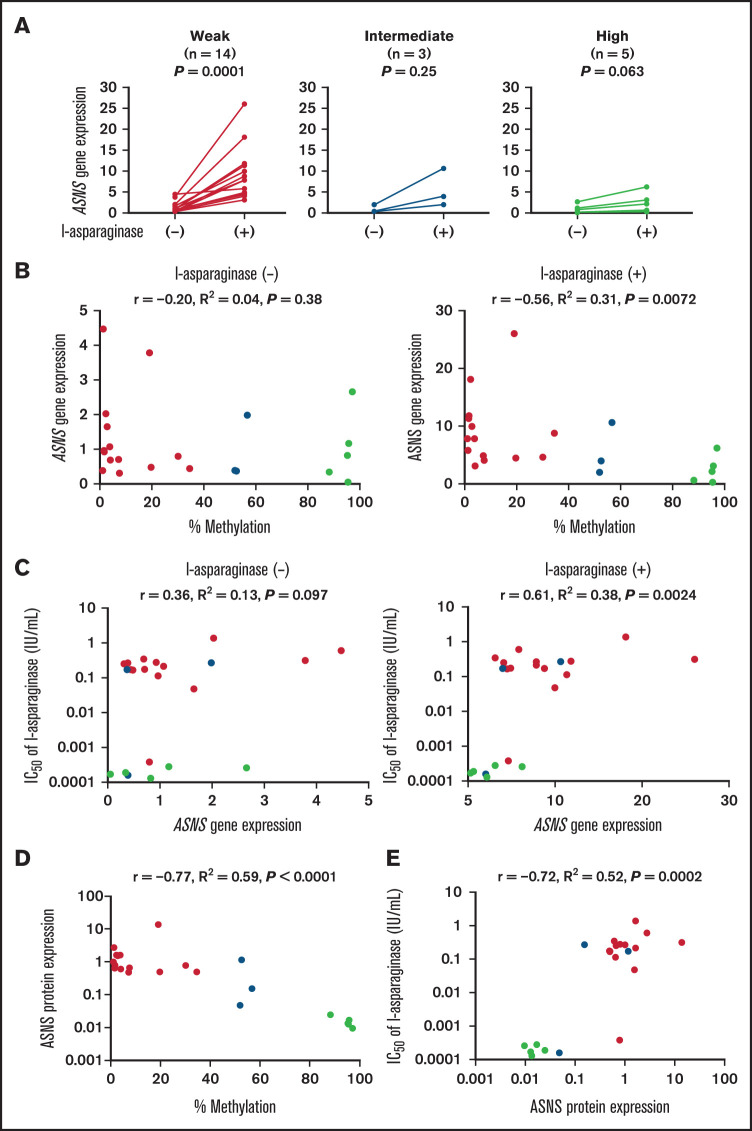
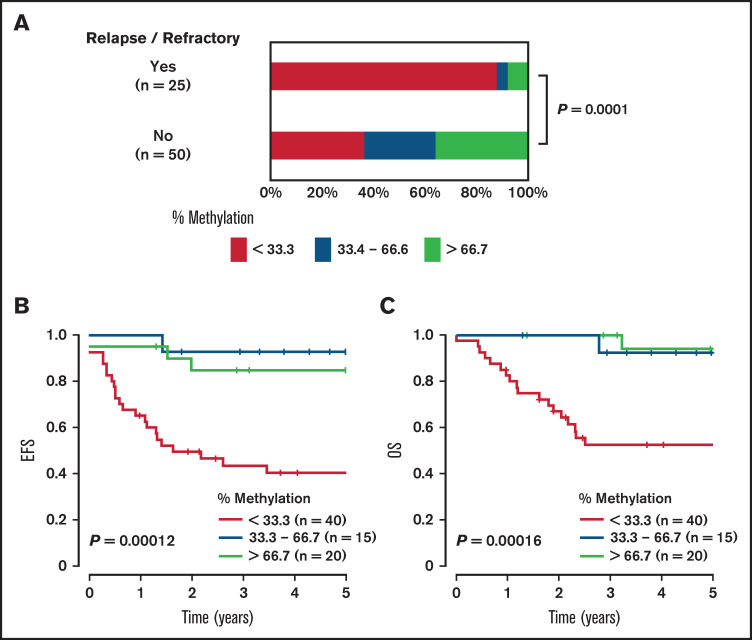
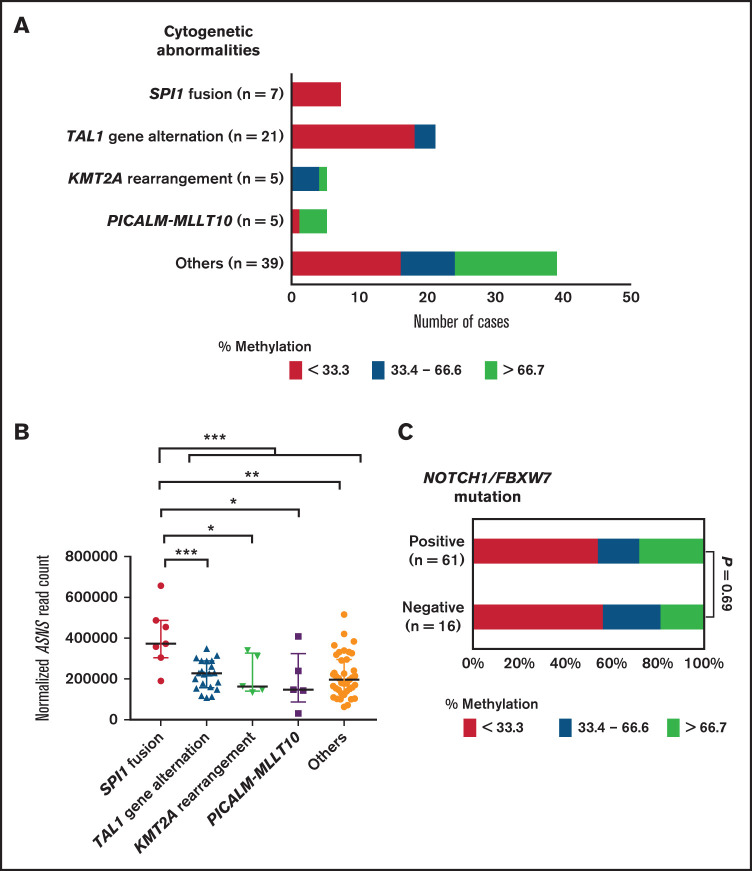
Asparaginase therapy is a key component of chemotherapy for patients with T-cell acute lymphoblastic leukemia (T-ALL). Asparaginase depletes serum asparagine by deamination into aspartic acid. Normal hematopoietic cells can survive due to asparagine synthetase (ASNS) activity, whereas leukemia cells are supposed to undergo apoptosis due to silencing of the ASNS gene. Because the ASNS gene has a typical CpG island in its promoter, its methylation status in T-ALL cells may be associated with asparaginase sensitivity. Thus, we investigated the significance of ASNS methylation status in asparaginase sensitivity of T-ALL cell lines and prognosis of childhood T-ALL. Sequencing of bisulfite polymerase chain reaction products using next-generation sequencing technology in 22 T-ALL cell lines revealed a stepwise allele-specific methylation of the ASNS gene, in association with an aberrant methylation of a 7q21 imprinted gene cluster. T-ALL cell lines with ASNS hypermethylation status showed significantly higher in vitro l-asparaginase sensitivity in association with insufficient asparaginase-induced upregulation of ASNS gene expression and lower basal ASNS protein expression. A comprehensive analysis of diagnostic samples from pediatric patients with T-ALL in Japanese cohorts (N = 77) revealed that methylation of the ASNS gene was associated with an aberrant methylation of the 7q21 imprinted gene cluster. In pediatric T-ALL patients in Japanese cohorts (n = 75), ASNS hypomethylation status was significantly associated with poor therapeutic outcome, and all cases with poor prognostic SPI1 fusion exclusively exhibited ASNS hypomethylation status. These observations show that ASNS hypomethylation status is associated with asparaginase resistance and is a poor prognostic biomarker in childhood T-ALL.


Figures

None
Graphical abstract
Figure 1.
Figure 1.
Allele-specific methylation of ASNS gene in human T-ALL cell lines. (A) A heat map of methylation status of each CG nucleotide in the CpG island of the ASNS gene in representative cell lines. (B) Mean percent methylation of the ASNS gene in 22 human T-ALL cell lines. (C) Typical histograms of ASNS gene methylation in weakly, intermediately, and highly methylated cell lines. Horizontal axes indicate percentage methylation of each NGS read; vertical axes indicate the frequency of NGS reads. (D) Methylation status of PEG10, DLX5, TAC1, and ASNS in 3 representative T-ALL cell lines with different ASNS methylation status. LOUCY is ASNS highly methylated cell line, HPB-ALL is ASNS intermediately methylated cell line, and JURKAT is ASNS weakly methylated cell line. The top panel is a schematic representation of gene configuration. The horizontal axes indicate percent methylation of each NGS read, and the vertical axes indicate frequency of reads. (E) Methylation status of eight genes at the imprinted gene cluster of 7q21 in six T-ALL cell lines. ALL-SIL and LOUCY are ASNS highly methylated cell lines, KOPT-5 and HPB-ALL are ASNS intermediately methylated cell lines, and CCRF-CEM and JURKAT are ASNS weakly methylated cell lines. The top panel is a schematic representation of gene configuration. The bottom panel is a heat map of the mean percent methylation levels of each gene in each cell line.
Figure 2.
Figure 2.
Association of ASNS methylation with l-asparaginase sensitivity in T-ALL cell lines. (A) Dose–response curves of l-asparaginase sensitivity in 22 T-ALL cell lines. The colors of the curves show percent methylation of ASNS in each cell line. (B) Dose–response curves of l-asparaginase sensitivity in 3 groups of T-ALL cell lines with different ASNS methylation status. Box plots indicate cell viabilities in ASNS highly (red), intermediately (yellow), and weakly (blue) methylated cell lines at each concentration. (C) Association of ASNS methylation with asparaginase sensitivity in T-ALL cell lines. In the left panel, the horizontal axis indicates the percent methylation of the ASNS gene and the vertical axis indicates the log IC50 value of asparaginase. The correlation coefficient and P value in the Spearman correlation test are shown. In the right panel, the log IC50 value of asparaginase is compared among ASNS highly methylated (red), intermediately methylated (yellow), and weakly methylated (blue) cell lines. Asterisks indicate significance in the Mann-Whitney U test. ***P < .001. N.S., not significant.
Figure 3.
Figure 3.
Association of ASNS methylation with ASNS gene and protein expression levels in T-ALL cell lines. (A) Induction of ASNS gene expression by asparaginase treatment in T-ALL cell lines. Each cell line was cultured in the absence or presence of 1.0 U/mL of l-asparaginase for 12 hours. ASNS gene expression level in each cell line was determined by real time RT-PCR using ACTB gene expression level as an internal control. The vertical axes indicate relative ASNS gene expression level in each cell line, which was evaluated by using P12/ICHIKAWA as a control cell line. The values were compared between untreated cells and l-asparaginase–treated cells. P values in the Wilcoxon signed-rank test are shown. (B) Association between ASNS methylation status and ASNS gene expression in T-ALL cell lines. Horizontal axes indicate percent methylation of the ASNS gene, and vertical axes indicate basal (left) and asparaginase-induced (right) ASNS gene expression level. (C) Association of ASNS gene expression with asparaginase sensitivity in T-ALL cell lines. Vertical axes indicate log IC50 value of l-asparaginase, and horizontal axes indicate basal (left) and asparaginase-induced (right) ASNS gene expression level. (D) Association between ASNS methylation status and basal ASNS protein expression in T-ALL cell lines. Horizontal axis indicates percent methylation of the ASNS gene, and vertical axis indicates ASNS protein expression level in each cell line as relative value to that in the control cell line (JURKAT). (E) Association of ASNS protein expression with asparaginase sensitivity in T-ALL cell lines. The vertical axis indicates the log IC50 value of l-asparaginase, and the horizontal axis indicates ASNS protein expression level in each cell line as relative value to that in the control cell line (JURKAT). Panels B to E: red, yellow, and blue circles represent ASNS highly, intermediately, and weakly methylated cell lines, respectively. Correlation coefficients and P values in the Spearman correlation test are shown.
Figure 4.
Figure 4.
ASNS methylation status in pediatric patients with T-ALL. (A) Correlation between methylation level of ASNS and that of 7 genes located in the 7q21 imprinted gene cluster in 77 childhood T-ALL samples of the TCCSG and JACLS cohorts (DNA Data Bank of Japan [JGAS00000000138]). The vertical axes indicate mean percent methylation of ASNS, and the horizontal axes indicate mean percent methylation of each gene. The correlation coefficients and P values in the Spearman correlation test are indicated. (B) Association of ASNS methylation status with ASNS gene expression in 77 childhood T-ALL samples of the TCCSG and JACLS cohorts. Correlation coefficient and P value in the Spearman correlation test are shown.
Figure 5.
Figure 5.
Association of ASNS methylation status with therapeutic outcome in childhood T-ALL. (A) Comparison of ASNS methylation status between refractory/relapsed cases and non-refractory/relapsed cases in childhood T-ALL. Red, yellow, and blue columns indicate ASNS highly methylated (>66.7%), intermediately methylated (33.3%-66.7%), and weakly methylated (<33.3%) cases, respectively. The P value in the χ2 test is shown. Kaplan-Meier plots of EFS (B) and OS (C) in childhood T-ALL stratified according to percent methylation of ASNS gene. The prognoses of ASNS highly methylated (>66.7%; red), intermediately methylated (33.3% -66.7%; yellow), and weakly methylated (<33.3%; blue) cases were compared. The P values in the log-rank test are shown.
Figure 6.
Figure 6.
Association of ASNS methylation status with cytogenetic abnormalities in childhood T-ALL. (A) Association of cytogenetic abnormalities with ASNS methylation status in childhood T-ALL. Red, yellow, and blue columns indicate ASNS highly methylated (>66.7%), intermediately methylated (33.3%-66.7%), and weakly methylated (<33.3%) cases, respectively. (B) Association of cytogenetic abnormalities with ASNS gene expression level in childhood T-ALL. Asterisks indicate significance in the Mann-Whitney U test. **0.001 < P < .01; *0.01 < P < .05. (C) Comparison of ASNS methylation status between childhood T-ALL cases with and without NOTCH1/FBXW7 mutations. The P value in the χ2 test is shown.

References

    1. Schrappe M, Valsecchi MG, Bartram CR, et al. . Late MRD response determines relapse risk overall and in subsets of childhood T-cell ALL: results of the AIEOP-BFM-ALL 2000 study. Blood. 2011;118(8):2077-2084. - PubMed
    1. Matloub Y, Stork L, Asselin B, et al. . Outcome of children with standard-risk T-lineage acute lymphoblastic leukemia—comparison among different treatment strategies. Pediatr Blood Cancer. 2016;63(2):255-261. - PMC - PubMed
    1. Patrick K, Vora A. Update on biology and treatment of T-cell acute lymphoblastic leukaemia. Curr Opin Pediatr. 2015;27(1):44-49. - PubMed
    1. Schrappe M, Hunger SP, Pui CH, et al. . Outcomes after induction failure in childhood acute lymphoblastic leukemia. N Engl J Med. 2012;366(15):1371-1381. - PMC - PubMed
    1. Oudot C, Auclerc MF, Levy V, et al. . Prognostic factors for leukemic induction failure in children with acute lymphoblastic leukemia and outcome after salvage therapy: the FRALLE 93 study. J Clin Oncol. 2008;26(9):1496-1503. - PubMed

Publication types

MeSH terms