. 2021 Sep 17;4(11):e202101199.
doi: 10.26508/lsa.202101199. Print 2021 Nov.

An extended DNA-free intranuclear compartment organizes centrosome microtubules in malaria parasites

Affiliations

An extended DNA-free intranuclear compartment organizes centrosome microtubules in malaria parasites

Caroline S Simon et al. Life Sci Alliance. .

Abstract

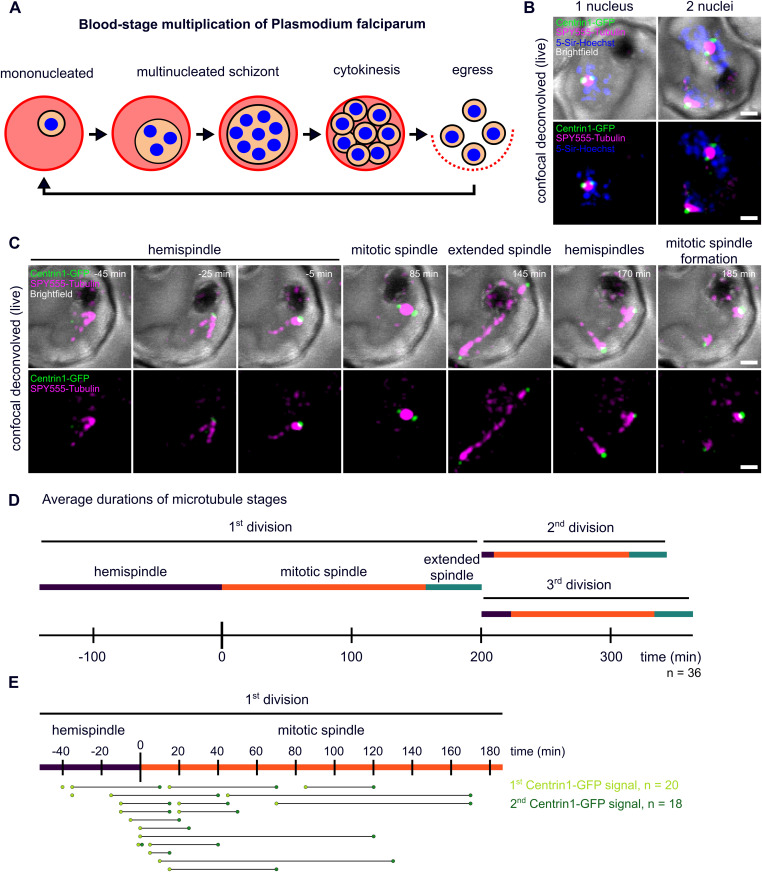
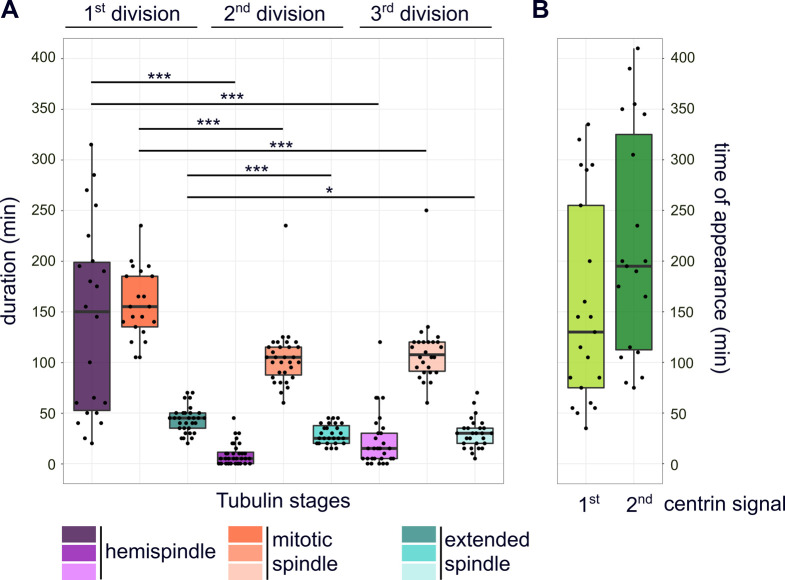
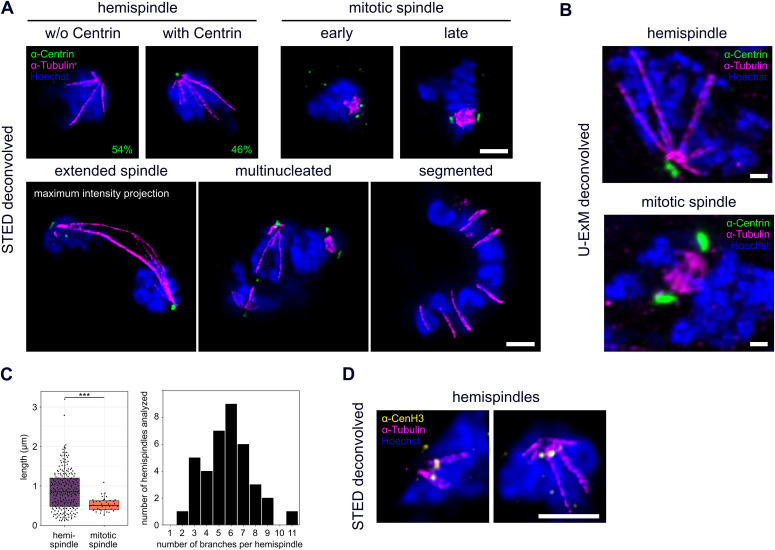
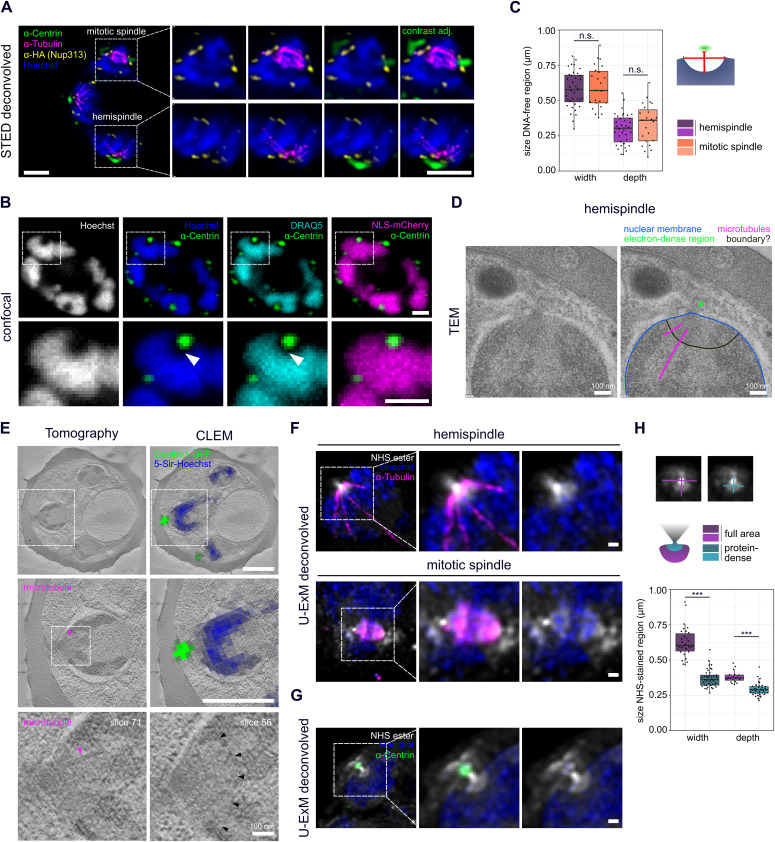
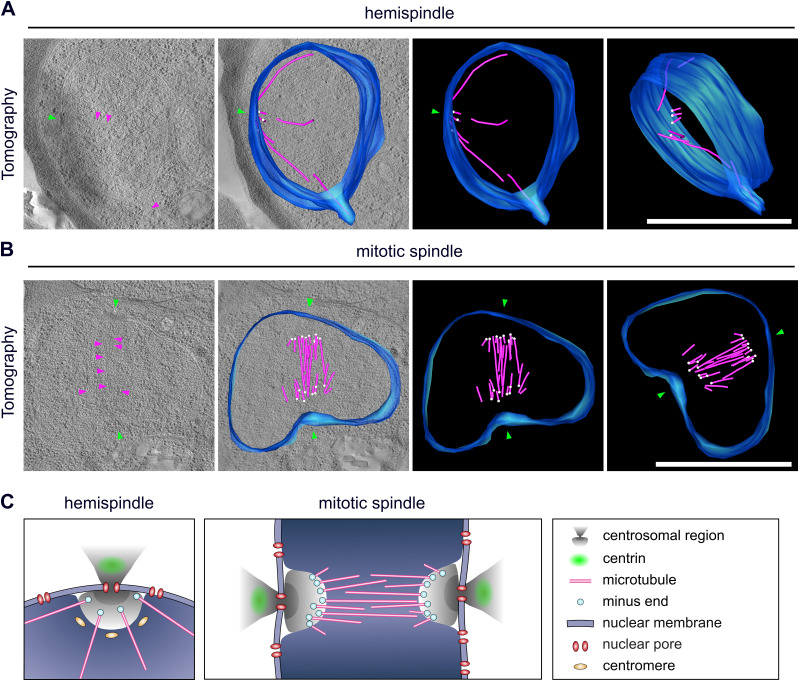
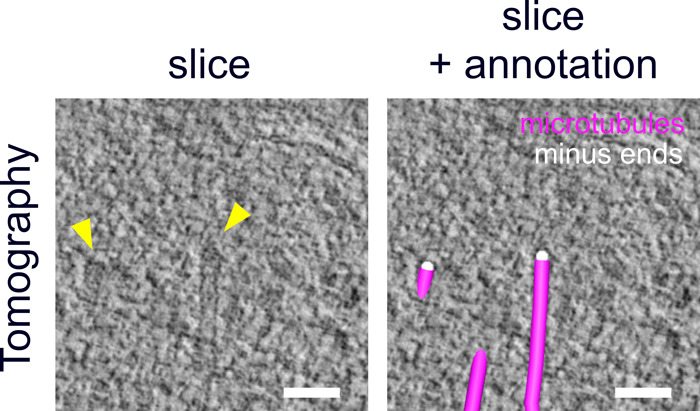
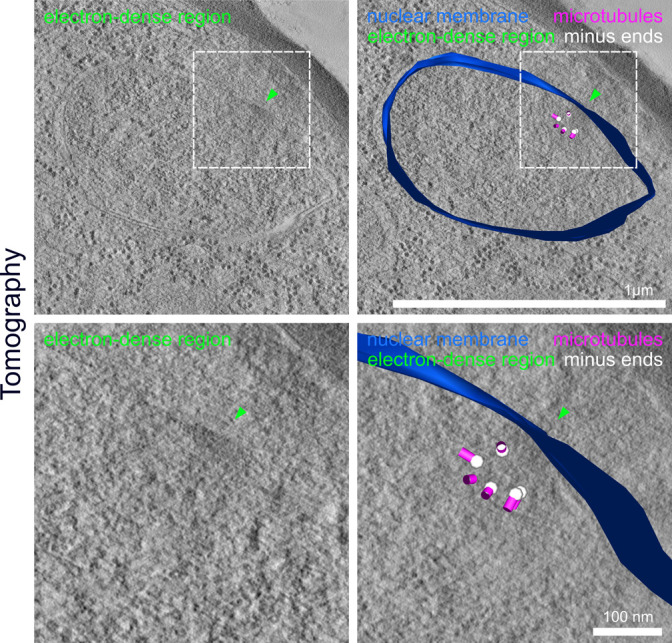
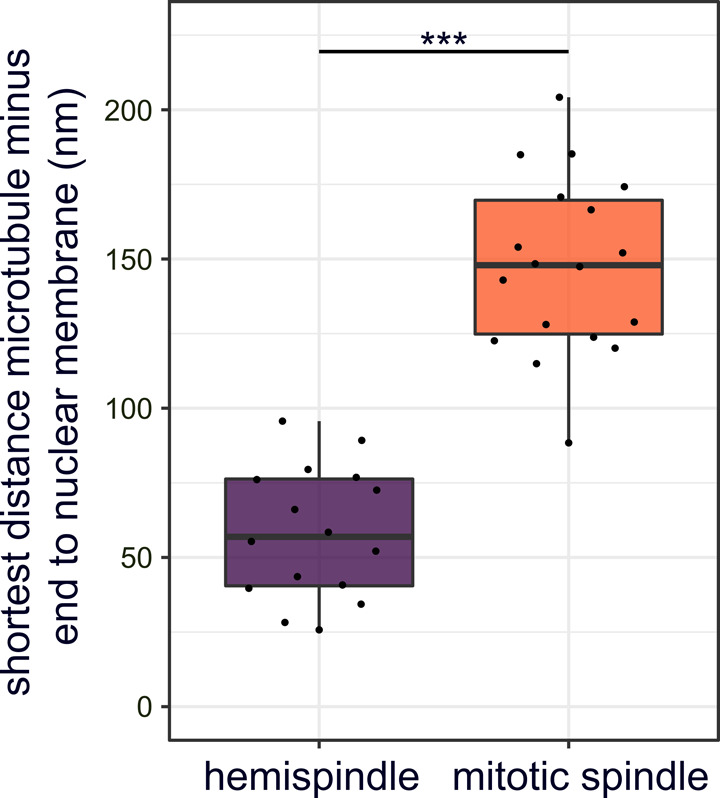
Proliferation of Plasmodium falciparum in red blood cells is the cause of malaria and is underpinned by an unconventional cell division mode, called schizogony. Contrary to model organisms, P. falciparum replicates by multiple rounds of nuclear divisions that are not interrupted by cytokinesis. Organization and dynamics of critical nuclear division factors remain poorly understood. Centriolar plaques, the centrosomes of P. falciparum, serve as microtubule organizing centers and have an acentriolar, amorphous structure. The small size of parasite nuclei has precluded detailed analysis of intranuclear microtubule organization by classical fluorescence microscopy. We apply recently developed super-resolution and time-lapse imaging protocols to describe microtubule reconfiguration during schizogony. Analysis of centrin, nuclear pore, and microtubule positioning reveals two distinct compartments of the centriolar plaque. Whereas centrin is extranuclear, we confirm by correlative light and electron tomography that microtubules are nucleated in a previously unknown and extended intranuclear compartment, which is devoid of chromatin but protein-dense. This study generates a working model for an unconventional centrosome and enables a better understanding about the diversity of eukaryotic cell division.


Conflict of interest statement

The authors declare that they have no conflict of interest.

Figures

Figure 1.
Figure 1.. Live-cell imaging of microtubule and centriolar plaque reorganization throughout schizogony.
(A) Schematic of P. falciparum blood-stage development including multiple divisions (schizogony) before cytokinesis and egress of new infectious parasites. (B) Deconvolved confocal live-cell still images of two separate Plasmodium NF54 infected red blood cells ectopically expressing PfCentrin1-GFP (green), labeled with SPY555-Tubulin (magenta) and 5-Sir-Hoechst (blue). The images are maximum intensity projections. (C) Time-lapse of a cell labeled as in (B), but without 5-Sir-Hoechst. The first spindle formation and elongation in a single parasite is shown over time. (D) Quantification of average duration of three distinct microtubule organization stages in 36 cells (acquired in three replicates). Because most movies (n = 32/36) were already started at hemispindle stages, we could only quantify the minimal mean length of the hemispindle stage for the first division. (E) Time points of appearance of first (n = 20, three replicates) and second (n = 18, three replicates) clear PfCentrin1-GFP signals normalized to the start of accumulating tubulin signal (start of mitotic spindle formation). All scale bars are 1 μm.
Figure S1.
Figure S1.. Quantification of microtubule and centrin dynamics during the first three rounds of nuclear division.
(A) Durations of subsequent microtubule organization phases, that is, hemispindle, mitotic spindle, and extended spindle stage in dividing NF54 PfCentrin1-GFP parasites (n = 36 cells, three replicates) as shown in Fig 1C. Since most movies (32/36) were already started during hemispindle phase, we quantified the minimal mean length of hemispindle stage for the first division. To test for significant differences, we used Welch ANOVA–Games–Howell test. (B) Duration from start of the movie until appearance of clear first (n = 21, three replicates) and second (n = 19, three replicates) PfCentrin1-GFP signals.
Figure S2.
Figure S2.. Generated anti-PfCentrin3 antibody specifically binds recombinant and parasite antigen.
Western blot of wild-type NF54 whole-cell lysate and purified recombinant PfCen3-6His stained with the rabbit anti-PfCentrin3 antibody. Expected antigen masses are indicated below. Contrast is adjusted differently for both lanes.
Figure 2.
Figure 2.. STED super-resolution and ultrastructure expansion microscopy reveal detailed organization of microtubules, centriolar plaques and centromeres during schizogony.
(A) Dual-color STED nanoscopy images of different schizogony stages of 3D7 parasites expressing tagged nuclear pore protein Nup313-HA_glms, labeled with anti-centrin (green), anti-tubulin (magenta) antibodies and stained with Hoechst (blue). Single slices are shown except for the extended spindle. Quantification of percentage of hemispindles in mononucleated cells with and without centrin signal was performed in 3D7 wild-type cells (n = 52 cells, 1 replicate) imaged with confocal microscopy. (B) Confocal U-ExM images of individual schizont nuclei of the 3D7 Nup313-3xHA_glms strain in hemispindle and mitotic spindle phase, labeled as in (A), except for using three instead of one anti-tubulin antibody. Maximum intensity projections are shown. (C) Quantification of lengths (n = 217, corrected by a measured expansion factor of 4.5) and number of hemispindle branches per nucleus (n = 38) and mitotic spindle lengths (n = 38) of 3D7 Nup313-3xHA_glms expressing cells imaged with U-ExM in 2 replicates. (D) Like (A) with anti-tubulin (magenta) and anti-CenH3 (yellow) showing centromere positioning in hemispindle phases. All scale bars are 1 μm.
Figure S3.
Figure S3.. Blood-stage parasites show no tubulin or centrin staining in early trophozoite stages preceding schizogony.
Dual-color STED nanoscopy images of pre-schizogony trophozoite-stage parasite of the 3D7 Nup313-3xHA_glms strain immunolabeled with anti-centrin (green), anti-tubulin (magenta) antibodies and stained with Hoechst (blue). Scale bar is 1 μm.
Figure S4.
Figure S4.. Attempt to visualize intranuclear microtubule minus ends via γ-tubulin staining.
Dual-color STED nanoscopy images of a hemispindle and a mitotic spindle stage in 3D7wt schizont nuclei labeled with anti-α-tubulin (magenta), anti-γ-tubulin (yellow) and stained with Hoechst (blue). Note that anti-γ-tubulin antibodies also partially stained hemispindle and mitotic spindle microtubules. Scale bars are 1 μm.
Figure S5.
Figure S5.. Tagging strategy of endogenous Nup313 with 3xHA and glms tag using selection linked integration.
The 3′-end of the open reading frame of the PF3D7_1446500 gene was cloned into the pSLI-TGD-HA-glms construct to allow recombination with the endogenous locus inducing expression of the Neomycin selection cassette. PCRs using indicated primers (Table S3) show successful 5′ and 3′ integration into the genome and the absence of wild-type locus after secondary selection.
Figure 3.
Figure 3.. Centriolar plaques are divided in an extranuclear centrin-containing compartment and an intranuclear DNA-free and protein-dense compartment associated with microtubules.
(A) Dual-color STED nanoscopy images of a 3D7 schizont expressing tagged nuclear pore protein Nup313-3xHA_glms, labeled with anti-HA (yellow), anti-tubulin (magenta), and overlayed with confocal images of anti-centrin (green) and Hoechst staining (blue). (B) Confocal images of a 3D7 schizont ectopically expressing 3xNLS-mCherry. Signal was enhanced with RFP-Booster-Atto594 (magenta) and cells labeled with anti-centrin (green) and with Hoechst (blue) and DRAQ5 (turquoise) to detect DNA. (C) Quantification of dimensions of the DNA-free region in 3D7wt hemispindle (n = 36) and mitotic spindle (n = 23) stages using single image slices acquired in one immunofluorescence staining. Dimensions were measured as indicated in schematic. Depth was measured from underneath the centrin signal to the deepest point of the DNA-free region. Width was measured at the widest diameter of the DNA-free region where the nuclear membrane is expected. (D) Transmission EM image of the centriolar plaque region (annotated copy on the right) in a NF54 wt schizont shows no invagination of the nuclear membrane (blue) but suggests a boundary-like structure (black) delineating an intranuclear region from which microtubules (magenta) emanate. Green arrow indicates electron-dense region likely associated with the centriolar plaque. (E) Correlative in-resin widefield fluorescence and electron tomography (CLEM) images of thick sections (300 nm) of a high-pressure frozen and embedded NF54 schizont expressing PfCentrin1-GFP (green) and stained for DNA with 5-SiR-Hoechst (blue). Same cell region containing clear PfCentrin1-GFP foci imaged by fluorescence microscopy was overlayed with an electron tomogram slice. In zoom-ins, arrows indicate a microtubule (magenta) and a boundary-like region (black) for two tomogram slices. (F) Confocal images of individual 3D7 Nup313-3xHA_glms schizont nuclei expanded with U-ExM in hemispindle and mitotic spindle phase. Proteins were labeled in bulk using an NHS-ester Atto594 dye conjugate (white). Brighter staining therefore indicates higher protein density. Cells were additionally stained with anti-tubulin (magenta) and Hoechst (blue). (G) as in (F), but cells were labeled with anti-centrin (green) instead of anti-tubulin. (H) Quantification of width and depth of the NHS conjugate-stained intranuclear region at the centriolar plaque for the full area as well as the highly protein-dense region as example image and schematic indicate. To test for significant differences, we used the Mann–Whitney U test. In total, we analyzed NHS-stained regions of 14 schizonts (one replicate).
Figure 4.
Figure 4.. Centriolar plaque microtubule nucleation sites are distinct and localize at a significant distance from the nuclear membrane.
(A) 3D electron tomograms of thick sections (200 nm) of a schizont nucleus (NF54 PfCentrin1-GFP strain) in hemispindle stage. Corresponding surface rendering of microtubules (magenta), nuclear membrane (blue), microtubule minus ends (white), and electron-dense regions in the nuclear membrane (green) associated with the potential centriolar plaque are shown. (B) as (A) for mitotic spindle stage. All scale bars are 1 μm. (C) Schematic model of centriolar plaque organization during hemispindle and mitotic spindle phase in blood-stage schizonts. Content of the DNA-free, protein-rich intranuclear region harboring microtubule nucleation sites is unknown.
Figure S6.
Figure S6.. Microtubule nucleating complex identified by minus end caps.
3D-reconstructed electron tomography images of thick sections (200 nm) of high-pressure frozen and embedded NF54 schizonts expressing PfCentrin1-GFP showing the pole of a mitotic spindle. Arrows (yellow) indicate cap-like structures marking the minus ends of two microtubules of a tomogram slice on the left. Same image with manual annotations of microtubules (magenta) and minus ends (white) on the right. Scale bars, 50 nm.
Figure S7.
Figure S7.. Intranuclear region can be surmised in some electron tomographic sections.
3D-reconstructed electron tomography images of thick sections (200 nm) of a high-pressure frozen and embedded NF54 schizont expressing PfCentrin1-GFP with zoom-ins. Arrows indicate electron-dense region (green) in the nuclear membrane likely associated with the centriolar plaque. Microtubules (magenta), minus ends (white), and the nuclear membrane (blue) were manually annotated. Scale bars are indicated in images.
Figure S8.
Figure S8.. Minus ends of intranuclear microtubules localize at a significant distance from the nuclear envelope.
Quantification of shortest distance between nuclear envelope and minus ends annotated in 3D-reconstructed electron tomography images of a mitotic spindle (n = 1 cell; 18 minus ends; Fig 4B) or hemispindles (n = 4 cells; 16 minus ends; Figs S7 and 4A) of NF54 PfCentrin1-GFP cells. Unpaired t test indicates a significant difference.

Comment in

References

    1. Ader NR, Kukulski W (2017) triCLEM: Combining high-precision, room temperature CLEM with cryo-fluorescence microscopy to identify very rare events. Methods Cell Biol 140: 303–320. 10.1016/bs.mcb.2017.03.009 - DOI - PubMed
    1. Aikawa M, Beaudoin RL (1968) Studies on nuclear division of a malarial parasite under pyrimethamine treatment. J Cell Biol 39: 749–754. 10.1083/jcb.39.3.749 - DOI - PMC - PubMed
    1. Aikawa M, Huff CG, Sprinz H (1967) Fine structure of the asexual stages of Plasmodium elongatum. J Cell Biol 34: 229–249. 10.1083/jcb.34.1.229 - DOI - PMC - PubMed
    1. Arnot DE, Ronander E, Bengtsson DC (2011) The progression of the intra-erythrocytic cell cycle of Plasmodium falciparum and the role of the centriolar plaques in asynchronous mitotic division during schizogony. Int J Parasitol 41: 71–80. 10.1016/j.ijpara.2010.07.012 - DOI - PubMed
    1. Azimzadeh J, Bornens M (2007) Structure and duplication of the centrosome. J Cell Sci 120: 2139–2142. 10.1242/jcs.005231 - DOI - PubMed

Publication types

LinkOut - more resources