. 2021 Sep 17;12(10):854.
doi: 10.1038/s41419-021-04138-0.

Alpha-Synuclein defects autophagy by impairing SNAP29-mediated autophagosome-lysosome fusion

Affiliations

Alpha-Synuclein defects autophagy by impairing SNAP29-mediated autophagosome-lysosome fusion

Qilin Tang et al. Cell Death Dis. .

Abstract

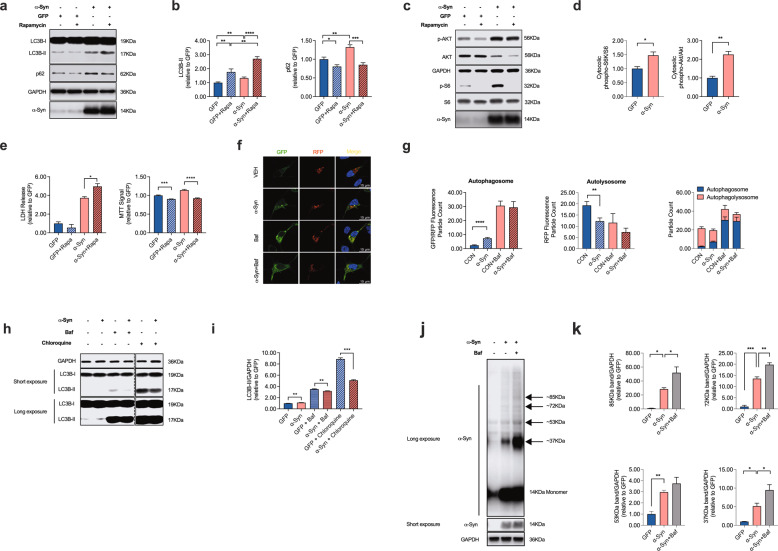
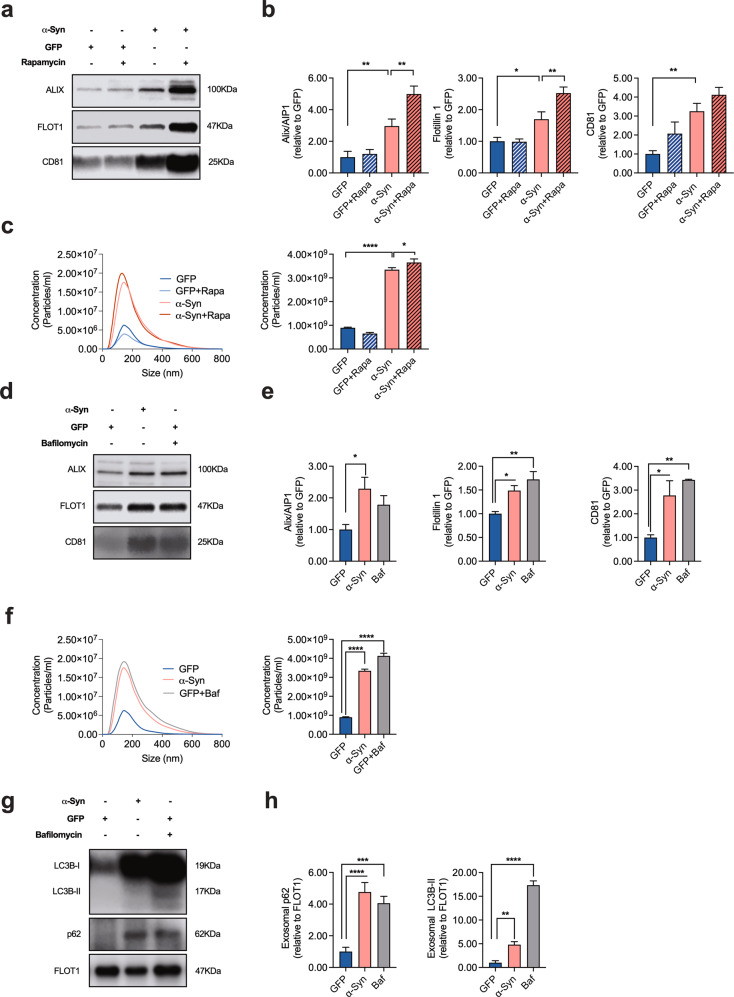
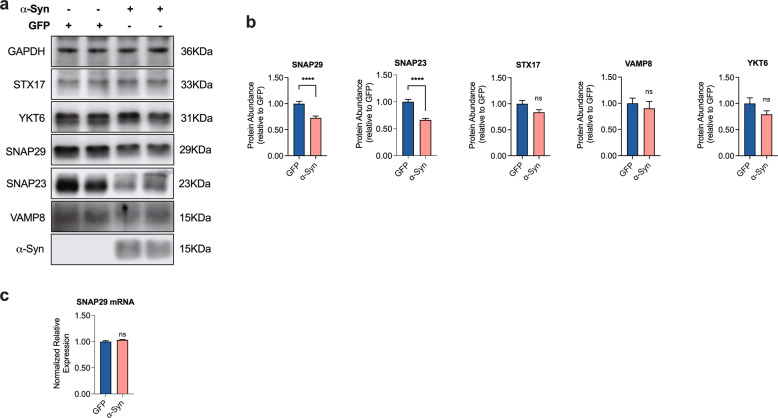
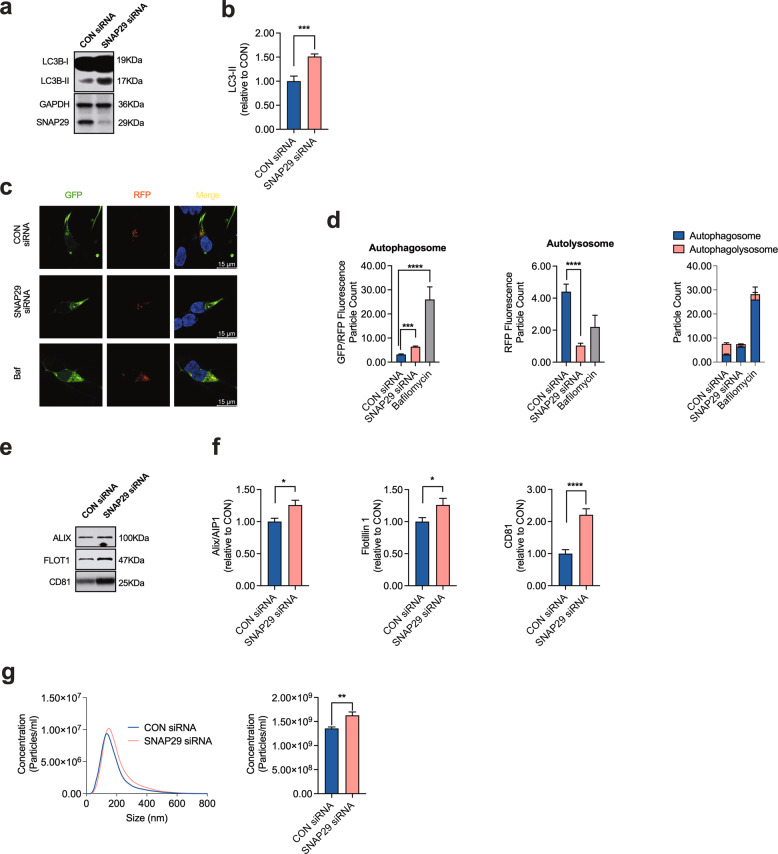
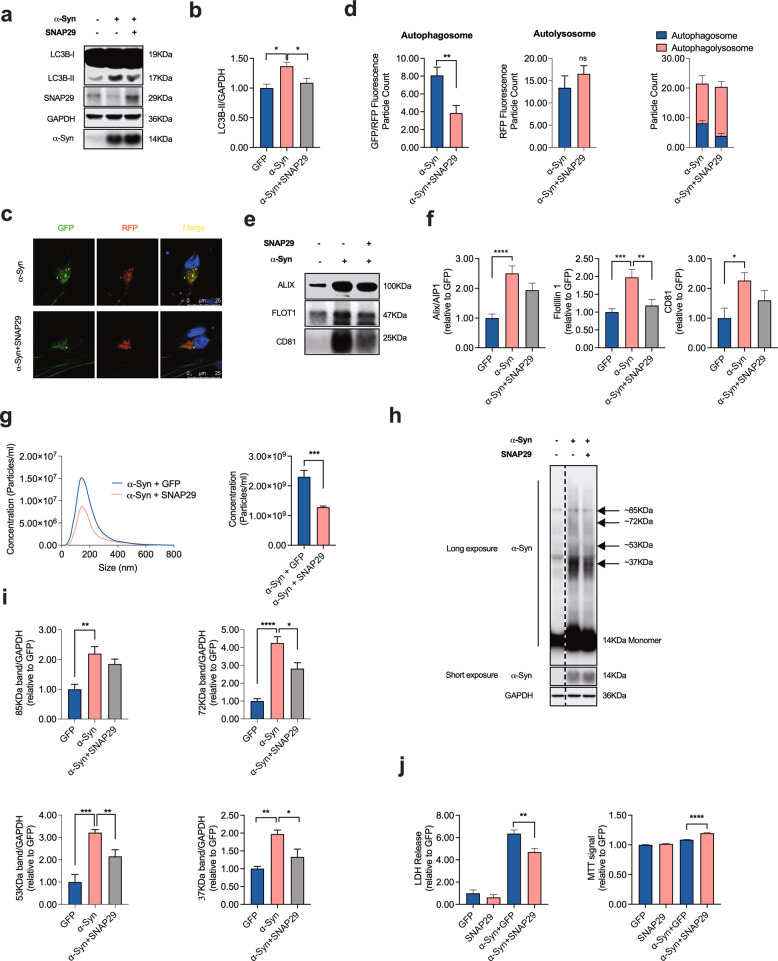
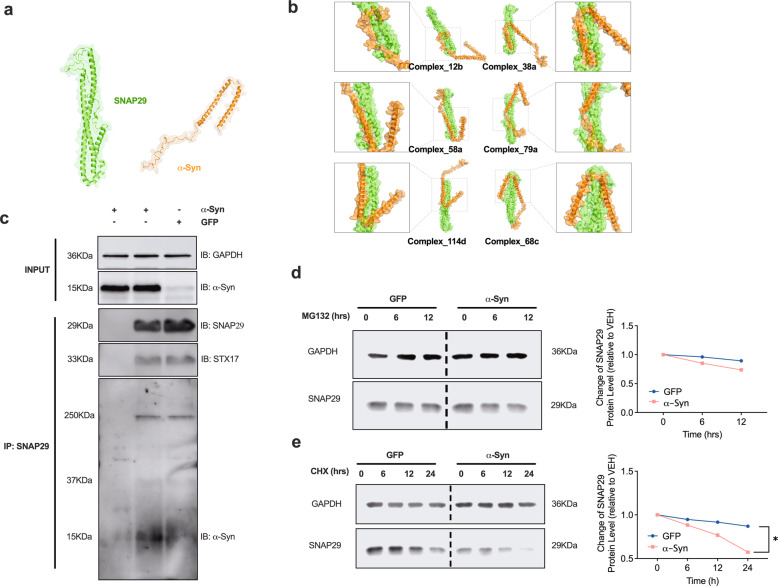
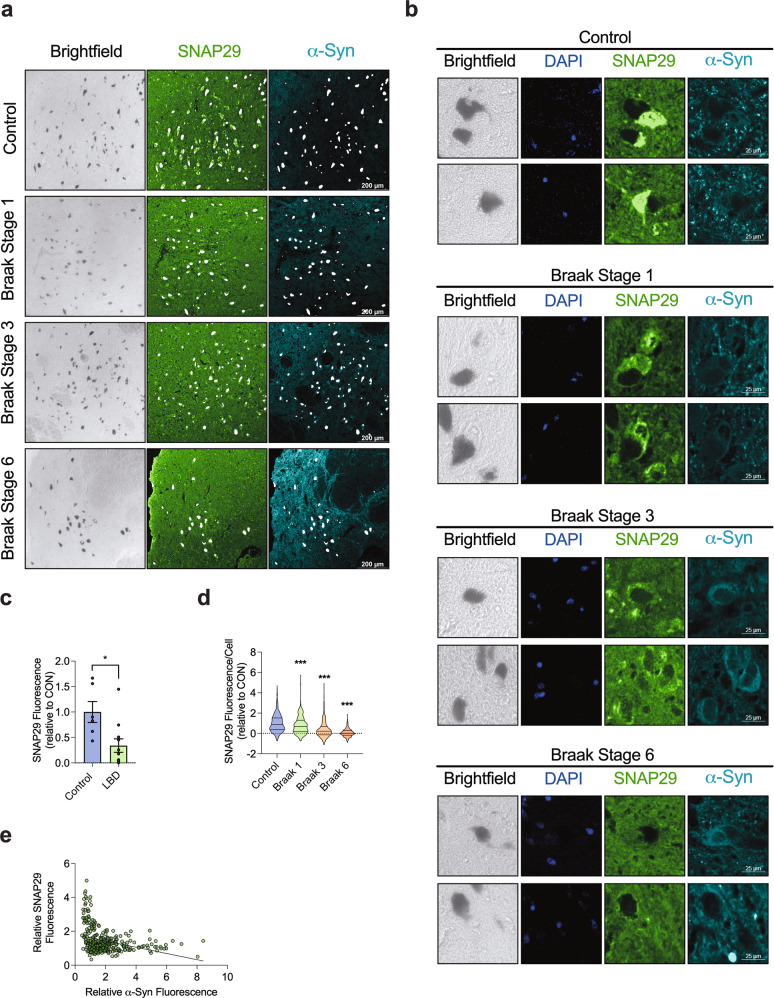
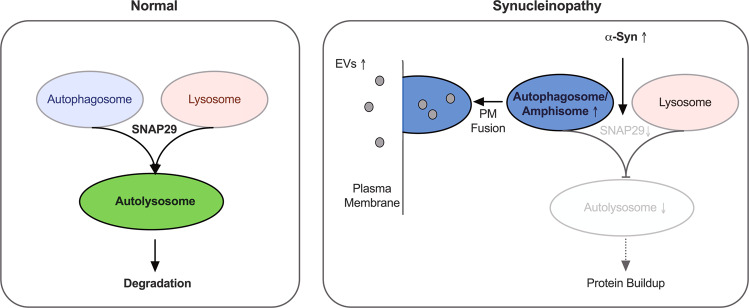
Dopaminergic (DA) cell death in Parkinson's disease (PD) is associated with the gradual appearance of neuronal protein aggregates termed Lewy bodies (LBs) that are comprised of vesicular membrane structures and dysmorphic organelles in conjunction with the protein alpha-Synuclein (α-Syn). Although the exact mechanism of neuronal aggregate formation and death remains elusive, recent research suggests α-Syn-mediated alterations in the lysosomal degradation of aggregated proteins and organelles - a process termed autophagy. Here, we used a combination of molecular biology and immunochemistry to investigate the effect of α-Syn on autophagy turnover in cultured human DA neurons and in human post-mortem brain tissue. We found α-Syn overexpression to reduce autophagy turnover by compromising the fusion of autophagosomes with lysosomes, thus leading to a decrease in the formation of autolysosomes. In accord with a compensatory increase in the plasma membrane fusion of autophagosomes, α-Syn enhanced the number of extracellular vesicles (EV) and the abundance of autophagy-associated proteins in these EVs. Mechanistically, α-Syn decreased the abundance of the v-SNARE protein SNAP29, a member of the SNARE complex mediating autophagolysosome fusion. In line, SNAP29 knockdown mimicked the effect of α-Syn on autophagy whereas SNAP29 co-expression reversed the α-Syn-induced changes on autophagy turnover and EV release and ameliorated DA neuronal cell death. In accord with our results from cultured neurons, we found a stage-dependent reduction of SNAP29 in SNc DA neurons from human post-mortem brain tissue of Lewy body pathology (LBP) cases. In summary, our results thus demonstrate a previously unknown effect of α-Syn on intracellular autophagy-associated SNARE proteins and, as a consequence, a reduced autolysosome fusion. As such, our findings will therefore support the investigation of autophagy-associated pathological changes in PD.


Conflict of interest statement

The authors declare no competing interests.

Figures

Fig. 1
Fig. 1. α-Syn overexpression attenuates autophagy turnover.
a, b Western blot and bar graphs illustrating the abundance of sequestome-1/p62 and LC3B-I and -II in response to α-Syn overexpression and in response to treatment with rapamycin (100 nM; 24 h; n = 10/condition). c, d Western blot and bar graphs illustrating the abundance and phosphorylation of mTOR associated signaling molecules (Akt; S6) in response to α-Syn overexpression and in response to treatment with rapamycin (100 nM; 24 h; n = 3/condition). e Bar graphs illustrating the quantification of LDH in the culture medium (left) and the MTT signal (right) in response to α-Syn overexpression or to treatment with rapamycin (100 nM; 24 h; n = 4/condition). f Photomicrographs from confocal microscopy of neurons transduced with GFP-RFP-LC3B and either co-transfected with vehicle (VEH), α-Syn or treated with bafilomycin A1 (Baf; 100 nM; 8 h; for VEH n = 25 cells, for α-Syn n = 26 cells, for Baf n = 5 cells, and for Baf+α-Syn n = 5 cells) g Bar graphs illustrating the count of fluorescence positive particles. α-Syn and Baf both lead to a significant increase in GFP/RFP fluorescence positive particles (left graph), whereas RFP-fluorescence positive particles was decreased (middle graph). The ratio of GFP/RFP double-positive autophagosomes to RFP-positive autolysosomes is decreased in response to α-Syn and Baf (right graph). h, i Western blot and bar graphs illustrating the increased abundance of LC3B-II in response to Baf (100 nM; 8 h; n = 7/condition) or CQ (50 μM, 24 h; n = 7/condition). j Western blot illustrating the abundance of monomeric and oligomeric α-Syn in response to treatment with Baf (100 nM; 8 h; n = 3/condition). k Bar graphs depicting the abundance of specific oligomeric α-Syn bands (at 37, 53, 72, 85 kDa) in response to α-Syn, Baf, and both. For comparison of the means, a two-tailed unpaired t-test was used in panel b, d, g, i; a one-way ANOVA with Šidák’s test for multiple comparisons was used in panel e. ****P < 0.0001, ***P < 0.005, **P < 0.01, *P < 0.05. Data are shown as means ± SEM.
Fig. 2
Fig. 2. α-Syn overexpression results in an increased release of EVs.
a, b Western blot and bar graphs illustrating the abundance of the EV-associated proteins Alix/AIP1, Flotillin-1, and CD81 in EV-enriched medium pellets from cultured cells in response to α-Syn overexpression and in response to treatment with rapamycin (100 nM; 24 h; n = 9/condition). c Results from Nanoparticle Tracking Analysis (NTA) illustrating an increased amount of EVs in response to α-Syn overexpression or to treatment with rapamycin (100 nM; 24 h; n = 9/condition). d, e Western blot and bar graphs illustrating the increased abundance of the EV-associated proteins Alix/AIP1, Flotillin-1, and CD81 in EV-enriched medium pellets from cells in response to α-Syn overexpression and in response to treatment with Baf (100 nM; 8 h; n = 3/condition). f Results from NTA illustrating an increased amount of EVs in response to α-Syn overexpression or to treatment with Baf (100 nM; 8 h; n = 9/condition). g, h Western blot and bar graphs illustrating the increased abundance of LC3B-I, -II, and p62 in EV-enriched medium pellets from α-Syn-transduced or Baf-treated cells. Note that a similar amount of total protein (i.e. a comparable total number of EVs) has been loaded on each lane. The result thus represents the relative content of LC3B and p62 per vesicle. For comparison of the means, a one-way ANOVA with Šidák’s test for multiple comparisons was used in panel b, c, e, f, h ****P < 0.0001, ***P < 0.005, **P < 0.01, *P < 0.05. Data are shown as means ± SEM.
Fig. 3
Fig. 3. α-Syn overexpression reduces the abundance of SNAP29 in cultured human DA neurons.
a, b Western blot and bar graphs illustrating the SNARE proteins STX17, YKT6, VAMP8, SNAP29, and SNAP23 in α-Syn- and GFP-transduced neurons. α-Syn overexpression specifically leads to a decreased protein abundance of the SNAP25 family members SNAP23 and SNAP29, whereas the other SNARE proteins remain unchanged (n = 6/condition, n = 11 for SNAP29). c Bar graph showing similar levels of SNAP29 mRNA expression in α-Syn-transduced neurons as compared to GFP-transduced cells (n = 3/condition). For comparison of the means, a two-tailed unpaired t-test was used in b, c; ****P < 0.0001; Data are shown as means ± SEM.
Fig. 4
Fig. 4. Knocking down SNAP29 mimics the effect of α-Syn on autophagy turnover.
a, b Western blot and bar graphs illustrating an increased abundance of LC3B-II in response to transfection with SNAP29 siRNAs (30 nM; n = 4/condition). c Photomicrographs from confocal microscopy of neurons transduced with GFP-RFP-LC3B and either co-transfected with SNAP29 or control (scrambled) siRNAs or treated with Baf (for CON siRNA n = 120 cells, for SNAP29 siRNA n = 123 cells, for Baf n = 5 cells). d Bar graphs illustrating the count of fluorescence positive particles. SNAP29 siRNA led to a significant decrease in RFP fluorescence positive particles (middle graph), whereas GFP/RFP-fluorescence positive particles remained unchanged (left graph). The ratio of GFP/RFP double-positive autophagosomes to RFP-positive autolysosomes is decreased in response to SNAP29 siRNA transfection. e, f Western blot and bar graphs illustrating the increased abundance of the EV-associated proteins Alix/AIP1, Flotillin-1, and CD81 in EV-enriched medium pellets from cells in response to SNAP29 knockdown (n = 9/condition). g Results from NTA illustrating an increased amount of EVs in response to transfecting cells with SNAP29 siRNAs (n = 9/condition). For comparison of the means, a two-tailed unpaired t-test was used in panel b, f, g; a one-way ANOVA with Šidák’s test for multiple comparisons was used in panel d. ****P < 0.0001, ***P < 0.005, **P < 0.01, *P < 0.05. Data are shown as means ± SEM.
Fig. 5
Fig. 5. SNAP29 co-expression rescues the α-Syn-induced impairment of autophagy turnover.
a, b Western blot and bar graph illustrating a decreased abundance of LC3B-II in α-Syn overexpressing cells in response to transfection with SNAP29 (n = 9/condition). c Photomicrographs from confocal microscopy of neurons transduced with GFP-RFP-LC3B, α-Syn and either with SNAP29 or vehicle (VEH). d Bar graphs illustrating the count of fluorescence positive particles. SNAP29 co-expression led to a significant decrease in GFP/RFP fluorescence positive particles (left graph), whereas RFP-fluorescence positive particles remained unchanged (middle graph). The ratio of GFP/RFP double-positive autophagosomes to RFP-positive autolysosomes is increased in response to SNAP29 transduction (for α-Syn n = 25 cells, for α-Syn + SNAP29 n = 28 cells). e, f Western blot and bar graphs illustrating the decreased abundance of the EV-associated proteins Alix/AIP1, Flotillin-1, and CD81 in EV-enriched medium pellets from cells in response to SNAP29 co-expression (n = 9/condition). g Results from NTA illustrating a decreased amount of EVs in response to co-transducing cells with SNAP29 (n = 9/condition). h, i Western blot and bar graphs illustrating the abundance of monomeric and oligomeric α-Syn in response to SNAP29 co-expression (n = 3/condition). j Bar graphs illustrating the quantification of LDH in the culture medium (left) and the MTT signal (right) in response to α-Syn and SNAP29 expression (n = 8/condition). For comparison of the means, a two-tailed unpaired t-test was used in panel d, g; a one-way ANOVA with Šidák’s test for multiple comparisons was used in panel b, f, i, j. ****P < 0.0001, ***P < 0.005, **P < 0.01, *P < 0.05. Data are shown as means ± SEM.
Fig. 6
Fig. 6. Computational modeling and Co-IP suggest a physical interaction between α-Syn and SNAP29 in cultured neurons.
a Schematic illustrating the computationally modeled tertiary structure of SNAP29 and α-Syn. b Schematic illustrating potential biding sites and complexes between SNAP29 and α-Syn. c Western blot illustrating the result of a Co-IP with SNAP29 as a bait. Reacting the membrane with an antibody against α-Syn revealed a clearly visible band in α-Syn-transduced neurons at around 15 kDa. The left lane represents a negative control (no SNAP29 antibody during IP). Representative result from 3 independent experiments. d Western blot and graph illustrating the change in SNAP29 protein levels in response to treatment (6 or 12 h) with the proteasome inhibitor MG132 (100 nM). E Western blot and bar graph illustrating the change in SNAP29 during treatment with the protein synthesis inhibitor cycloheximide (CHX; 100 μg/ml). Note the reduced half-life of SNAP29 in the presence of CHX. For comparison of the means, a two-tailed unpaired t-test was used in panel d, e; *P < 0.05. Data are shown as means ± SEM.
Fig. 7
Fig. 7. The abundance of SNAP29 is stage-dependently decreased in neuromelanin-positive neurons from LBP cases.
a Representative photomicrograph from immunohistochemical staining of SNc post-mortem brain tissue at a low magnification (bar: 200 μm). Bright field images indicate neuromelanin pigment (black) in SNc DA neurons. Tissue sections were stained with an antibody against SNAP29 (green) and human α-Syn (blue), revealing a cytoplasmic staining pattern for SNAP29 in neuromelanin-positive neurons. 1st row: pictures from a control case, that had no LBP, 2nd to 4th row: pictures from cases that has LBP at different Braak stages. b Representative photomicrograph from immunohistochemical staining of SNc post-mortem brain tissue at a high magnification (bar: 25 μm) from healthy control cases (1st row) and from cases that has LBP at different Braak stages (2nd to 4th row). Tissue sections were stained with an antibody against SNAP29 (green), revealing a cytoplasmic staining pattern for SNAP29 in neuromelanin-positive neurons. Note a stage-dependent decrease of cytoplasmic SNAP29 fluorescence in LBP, whereas control neurons show a clear cytoplasmic SNAP29 fluorescence signal. c Bar graph illustrating the average abundance of SNAP29 in LBP cases including all Braak stages (1–6). The average fluorescence signal was analyzed per case (n of cases per condition; control: n = 6; Braak stage 1: n = 3; Braak stage 3: n = 2; and Braak stage 6 n = 6) d Bar graph illustrating a drop of SNAP29 in LBP cases. Different from c, the fluorescence signal was analyzed and computed in each neuromelanin-positive cell individually (n of cells per condition; control: n = 679; Braak stage 1: n = 440; Braak stage 3: n = 381; and Braak stage 6 n = 612), demonstrating a stage-dependent decline of SNAP29 fluorescence in SNc DA neurons of LBP cases. e Graph illustrating the correlation of the SNAP29 and α-Syn fluorescence signal in individual SNc neurons (n = 352 cells). For comparison of the means, a two-tailed unpaired t-test was used in panel c; a one-way ANOVA with Šidák’s test for multiple comparisons was used in panel d. A linear regression was calculated in panel e. ***P < 0.005, *P < 0.05. Data are shown as means ± SEM.
Fig. 8
Fig. 8. α-Syn impairs autophagosome–lysosome fusion through SNAP29.
Graphic summarizing the effect of α-Syn on autophagy turnover. α-Syn overexpression leads to a decreased abundance of SNAP29 which results in an attenuated fusion of autophagosomes with lysosomes. As a result, less autolysosomes are formed and the degradation of cellular materials may be impaired. In order to compensate for a reduced autophagic flux, autophagosomes fuse with the plasma membrane (PM) to release EVs into the extracellular space.

References

    1. Park H, Kang J-H, Lee S. Autophagy in neurodegenerative diseases: a hunter for aggregates. Int J Mol Sci. 2020;21:3369. - PMC - PubMed
    1. Berg TO, Fengsrud M, Strømhaug PE, Berg T, Seglen PO. Isolation and characterization of rat liver amphisomes: evidence for fusion of autophagosomes with both early and late endosomes. J Biol Chem. 1998;273:21883–92. - PubMed
    1. Kim J, Kundu M, Viollet B, Guan K-L. AMPK and mTOR regulate autophagy through direct phosphorylation of Ulk1. Nat Cell Biol. 2011;13:132–41. - PMC - PubMed
    1. Cardoso CM, Groth-Pedersen L, Høyer-Hansen M, Kirkegaard T, Corcelle E, Andersen JS, et al. Depletion of kinesin 5B affects lysosomal distribution and stability and induces peri-nuclear accumulation of autophagosomes in cancer cells. PLoS ONE. 2009;4:e4424. - PMC - PubMed
    1. Tian X, Teng J, Chen J. New insights regarding SNARE proteins in autophagosome-lysosome fusion. Autophagy. 2020;1–9. - PMC - PubMed

Publication types

MeSH terms