. 2021 Sep 17;12(1):5507.
doi: 10.1038/s41467-021-25540-4.

Adipocytes disrupt the translational programme of acute lymphoblastic leukaemia to favour tumour survival and persistence

Affiliations

Adipocytes disrupt the translational programme of acute lymphoblastic leukaemia to favour tumour survival and persistence

Q Heydt et al. Nat Commun. .

Abstract

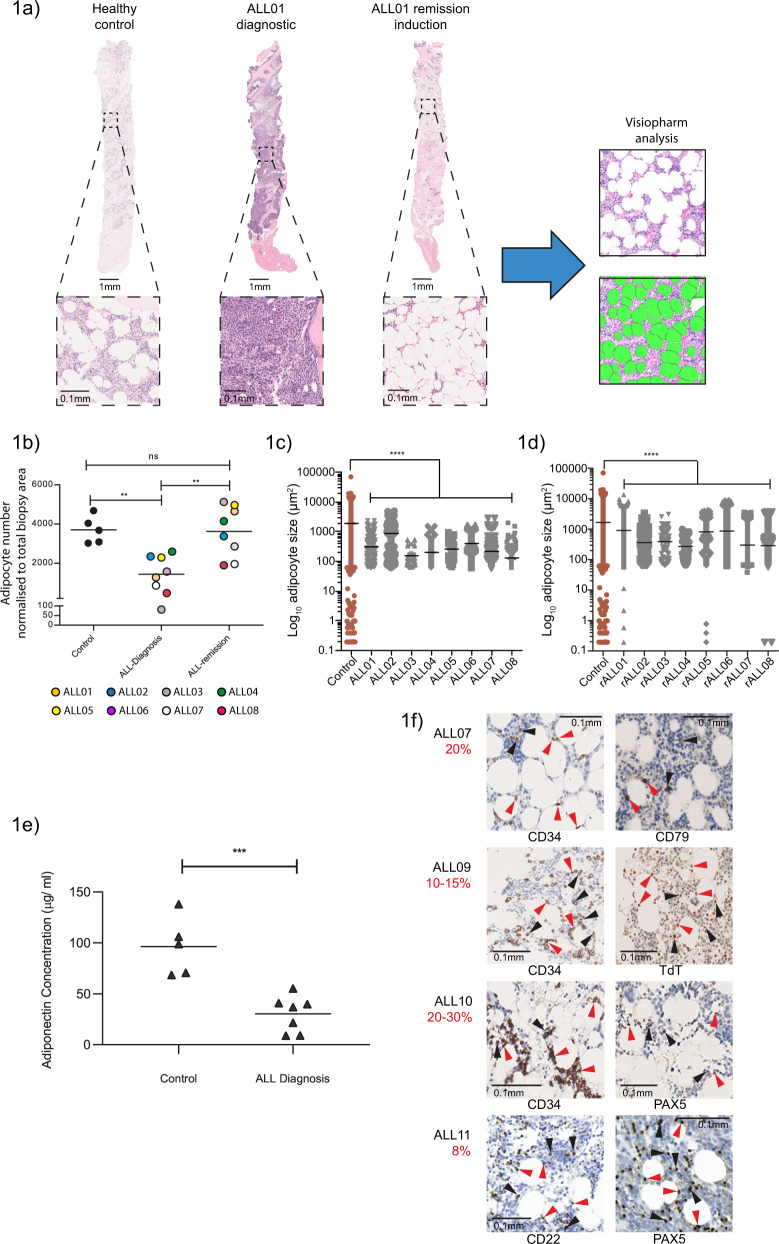
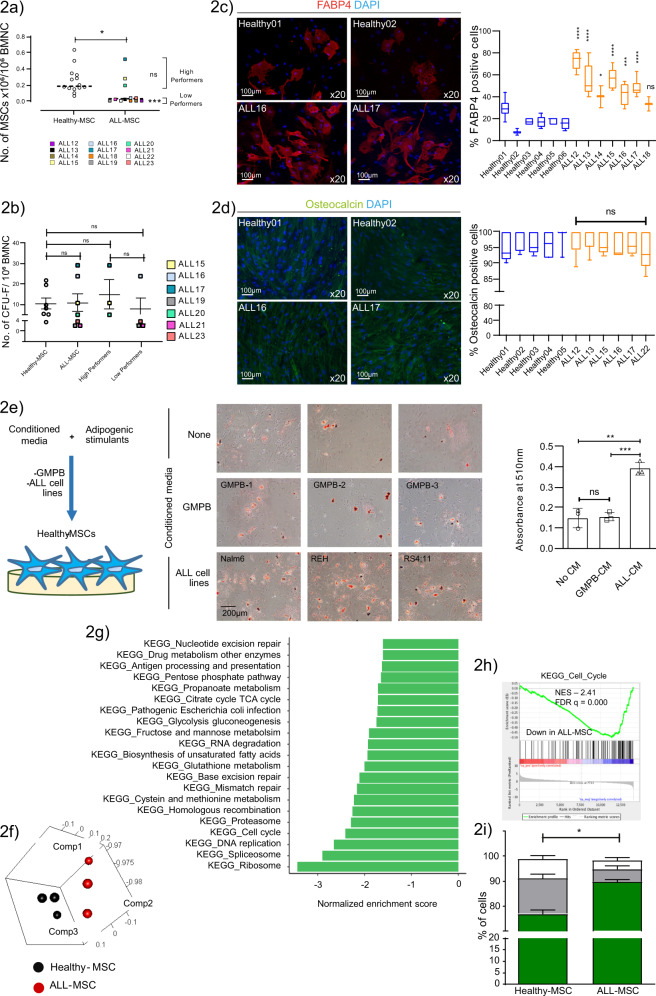
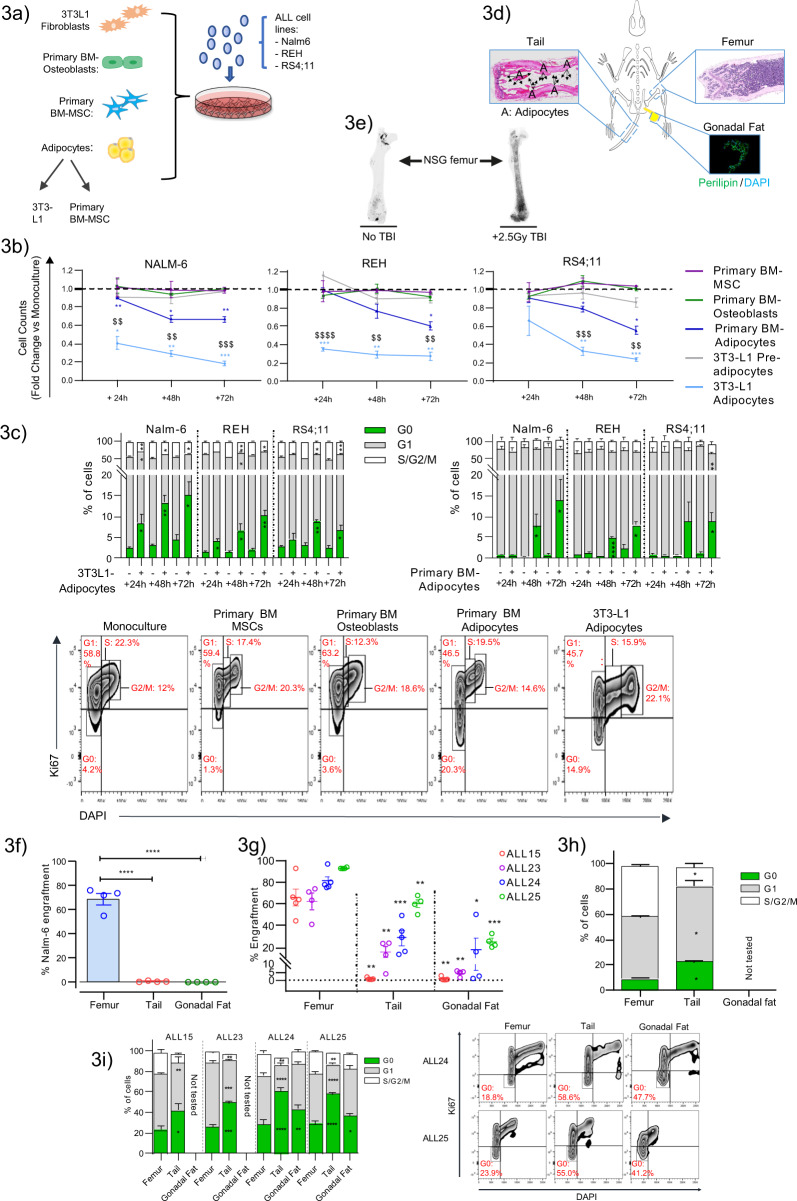
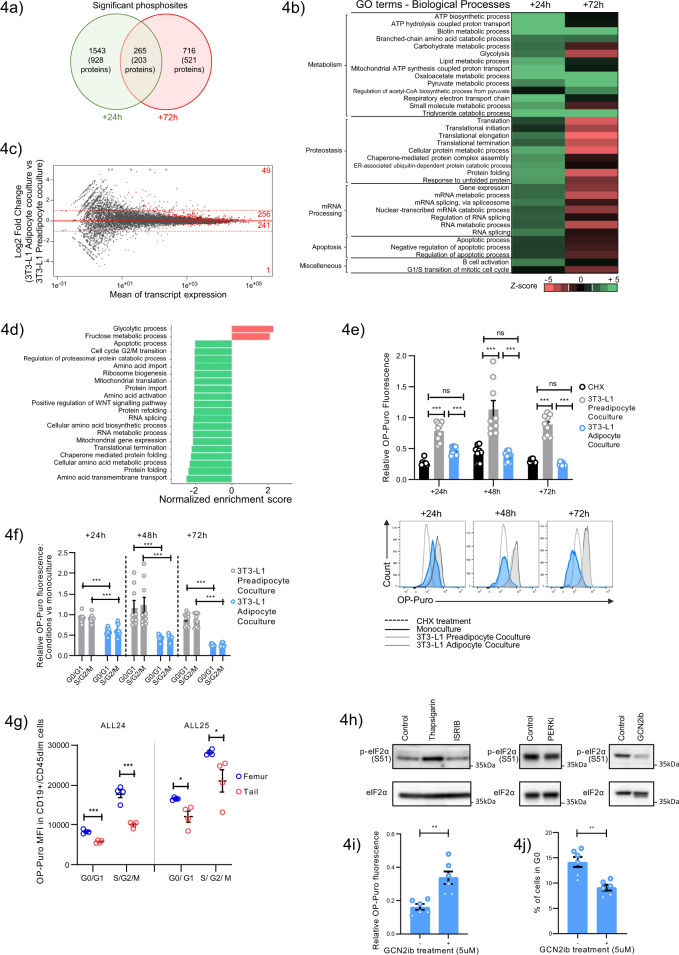
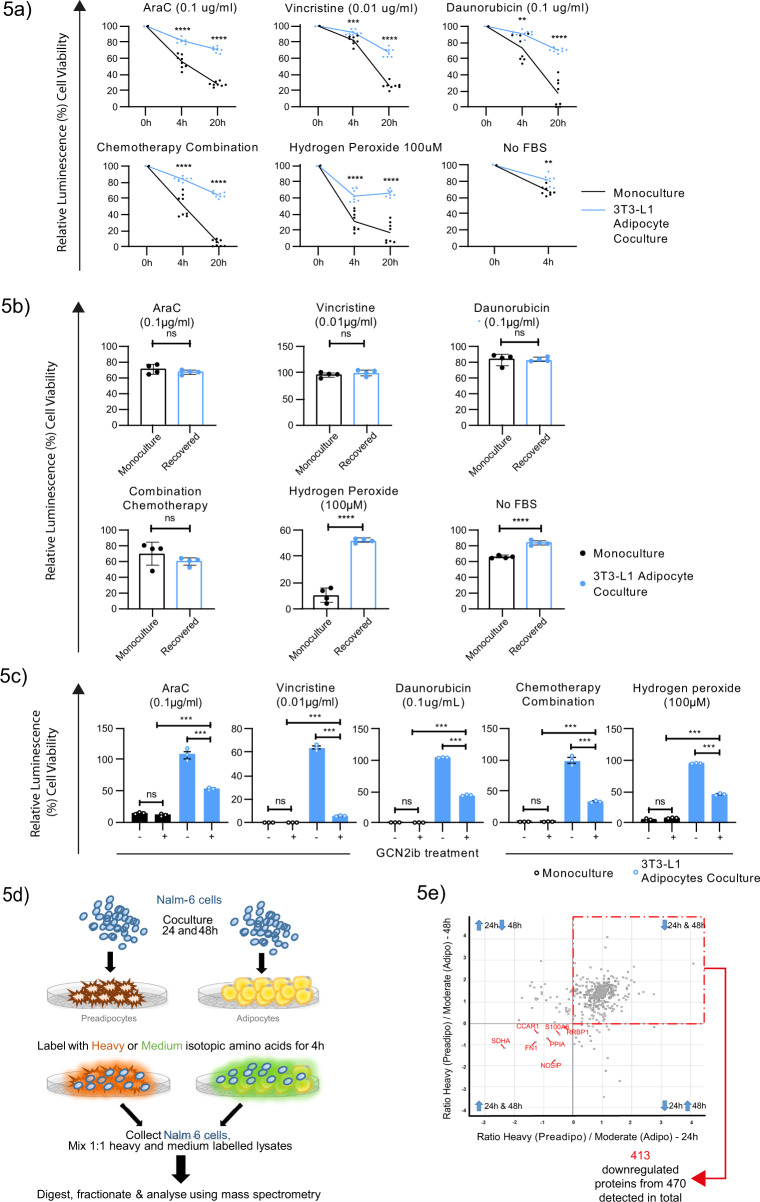
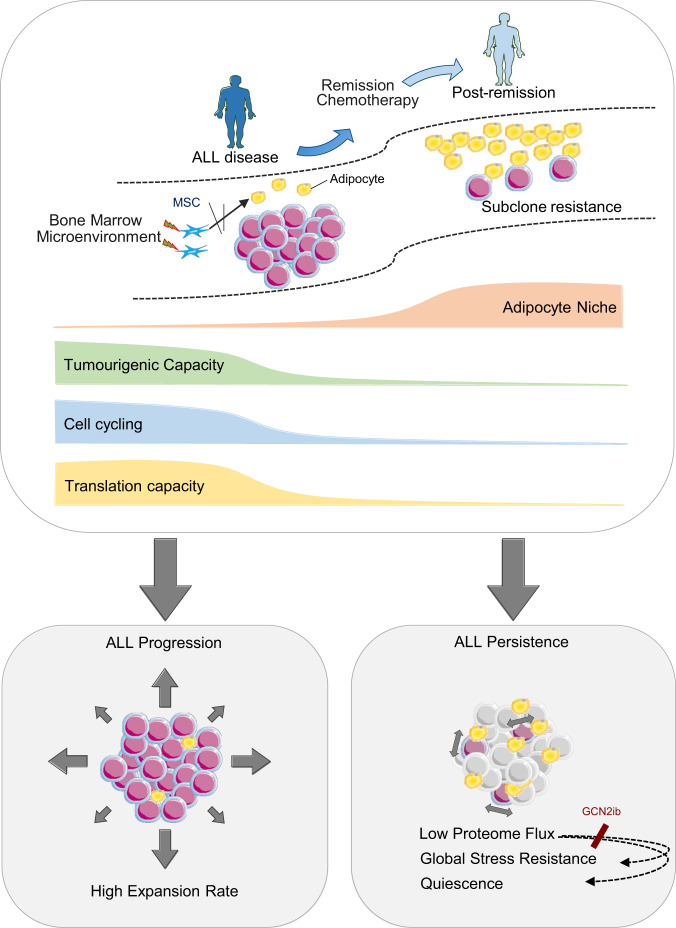
The specific niche adaptations that facilitate primary disease and Acute Lymphoblastic Leukaemia (ALL) survival after induction chemotherapy remain unclear. Here, we show that Bone Marrow (BM) adipocytes dynamically evolve during ALL pathogenesis and therapy, transitioning from cellular depletion in the primary leukaemia niche to a fully reconstituted state upon remission induction. Functionally, adipocyte niches elicit a fate switch in ALL cells towards slow-proliferation and cellular quiescence, highlighting the critical contribution of the adipocyte dynamic to disease establishment and chemotherapy resistance. Mechanistically, adipocyte niche interaction targets posttranscriptional networks and suppresses protein biosynthesis in ALL cells. Treatment with general control nonderepressible 2 inhibitor (GCN2ib) alleviates adipocyte-mediated translational repression and rescues ALL cell quiescence thereby significantly reducing the cytoprotective effect of adipocytes against chemotherapy and other extrinsic stressors. These data establish how adipocyte driven restrictions of the ALL proteome benefit ALL tumours, preventing their elimination, and suggest ways to manipulate adipocyte-mediated ALL resistance.


Conflict of interest statement

The authors declare no competing interests.

Figures

Fig. 1
Fig. 1. The adipocyte BM niche is dynamically remodelled during ALL pathogenesis and treatment.
a H&E-stained human BM biopsies from healthy control, patient with ALL at diagnosis (ALL01 Diagnostic) and post remission induction treatment (ALL01 Remission Induction). Representative of five independent healthy BM biopsies and eight independent matched pairs of ALL diagnosis and remission biopsies analysed once/biopsy. Zoomed-in images of the boxed regions are presented below. Black arrowheads indicate BM adipocytes. Custom image analysis using Visiopharm software identifies individual BM adipocytes as green objects. b Adipocyte numbers quantified by Visiopharm analysis in healthy controls (n = 5) and paired ALL diagnosis vs ALL remission BM biopsies (n = 8). Each datapoint denotes an independent biopsy. Data are normalized to the size of the biopsy. **p < 0.01 by one-way ANOVA with Tukey’s multiple comparison test. c Adipocyte size quantified by Visiopharm analysis in healthy control (n = 5) and ALL diagnosis (n = 8, ALL01-ALL08) BM biopsies. Data points denote values for individual adipocytes (>45). The mean ± SEM is shown. Statistical significance was assessed by a Kruskal–Wallis test with Dunn’s multiple comparisons test (****p < 0.0001). d Adipocyte size quantified by Visiopharm analysis in healthy control (n = 5) and ALL remission (rALL) BM biopsies (n = 8). Data points denote values for individual adipocytes (>72). The mean ± SEM is shown. Statistical significance was assessed by a Kruskal–Wallis test with Dunn’s multiple comparisons test (****p < 0.0001). e Adiponectin concentrations in serum samples from healthy control vs ALL diagnosis BM (including ALL04, ALL17 and ALL21). Adiponectin was quantified using a commercial ELISA kit. Each datapoint denotes an independent BM serum sample. ***p < 0.0006 by a 2-sided unpaired t test. f Morphological evaluation of residual ALL disease in H&E-stained BM biopsies from four consecutively assessed patients with an incomplete response (<5% blasts) to remission induction chemotherapy. Individual images show ALL tumour-specific immunostaining. Red arrows indicate ALL blasts in close proximity to BM adipocytes while black arrows denote interstitially distributed ALL disease as assigned by 2 independent reviews. The percentage of residual ALL disease was obtained from clinical reports and is indicated in red text.
Fig. 2
Fig. 2. ALL corrupts the functioning and lineage priming of the adipocyte precursor mesenchymal stromal-cell (MSC) population.
a Growth outcomes of ALL-MSCs (ALL12-ALL23) at P1. Each datapoint denotes an independent BM. ALL-MSCs were divided into high and low performers defined by the group mean. Horizontal line denotes the median *p < 0.0132, ***p < 0.001. b CFU-F numbers from seven independent ALL (ALL15-17, ALL19-21 and ALL23) and healthy-BMs after +10 days under MSC differentiation conditions. c Adipocyte-specific FABP4 staining in ALL vs healthy-MSCs (left) and FABP4 fluorescence quantification (right). Images are representative of seven and six independent BM samples, respectively analysing 100 cells/sample. d Osteocalcin staining in ALL vs healthy-MSCs (left) and osteocalcin fluorescence quantification (right). Images are representative of six and five independent BM samples, respectively. For (c) and (d) comparisons are between each individual ALL-MSC and the aggregated mean of healthy-MSCs. Horizontal line denotes the median; boxes extend from the 25th to the 75th percentile. e Representative micrographs (left) showing intracellular lipid staining with oil red (magnification, ×10; scale bar, 200 µm) following in vitro adipogenic differentiation in the absence or presence of conditioned media (CM) from cultured GMPB, from n = 3 biologically independent samples or from ALL cell lines (Nalm-6, REH and RS4;11). Oil red staining was quantified in three independently assayed wells/condition from one experiment. **p = 0.002, ***p = 0.0004. f Principal component analysis of global RNA-seq data from ALL-MSCs (ALL12-14) and age-matched healthy-MSCs (n = 3). Each dot represents an individual BM-MSC. g GSEA comparing RNA-seq-generated global transcriptomes of ALL-MSCs (n = 3) vs healthy-MSCs (n = 3) by KEGG pathway annotation. Significance was assigned by FDR q-value<0.05. Bars in green correspond to downregulated pathways. h Gene set enrichment plot for the KEGG cell cycle pathway demonstrating significant downregulation of these gene sets in ALL-MSCs. i Ki67 cell cycle analysis of ALL-MSCs (n = 4) vs healthy-MSCs (n = 4). Statistical comparisons are between each cell cycle stage. *p = 0.029. Unless otherwise stated, all data are presented as mean values ± SEM values of independent experiments (n = 4 in (a), n = 3 in (b), n = 1 in (e) and n = 3 in (i). Statistical significance was assessed using Kruskal–Wallis test with Dunn’s multiple comparisons test (ad),  2-sided unpaired t tests (e), two-sided Mann–Whitney U test (i). *p < 0.05, **p < 0.01,***p < 0.001, ****p < 0.0001) or the precise p-value where indicated. ns, not significant. NES, normalized enrichment score; FDR false discovery rate.
Fig. 3
Fig. 3. Adipocytes create a tumour-suppressive niche in B-ALL.
a Schematic of the experimental setup to assess functional interactions between ALL and adipocyte niches. b In vitro growth of ALL cell lines (Nalm-6, REH and RS4;11) in adipocyte and unrelated stromal environments over time. Primary BM-MSCs from three independent healthy donors were evaluated alongside their corresponding osteoblast and adipocyte derivative. c Frequency of quiescent (G0) and cycling (G1 and S/G2/M) populations in ALL cells after monoculture (−) vs adipocyte coculture (+) from experiments described in (b). Bottom panel shows representative Ki67/DAPI staining in CD19 + -gated Nalm-6 cells at +72 h. Percentage of cells in each phase of the cell cycle is shown in red. d Schematic showing the different microenvironments assayed for human ALL xenotransplantation studies. BM from the tail and gonadal fat are designated adipocyte-rich niches, whereas femoral BM is adipocyte poor. Arrows point to individual adipocytes. e Osmium-stained and micro-CT-imaged BM adipocytes in whole femurs from NSG mice at +10 days. BM-adipocyte production was stimulated by sublethal (2.5 Gy) total body irradiation and served as a positive control. f, g Engraftment outcomes of Nalm-6 (CD19+/CD10+) and four independent primary B-ALL (CD19+CD45+) tumours following tail vein IV injection in distinct in vivo niches. Statistical comparisons are with femur. h, i Comparison of cell cycle characteristics in Nalm-6 and primary B-ALL xenografts respectively from experiments described in (f, g). Not tested indicates failure to perform robust cell cycle analysis due to low cell recovery. The panel on the right shows representative Ki67/DAPI staining in CD19+ gated primary B-ALL xenografts in the indicated niches. The percentage of cells in the G0 phase is shown in red. Data are presented as mean values ± SEM values of independent experiments (n = 3 with 2–3 replicates in (b), n = 1 in (f, h) with n = 3 mice and n = 3 in (g, i) n = 4–5 mice. Statistical significance was assessed using 2-sided unpaired t tests (b, c, i: ALL15 and 23). ANOVA with Dunnett’s multiple comparisons test (f, g, i: ALL24 and ALL25), two-sided Mann–Whitney U-tests (h) (*p < 0.05, **p < 0.01, ***p < 0.001, ***p < 0.001). $$p < 0.01, $$$p < 0.001 for primary vs 3T3-L1 adipocytes. Only statistically significant comparisons are indicated (b, c).
Fig. 4
Fig. 4. Adipocyte niches restrict protein synthesis in ALL via non-canonical factors.
a Venn diagram of significant phosphosites identified in Nalm-6 cells cultured with 3T3-L1 adipocytes at +24 (green) and +72 h (red). Bracketed values denote the corresponding number of proteins. b Pathway analysis of the altered phosphoproteins from (a). Z-score, red: ≤−1.5, pathway underrepresented; green: ≥+1.5, pathway overrepresented. GO terms are grouped into categories that were hand curated. c Differential transcription level (log2) between Nalm-6 cells cultured with 3T3-L1 adipocytes vs 3T3-L1 preadipocytes at +24 h. Differentially transcribed genes (FDR q-value<0.05) are highlighted in red for each indicated log2 FC range. Dashed red lines represent log2 FC thresholds −1 and 1. Data derived from RNAseq of three replicates/condition. d GSEA comparing RNAseq-generated global transcriptomes of 3T3-L1 adipocyte vs 3T3-L1 preadipocyte cultured Nalm-6 cells by KEGG pathway annotation. Significant pathways defined by FDR q-value <0.05. (Red bar: upregulated pathways, Green bar: downregulated pathways). e OP-Puro incorporation by Nalm-6 cells under 3T3-L1 preadipocyte (grey) or 3T3-L1 adipocytes (blue) coculture relative to monoculture. Nalm-6 monocultures treated with CHX, 10 µg/mL for 10 min (black), served as a positive control. Representative histograms of OP-Puro fluorescence are shown on the right. f OP-Puro incorporation in vitro in Nalm-6 cells in G0/G1 vs S/G2/M fractions +72 h after coculture with 3T3-L1 preadipocytes (grey) or 3T3-L1 adipocytes (blue). Data are normalized to monocultures. g OP-Puro incorporation in CD19+/CD45+ xenografted primary B-ALL cells (ALL24 and ALL25) harvested from femoral (blue) and tail (red) BMs according to cell cycle stage. ALL24 G0/G1 p = 0.0002, S/G2/M p = 0.0003; ALL25 G0/G1 p = 0.017, S/G2/M p = 0.045. h Western blot showing p-eIF2α levels in Nalm-6 cells (5×10⁶) after 72 h treatment with ISRIB, PERKi, or GCN2ib or Thapsigargin (250 nM), the latter serves as a positive control. (representative of two independent experiments). i OP-Puro incorporation in Nalm-6 cells cocultured with 3T3-L1 adipocytes after 72 h of GCN2ib (5ug/mL) vs vehicle treatment. The results are expressed relative to the OP-Puro fluorescence of Nalm-6 in 3T3-L1 preadipocyte coculture. **p = 0.0022. j Frequency of G0 cells in Nalm-6 cells cocultured with 3T3-L1 adipocytes after 72 h of GCN2ib (5ug/mL) vs vehicle treatment. **p = 0.0017. Data are presented as mean values ± SEM values of independent experiments (n = 2 in c, n = 3 in (e, f) assessing triplicates, n = 2 in (g) with n = 4 mice, n = 2 in (i, j) assessing triplicates. Statistical significance was assessed using 2-sided unpaired t tests (e, fg, i, j) **p < 0.01. ***p < 0.001, ****p < 0.0001 or the precise p-value where indicated.
Fig. 5
Fig. 5. Adipocyte-adapted ALL proteomes increase global stress resistance.
a Cell viability of Nalm-6 cells from monoculture (black, n = 8) vs 3T3-L1 adipocyte coculture (blue, n = 8) in the presence of the indicated chemotherapeutic agents or mitosis-independent stressors (no FBS and hydrogen peroxide). Data are presented relative to vehicle controls. b Cell viability of Nalm-6 cells after +48 h recovery from 3T3-L1 adipocyte coculture (blue, n = 4) or from monoculture (black, n = 4) after exposure to mitosis-dependant chemotherapy or mitosis-independent stressors (no FBS and hydrogen peroxide). Data are presented relative to vehicle controls. c Cell viability of Nalm-6 monocultured (black, n = 3) or 3T3-L1 adipocyte-cocultured Nalm-6 cells (blue, n = 3) in the presence of GCN2ib treatment (5 µg/mL) and the indicated cellular stressors. d Schematic for pulsed SILAC-based proteomic analysis. Nalm-6 cells cocultured with either 3T3-L1 adipocytes or preadipocytes were pulsed at +24 h and at 48 h with either ‘heavy’ or ‘medium’ isotope-labelled amino acids. Following a 4 h incubation, Nalm-6 cells were separated from their microenvironment for protein extraction. Lysates were mixed in equal amounts (between heavily and medium labelled samples at each time point), digested, fractionated and analysed using mass spectrometry.e Scatter plot showing the normalized log2 ratio of proteins detected following pulsed SILAC-based proteomic analysis in Nalm-6 cells cocultured with 3T3-L1 adipocytes (Adipo) relative to preadipocytes (preadipo) at +24 h vs 48 h from one experiment. Blue Arrows describe the direction of change in adipocyte-specific coculture. Data are presented as mean values ± SEM values of independent experiments (n = 2 in (a) with four replicates, n = 1 with four replicates in (b, c). Statistical significance was assessed using 2-sided unpaired t tests (a, b for the single-agent treatments), Mann–Whitney U test for combination chemotherapy treatment (b) One-way ANOVA followed by Tukey’s test for multiple comparisons c. **p < 0.01, ***p < 0.001, ****p < 0.0001.
Fig. 6
Fig. 6. a Adipocyte niche function in ALL disease.
Graphical abstract showing the temporal course of adipocyte niches across the ALL disease-remission transition and its pathophysiological relevance based on the demonstration of adipocyte-driven modulations in ALL cell phenotype.

References

    1. Hunger SP, et al. Improved survival for children and adolescents with acute lymphoblastic leukemia between 1990 and 2005: a report from the children’s oncology group. J. Clin. Oncol. 2012;30:1663–1669. doi: 10.1200/JCO.2011.37.8018. - DOI - PMC - PubMed
    1. Goldstone AH, et al. In adults with standard-risk acute lymphoblastic leukemia, the greatest benefit is achieved from a matched sibling allogeneic transplantation in first complete remission, and an autologous transplantation is less effective than conventional consolidation/maintenance chemotherapy in all patients: final results of the International ALL Trial (MRC UKALL XII/ECOG E2993) Blood. 2008;111:1827–1833. doi: 10.1182/blood-2007-10-116582. - DOI - PubMed
    1. Patel B, et al. Minimal residual disease is a significant predictor of treatment failure in non T-lineage adult acute lymphoblastic leukaemia: final results of the international trial UKALL XII/ECOG2993. Br. J. Haematol. 2010;148:80–89. doi: 10.1111/j.1365-2141.2009.07941.x. - DOI - PubMed
    1. Gokbuget N, et al. Adult patients with acute lymphoblastic leukemia and molecular failure display a poor prognosis and are candidates for stem cell transplantation and targeted therapies. Blood. 2012;120:1868–1876. doi: 10.1182/blood-2011-09-377713. - DOI - PubMed
    1. Bruggemann M, et al. Clinical significance of minimal residual disease quantification in adult patients with standard-risk acute lymphoblastic leukemia. Blood. 2006;107:1116–1123. doi: 10.1182/blood-2005-07-2708. - DOI - PubMed

Publication types