. 2021 Sep 17;12(1):5501.
doi: 10.1038/s41467-021-25585-5.

Pericyte-derived fibrotic scarring is conserved across diverse central nervous system lesions

Affiliations

Pericyte-derived fibrotic scarring is conserved across diverse central nervous system lesions

David O Dias et al. Nat Commun. .

Abstract

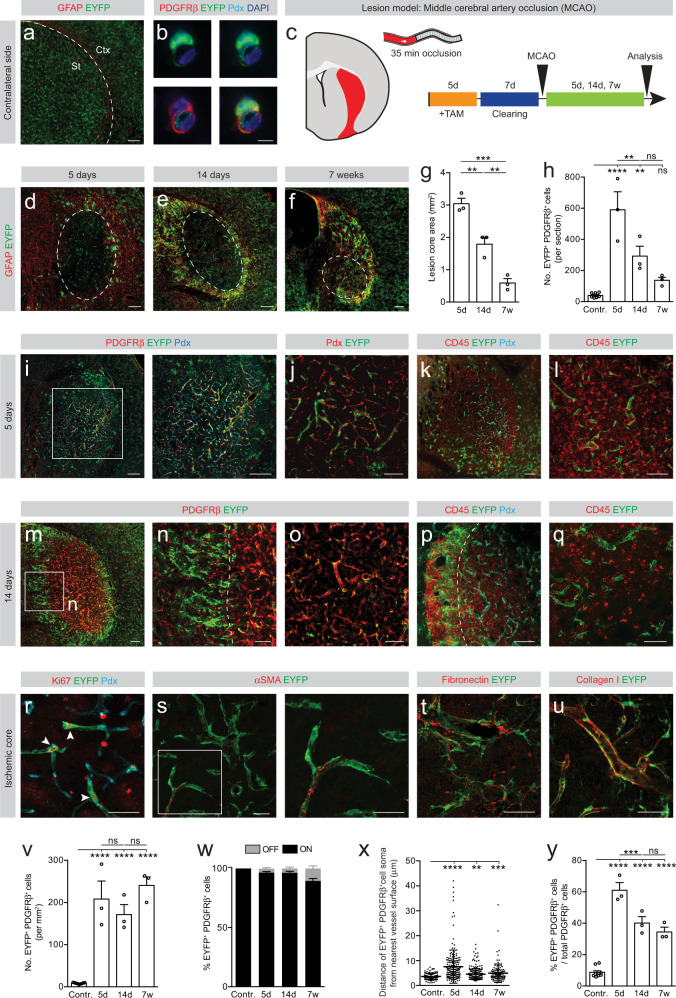
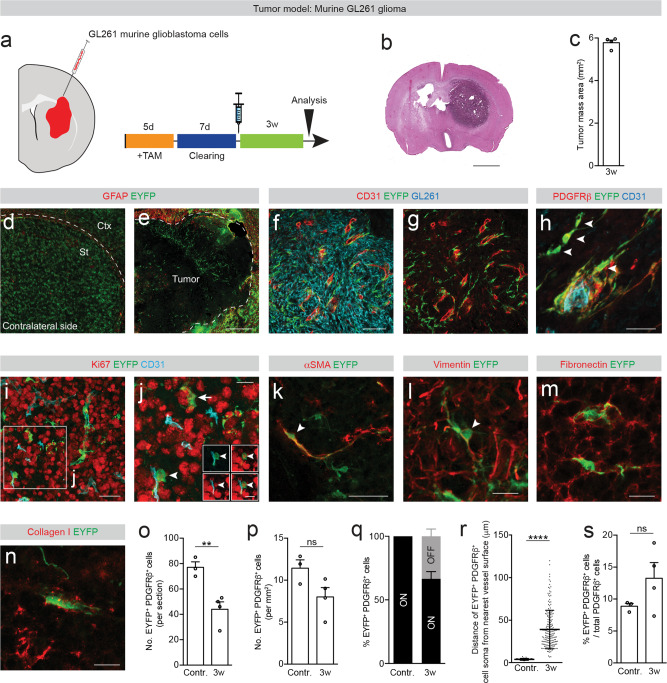
Fibrotic scar tissue limits central nervous system regeneration in adult mammals. The extent of fibrotic tissue generation and distribution of stromal cells across different lesions in the brain and spinal cord has not been systematically investigated in mice and humans. Furthermore, it is unknown whether scar-forming stromal cells have the same origin throughout the central nervous system and in different types of lesions. In the current study, we compared fibrotic scarring in human pathological tissue and corresponding mouse models of penetrating and non-penetrating spinal cord injury, traumatic brain injury, ischemic stroke, multiple sclerosis and glioblastoma. We show that the extent and distribution of stromal cells are specific to the type of lesion and, in most cases, similar between mice and humans. Employing in vivo lineage tracing, we report that in all mouse models that develop fibrotic tissue, the primary source of scar-forming fibroblasts is a discrete subset of perivascular cells, termed type A pericytes. Perivascular cells with a type A pericyte marker profile also exist in the human brain and spinal cord. We uncover type A pericyte-derived fibrosis as a conserved mechanism that may be explored as a therapeutic target to improve recovery after central nervous system lesions.


Conflict of interest statement

The authors declare no competing interests.

Figures

Fig. 1
Fig. 1. Type A pericytes are the main source of stromal fibroblasts that form fibrotic scar tissue after non-penetrating spinal crush injury.
a A subset of perivascular cells, named type A pericytes, is recombined (EYFP+, arrowheads) in the uninjured spinal cord of GLAST-CreERT2;R26R-EYFP mice. b Type A pericyte (EYFP+) lining the endothelial wall (marked with podocalyxin, Pdx) and expressing the pericyte marker PDGFRβ. c Lesion model and experimental timeline. Red represents the lesion. Distribution of EYFP+ cells and GFAP+ glial cells at 5 dpi (d), 14 dpi (e) and 7 wpi (f). Lesion core area (g) and number of EYFP+PDGFRβ+ cells per section (h). EYFP+PDGFRβ+ cells are bordered by GFAP+ reactive astrocytes (i, j) and locate outside the vascular wall (Pdx+; arrowheads) at 5 dpi (k). Inset in (k) shows magnified boxed region. EYFP+ cells proliferate (Ki67+) while associated with (arrowheads) or away from (arrows) the vascular wall (l), and express the (myo)fibroblast marker αSMA (m) at 5 dpi. n A sharp lesion border forms at 14 dpi, segregating the glial (GFAP+) and fibrotic (EYFP+) compartments of the scar. Arrowheads point at a glial bridge. EYFP+PDGFRβ+stromal cells populate the lesion core (o) and a fraction is located away from the vascular wall (p) at 14 dpi. EYFP+ cells are embedded in fibronectin- (q) and collagen I- (r) rich ECM (14 dpi) and express vimentin (s) (5 dpi). t Density of EYFP+PDGFRβ+ cells in the fibrotic core. u Percentage of EYFP+ cells that express PDGFRβ (EYFP+PDGFRβ+ cells) associated with (ON vessel) or located away from (OFF vessel) the vascular wall. v Distance of EYFP+PDGFRβ+ cells ON vessel (uninjured spinal cord) or OFF vessel (after injury) from the nearest vessel surface. Each dot represents one cell. w Percentage of PDGFRβ+ cells that express EYFP out of total PDGFRβ+cells. TAM tamoxifen; Scale bars: 200 μm (a, df), 100 μm (ik, np), 50 μm (l, q, r), 25 μm (inset k, m, s) and 5 μm (b). Data shown as mean ± s.e.m. n = 3 (Uninjured), n = 4 (5d), n = 5 (14d) and n = 3 (7w) animals in (g, h, t, u, w); n = 69 (Uninjured), n = 334 (5d), n = 423 (14d) and n = 408 (7w) cells examined over 3 animals in (v). ns non-significant; *p < 0.05, **p < 0.01, ***p < 0.001, ****p < 0.0001 by One-Way ANOVA followed by Holm–Sidak post-hoc test in (g, h, t, w) and Kruskal–Wallis test followed by Dunn’s post-hoc test in (v). Dashed lines in (np) outline the lesion core. i, j, n, o denote paired images. Cell nuclei are labeled with DAPI. All images show sagittal sections. Images are representative of two independent experiments. Source data and statistical details are provided as a Source Data file.
Fig. 2
Fig. 2. Type A pericytes are the main source of stromal fibroblasts that form fibrotic scar tissue after cortico-striatal stab lesions.
Type A pericytes and parenchymal astrocytes are recombined (EYFP+) throughout the cerebral cortex (Ctx) and striatum (St) of GLAST-CreERT2;R26R-EYFP mice. b Type A pericyte (EYFP+) encircling the endothelial tube (podocalyxin+, Pdx) and expressing the pericyte marker PDGFRβ in the cortex. c Lesion model and experimental timeline. Red represents the lesion. Distribution of EYFP+ cells at 5 dpi (d), 14 dpi (e), and 7 wpi (f). The GFAP+ glial scar is partly recombined. Type A pericyte-derived cells (EYFP+GFAP cells) cluster in the lesion core. Inset in (d) shows magnified boxed region. Lesion core area (g) and number of EYFP+PDGFRβ+ cells per section (h). EYFP+ cells express PDGFRβ (i, j) and a fraction is located outside the vascular wall (Pdx+; arrowheads in k) at 5 dpi. Arrowheads point at protrusion-like structures in (j). Asterisk marks the lesion core; dashed line separates the lesion core from penumbral tissue (i). Insets show magnified boxed regions. EYFP+cells proliferate (Ki67+) while attached to the vascular wall (arrowheads) and away from it (arrows) (l) and express the (myo)fibroblast marker αSMA (m) at 5 dpi. np EYFP+PDGFRβ+ cells occupy the lesion core and are bordered by GFAP+ reactive glia at 14 dpi. qs EYFP+ cells are surrounded by fibronectin+ (q) and collagen I+ (r) ECM and express vimentin (s) at 14 dpi and 5 dpi, respectively. t Density of EYFP+PDGFRβ+ cells in the fibrotic core. u Percentage of EYFP+ cells that express PDGFRβ (EYFP+PDGFRβ+ cells) associated with (ON vessel) or located away from (OFF vessel) the vascular wall. v Distance of EYFP+PDGFRβ+ cells ON vessel (contralateral side to the lesion) or OFF vessel (after injury) from the nearest vessel surface. Each dot represents one cell. w Percentage of PDGFRβ+ cells that express EYFP out of total PDGFRβ+ cells. TAM tamoxifen; Scale bars: 400 μm (a, d, i), 100 μm (e, f, k, np), 50 μm (inset d, j, l), 25 μm (inset k, m, qs), 10 μm (inset j) and 5 μm (b). Data shown as mean ± s.e.m. n = 9 (Contralateral), n = 3 (5d), n = 3 (14d) and n = 3 (7w) animals in (g, h, t, u, w); n = 94 (Contralateral), n = 142 (5d), n = 194 (14d) and n = 397 (7w) cells examined over 3 animals in (v). ns non-significant; *p < 0.05, **p < 0.01, ***p < 0.001, ****p < 0.0001 by One-Way ANOVA followed by Holm–Sidak post-hoc test in (g, h, t, w) and Kruskal–Wallis test followed by Dunn’s post-hoc test in (v). Dashed lines in (df, n, o) outline the lesion core. n, o denote paired images. Cell nuclei are labeled DAPI. All images show sagittal sections. Images are representative of two independent experiments. Source data and statistical test results are provided as a Source Data file.
Fig. 3
Fig. 3. Type A pericytes are the main source of stromal fibroblasts that form fibrotic scar tissue after large stab lesions restricted to the cerebral cortex.
a Lesion model and experimental timeline. Red represents the lesion. Distribution of tdTom+ cells at 5 dpi (b, d) and 14 dpi (c, e). Type A pericyte-derived cells (tdTom+PDGFRβ+ cells) cluster in the lesion core (dashed lines), bordered by a partially recombined GFAP+glial scar. fi The lesion core (GFAP area; outlined by dashed lines) is filled with tdTom+PDGFRβ+ cells (fh) located outside the vascular wall (podocalyxin+, Pdx) (i) at 5 dpi. TdTom+ cells proliferate (Ki67+) while attached to the blood vessel wall (arrowheads) and away from it (arrows) (j) and express the (myo)fibroblast marker αSMA (k) at 5 dpi. lo TdTom+ cells retain PDGFRβ+ expression and occupy the lesion core (outlined by dashed lines) surrounded by GFAP+ glial cells at 14 dpi (ln). A fraction of tdTom+ cells no longer associates with the vascular wall (o). pr TdTom+ cells are surrounded by fibronectin+ (p) and collagen I+ (q) ECM and express vimentin (r) at 14 dpi and 5 dpi, respectively. Quantification of the lesion core area (s), number of tdTom+PDGFRβ+ cells per section (t), and density of tdTom+PDGFRβ+ cells (u) overtime. v Percentage of tdTom+ cells that express PDGFRβ (tdTom+PDGFRβ+ cells) associated with (ON vessel) or located outside (OFF vessel) the vascular wall. w Distance of tdTom+PDGFRβ+ cells ON vessel (contralateral cortex) or OFF vessel (after injury) from the nearest vessel surface. Each dot represents one cell. x Percentage of PDGFRβ+ cells that express tdTom out of total PDGFRβ+ cells. TAM tamoxifen; Scale bars: 500 μm (be), 100 μm (f, g), 50 μm (ho) and 20 μm (pr). Data shown as mean ± s.e.m. n = 8 (Contralateral), n = 4 (5d), and n = 4 (14d) animals in (sv, x). n = 131 (Contralateral), n = 401 (5d), and n = 117 (14d) cells examined over 4 animals in (w). ns non-significant; *p < 0.05, ***p < 0.001, ****p < 0.0001 by two-sided, unpaired Student’s t test in (s), One-Way ANOVA followed by Holm–Sidak post-hoc test in (t, u, x) and Kruskal–Wallis test followed by Dunn’s post-hoc test in (w). b, d, c, e, f, g, l, m, n, o denote paired images. Images show coronal sections. Images are representative of two independent experiments. Source data and statistical test results are provided as a Source Data file.
Fig. 4
Fig. 4. Type A pericytes are the main source of stromal fibroblasts that form fibrotic scar tissue after experimental autoimmune encephalomyelitis.
a MOG35-55-induced EAE model and experimental timeline. Red represents the lesions. Clinical scores (b) and body weight curves relative to day 0 (pre-immunization) (c) for EAE and control animals. Distribution of EYFP+cells (arrowheads) in the thoracic spinal cord of control (d) and EAE animals (e). f Reactive astrocytes (GFAP+) intermingle with EYFP+ cells. g Distribution and number of lesions across the dorsal (dWM), intermediate (iWM), ventrolateral (vlWM), and ventral (vWM) white matter. h Area occupied by EAE lesions. EYFP+ cells intermingle with CD45+ immune cells (i, j), including infiltrating CD3+ T-lymphocytes (k) in demyelinated EAE lesions, identified as regions lacking fluoromyelin signal (encircled by dashed lines). EYFP+PDGFRβ+ cells accumulate in EAE scars (l, m; arrowheads) and a fraction is located in distance to the vascular wall (podocalyxin+, Pdx; arrowheads) (n, o). EYFP+ stromal cells proliferate (Ki67+) in association with the vascular wall (arrowheads) and away from it (arrows) (p), express the (myo)fibroblast markers αSMA (q) and vimentin (r) and are surrounded by ECM enriched in fibronectin (s) and collagen I (t). Number (u) and density (v) of EYFP+PDGFRβ+ cells in control and EAE animals. w Percentage of EYFP+PDGFRβ+ cells associated with (ON vessel) or located outside (OFF vessel) the vascular wall. x Distance of EYFP+PDGFRβ+ cells ON vessel (EAE control) or OFF vessel (EAE) from the nearest vessel surface. Each dot represents one cell. y Percentage of PDGFRβ+ cells that express EYFP out of total PDGFRβ+ cells. TAM tamoxifen, MOG myelin oligodendrocyte glycoprotein. Scale bars: 200 μm (d, e, i, l), 100 μm (f, j, k, m, n), and 50 μm (ot). Data shown as mean ± s.e.m. n = 5 (Control) and n = 4 (30d) animals in (b, c, g, h, uw, y); n = 118 (Control) and n = 367 (30d) cells examined over 4 animals in (x). ***p < 0.001, ****p < 0.0001 by two-sided, unpaired Student’s t test in (u, v, y) and two-sided Mann–Whitney test in (x). i, m, n denote paired images. All images show coronal sections. Images are representative of two independent experiments. Source data and statistical test results are provided as a Source Data file.
Fig. 5
Fig. 5. Type A pericytes remain associated with the vascular wall following ischemic stroke confined to the striatum.
a Type A pericytes and parenchymal astrocytes are recombined (EYFP+) throughout the cortex (Ctx) and striatum (St) of GLAST-CreERT2;R26R-EYFP mice. Dashed line separates cortex from striatum. b Type A pericyte (EYFP+) encircling the endothelial tube (podocalyxin+, Pdx) and expressing the pericyte marker PDGFRβ in the striatum. c Lesion model and experimental timeline. Red represents the lesion. Distribution of EYFP+ cells at 5 days (d), 14 days (e), and 7 weeks (f) following ischemia. Type A pericyte-derived cells (EYFP+GFAP_ cells) occupy the ischemic lesion core (outlined by dashed lines), surrounded by a partially recombined GFAP+ glial scar. Lesion core area (g) and number of EYFP+PDGFRβ+ cells per section (h). EYFP+PDGFRβ+ cells in the ischemic core (i) do not leave the vascular wall (Pdx+) (j). Magnified boxed region in (i) shown on the right. EYFP+ cells disperse among CD45+ immune cells at 5 days (k, l) and 14 days (p, q) after stroke. EYFP+PDGFRβ+ cells occupy the lesion core, bordered by partly recombined EYFP+PDGFRβ glial cells at 14 days after stroke (mo). k, p, m show overviews of the lesion and l, n, o, q close-ups of the ischemic core. Dashed lines in (n, p) demarcate the glial-fibrotic lesion border. EYFP+ cells proliferate (arrowheads in (r) point at Ki67+EYFP+ cells) and do not express αSMA (s) at 5 days after stroke. Magnified boxed region in (s) shown on the right. EYFP+ cells are encased by fibronectin (t) and collagen I (u) ECM at 14 days after stroke. v Density of EYFP+PDGFRβ+ cells overtime. w Most EYFP+PDGFRβ+ cells remain associated with the vascular wall (ON vessel) after striatal stroke. x Distance of EYFP+PDGFRβ+ cells from the nearest vessel surface in the contralateral striatum and after stroke. Each dot represents one cell. y Percentage of PDGFRβ + cells that express EYFP out of total PDGFRβ+ cells. TAM tamoxifen; Scale bars: 200 μm (a, df, i, k, m), 100 μm (close up i, j, l, np), 50 μm (qu) and 5 μm (b). Data shown as mean ± s.e.m. n = 9 (Contralateral), n = 3 (5d), n = 3 (14d) and n = 3 (7w) animals in (g, h, v, w, y); n = 127 (Contralateral), n = 195 (5d), n = 248 (14d) and n = 122 (7w) cells examined over 3 animals in (x). ns non-significant; **p < 0.01, ***p < 0.001, ****p < 0.0001 by One-Way ANOVA followed by Holm–Sidak post-hoc test in (g, h, v, y) and Kruskal–Wallis test followed by Dunn’s post-hoc test in (x). Cell nuclei are labeled with DAPI. All images show coronal sections. Images are representative of two independent experiments. Source data and statistical test results are provided as a Source Data file.
Fig. 6
Fig. 6. Type A pericytes are the main source of stromal fibroblasts that form fibrotic scar tissue following cortical ischemic stroke.
a Lesion model and experimental timeline. Red represents the lesion. Distribution of recombined cells (tdTom+) at 5 days (b, d) and 14 days (c, e) after stroke. Type A pericyte-derived cells (TdTom+PDGFRβ+) occupy the ischemic lesion core (outlined by dashed lines), flanked by a partly recombined GFAP+ glial scar. fo The ischemic core is filled with tdTom+ cells that express PDGFRβ and delimited by GFAP+ glial cells at 5 days (fh) and 14 days (ln) after stroke. Dashed lines separate the glial (GFAP+) and fibrotic (tdTom+) scar compartments. A fraction of tdTom+ cells no longer associates with the vascular wall (labeled by podocalyxin, Pdx) (i, o). TdTom+ cells proliferate (Ki67+) while attached to the vascular wall (arrowheads) and away from it (arrows) (j) and express the (myo)fibroblast marker αSMA (k). TdTom+ cells express vimentin (p) at 5 days after stroke and are surrounded by fibronectin (q) and collagen I (r) at 14 days after stroke. Quantification of the lesion core area (s), number of tdTom+PDGFRβ+ cells per section (t) and density of tdTom+PDGFRβ+ cells (u). v Percentage of tdTom+PDGFRβ+ cells associated with (ON vessel) or located outside (OFF vessel) the vascular wall. w Distance of tdTom+PDGFRβ+ cells ON vessel (contralateral cortex) or OFF vessel (after stroke) from the nearest vessel surface. Each dot represents one cell. x Percentage of PDGFRβ+ cells that express tdTom out of total PDGFRβ+ cells. TAM tamoxifen; Scale bars: 500 μm (be), 200 μm (f, g, l, m) and 50 μm (hk, nr). Data shown as mean ± s.e.m. n = 8 (Contralateral), n = 4 (5d) and n = 4 (14d) animals in (sv, x); n = 252 (Contralateral), n = 286 (5d) and n = 360 (14d) cells examined over 4 animals in (w). ns non-significant; *p < 0.05, **p < 0.01, ****p < 0.0001 by two-sided, unpaired Student’s t test in (s), One-Way ANOVA followed by Holm–Sidak post-hoc test in (t, u, x) and Kruskal–Wallis test followed by Dunn’s post-hoc test in (w). b, d, c, e, f, g, l, m denote paired images. All images show coronal sections. Images are representative of two independent experiments. Source data and statistical test results are provided as a Source Data file.
Fig. 7
Fig. 7. Type A pericyte-derived cells contribute to the tumor stroma.
a Glioblastoma model and experimental timeline. Red represents the tumor. b Tumor cell mass is confined to the striatum (hematoxylin and eosin stain). c Area occupied by the tumor cell mass. Distribution of EYFP+ cells in the contralateral (d) and ipsilateral (e) side to the tumor. Type A pericytes and progeny (EYFP+GFAP) are found within the tumor core, whereas partially recombined GFAP+ reactive astrocytes border the tumor. Dashed line separates the cortex (Ctx) and striatum (St) in (d) and outlines the tumor core in (e). f, g EYFP+ cells intermingle with GL261 tumor cells (labeled with an antibody against NG2). h A fraction of EYFP+PDGFRβ+ cells locates outside the vascular wall (arrowheads; endothelial cells marked by CD31), i, j EYFP+ cells proliferate in contact (arrowhead) and away (arrow) from the vascular wall. Insets in (j) show a EYFP+ cell associated with the vascular wall (CD31+) expressing the mitotic marker Ki67. EYFP+ cells express αSMA (k; arrowhead) and vimentin (l), and are surrounded by fibronectin (m) and collagen I (n) ECM. Number (o) and density (p) of EYFP+PDGFRβ+ cells in the tumor core and contralateral side. q Percentage of EYFP+PDGFRβ+ cells associated with (ON vessel) or located outside (OFF vessel) the vascular wall. r Distance of EYFP+PDGFRβ+ cells ON vessel (contralateral side to the tumor) or OFF vessel (tumor) from the nearest vessel surface. Each dot represents one cell. s Percentage of PDGFRβ+ cells that express EYFP out of total PDGFRβ+ cells. TAM tamoxifen; Scale bars: 1.5 mm (b), 200 μm (d, e), 100 μm (f, g), 50 μm (i, k) and 20 μm (h, l, m, n, j and insets in j). Data shown as mean ± s.e.m. n = 3 (Contralateral) and n = 4 (3w) animals in (c, o, p, s); n = 3 (Contralateral) and n = 5 (3w) animals in (q); n = 36 (Contralateral) and n = 189 (3w) cells examined over 3 animals in (r). ns non-significant; **p < 0.01, ****p < 0.0001 by two-sided, unpaired Student’s t test in (o, p, s) and two-sided Mann–Whitney test in (r). f, g denote paired images. All images show coronal sections. Images are representative of two independent experiments. Source data and statistical test results are provided as a Source Data file.
Fig. 8
Fig. 8. Type A pericytes are required for the generation of fibrotic scar tissue and deposition of ECM after injury.
a Schematic illustrations depicting the contribution of type A pericytes to ischemic lesions confined to the striatum or cortex (lesions represented in red). Upper row: Following striatal stroke, type A pericytes and progeny increase in number but remain associated with the vascular wall (cells colored light green). Lower row: After cortical stroke, type A pericyte-derived cells increase in number and dissociate from the vascular wall (cells colored dark green). Light colored regions represent peri-lesion tissue and darker regions the ischemic stroke core. Representative overview images and quantification of fibronectin (b, c) and collagen I (d, e) deposition in the lesion core. Dashed lines encircle the lesion core. f Genetic strategy to block the generation of progeny by type A pericytes. Tamoxifen (TAM)-induced genetic recombination in Cre+ GLAST-CreERT2;Rasless;Rosa26-EYFP (GLAST-Rasless-EYFP) animals prior to injury results in inhibition of injury-induced type A pericyte proliferation through cell-specific deletion of floxed K-Ras in mice with H-Ras and N-Ras null alleles. Both Cre+ and CreWT animals are treated with tamoxifen prior to injury, but CreWT animals do not undergo genetic recombination and serve as control. Representative overview images of fibronectin (g) and collagen I (h) deposition in lesion core. Quantification of the total lesion core volume (i) and lesion core volume covered by PDGFRβ+stromal cells (j), fibronectin (k) or collagen I (l) in CreWT and Cre+ GLAST-Rasless-EYFP animals, 14 days after a cortico-striatal stab wound. TAM tamoxifen; Scale bars: 200 μm (g, h, striatal stroke in b, d) and 100 μm (cortical stroke in b, d). Data shown as mean ± s.e.m. n = 3 (Contralateral side striatal stroke), n = 3 (Striatal stroke), n = 4 (Contralateral side cortical stroke), n = 4 (Cortical stroke), n = 4 (Stab wound CreWT) and n = 6 (Stab wound Cre+) animals. ns non-significant; *p < 0.05, **p < 0.01, ****p < 0.0001 by One-Way ANOVA followed by Tukey’s multiple comparisons post-hoc test in (c, e) and two-sided Mann–Whitney test in (il). g, h denote paired images. Cell nuclei are labeled with DAPI. Images show coronal (a, b) and sagittal (g, h) sections. Images are representative of two independent experiments. Source data and statistical test results are provided as a Source Data file.
Fig. 9
Fig. 9. GLAST-expressing perivascular cells reside in the human CNS vasculature.
Representative images of post-mortem human tissue from the healthy spinal cord (a) and occipital cortex (e) labeled with antibodies recognizing PDGFRβ and podocalyxin (Pdx). Insets show magnified boxed regions and reveal PDGFRβ-expressing perivascular cells enveloping the endothelial tube. Example of a pericyte (labeled with an antibody against PDGFRβ) with characteristic protruding ovoid cell body and processes encircling the endothelial wall of a small caliber blood vessel in the healthy human spinal cord (b). Example of a pericyte (PDGFRβ+) extending its processes around the endothelial wall of a small caliber blood vessel in the healthy human occipital cortex (f). Human endothelial cells were labeled with Ulex Europaeus-I (UEA-1) lectin. Arrowheads points at the pericyte soma. Detection of SLC1A3 (GLAST) and PDGFRB mRNA in the healthy human spinal cord (c, d) and occipital cortex (g, h) by RNAscope in situ hybridization combined with immunofluorescence for the UEA-1. White arrowheads point at blood vessel-associated cells positive for PDGFRB and SLC1A3 mRNA signals, representing GLAST+PDGFRβ+ perivascular cells; yellow arrowheads identify blood vessel-associated cells positive for PDGFRB mRNA signals with low/undetectable levels of SLC1A3 mRNA, representing GLAST PDGFRβ+ perivascular cells; white arrows point at parenchymal (non-blood vessel-associated) cells positive for SLC1A3 mRNA signals with low/undetectable levels of PDGFRB mRNA, likely representing GLAST+PDGFRβ+ astrocytes. Cell nuclei are labeled with DAPI. Scale bars: 100 μm (a, e), 50 μm (c), 20 μm (g, insets in a, e), 10 μm (d, h) and 5 μm (b, f). All images show coronal sections. Images are representative of four independent individuals.
Fig. 10
Fig. 10. Fibrotic scarring in human pathology.
PDGFRβ+ stromal cells accumulate in the core of the lesion, 16 days after human traumatic spinal cord injury at C4 (a, b). As observed following experimental spinal cord injury in rodents, a fraction of PDGFRβ+ stromal cells is located in distance to the vascular wall (CD31+) following traumatic spinal cord injury in humans (inset in b). Dashed line in (a) demarcates the border between GFAP+ reactive glia and non-neural scar tissue; (b) shows a higher magnification of the boxed region in (a). cf Perivascular aggregates of PDGFRβ+ stromal cells are detected in chronic active multiple sclerosis lesions (c, d), 21 years following the onset of the disease (secondary progressive multiple sclerosis). Gliosis (GFAP+) is observed in regions of PDGFRβ+ perivascular cell reactivity (f). Von Willebrand factor (vWF) marks endothelial cells in (c, d, f). Asterisks in (c) denote demyelinated regions (weak MBP signal) of the spinal cord. Arrowheads in (e) point at PDGFRβ+ cells that do not contact the blood vessel wall (UEA-1 marks endothelial cells). Dashed line in (d) separates myelinated white matter tissue (MBP+) from partially demyelinated lesion areas. g, h PDGFRβ+stromal cells remain attached to the blood vessel wall (UEA-1+), 7 weeks following a territorial stroke located in the basal ganglia (g, h and insets). Dashed line marks the border between GFAP+ reactive glia and the ischemic lesion core. PDGFRβ+ stromal cells populate the stroma of a glioblastoma multiforme (grade IV tumor) that involves the corpus callosum and spreads bihemispherically (i). No substantial fraction of PDGFRβ+ stromal cells (immunopositive for podocalyxin) is observed away from the vascular wall (j). MBP myelin basic protein; Cell nuclei are labeled with DAPI. Scale bars: 1 mm (c, i), 500 μm (a, d, g, h), 200 μm (j), 100 μm (b, e, f, insets in g, h) and 20 μm (inset in b). g, h show paired images. All images show coronal sections. Images are representative of six (spinal cord injury), six (multiple sclerosis), three (subcortical stroke) and three (glioblastoma) independent individuals.

References

    1. O’Shea TM, et al. Cell biology of spinal cord injury and repair. J. Clin. Investig. 2017;127:3259–3270. doi: 10.1172/JCI90608. - DOI - PMC - PubMed
    1. Dias DO, Göritz C. Fibrotic scarring following lesions to the central nervous system. Matrix Biol. 2018;68–69:561–570. doi: 10.1016/j.matbio.2018.02.009. - DOI - PubMed
    1. Göritz, C. et al. A pericyte origin of spinal cord scar tissue. Science333, 238–342 (2011). - PubMed
    1. Sabelström H, et al. Resident neural stem cells restrict tissue damage and neuronal loss after spinal cord injury in mice. Science. 2013;342:637–640. doi: 10.1126/science.1242576. - DOI - PubMed
    1. Cregg JM, et al. Functional regeneration beyond the glial scar. Exp. Neurol. 2014;253:197–207. doi: 10.1016/j.expneurol.2013.12.024. - DOI - PMC - PubMed

Publication types

MeSH terms

Substances