. 2021 Sep 17;12(1):5524.
doi: 10.1038/s41467-021-25669-2.

Promoter-proximal elongation regulates transcription in archaea

Affiliations

Promoter-proximal elongation regulates transcription in archaea

Fabian Blombach et al. Nat Commun. .

Abstract

Recruitment of RNA polymerase and initiation factors to the promoter is the only known target for transcription activation and repression in archaea. Whether any of the subsequent steps towards productive transcription elongation are involved in regulation is not known. We characterised how the basal transcription machinery is distributed along genes in the archaeon Saccharolobus solfataricus. We discovered a distinct early elongation phase where RNA polymerases sequentially recruit the elongation factors Spt4/5 and Elf1 to form the transcription elongation complex (TEC) before the TEC escapes into productive transcription. TEC escape is rate-limiting for transcription output during exponential growth. Oxidative stress causes changes in TEC escape that correlate with changes in the transcriptome. Our results thus establish that TEC escape contributes to the basal promoter strength and facilitates transcription regulation. Impaired TEC escape coincides with the accumulation of initiation factors at the promoter and recruitment of termination factor aCPSF1 to the early TEC. This suggests two possible mechanisms for how TEC escape limits transcription, physically blocking upstream RNA polymerases during transcription initiation and premature termination of early TECs.


Conflict of interest statement

The authors declare no competing interests.

Figures

Fig. 1
Fig. 1. Uniform PIC assembly during exponential growth.
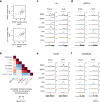
a Stages of transcription in archaea can be assessed by a combination of RNAP and basal transcription initiation and elongation factor occupancy. b Aggregate plots of ChIP-exo signal at the promoter for RNAP and initiation factors (n = 298 TUs). The average signal on the non-template and template strand is shown above and below the line, respectively. Data are pooled from three biological replicates. c Schematic showing the 50-nt window on the non-template strand that we used to quantify and correlate the ChIP-exo signal. Because RNAP and initiation factors TFB and TFEβ yield similar profiles on the non-template strand, this signal can be attributed to the PIC. d, e Scatter plots depicting correlation between the main ChIP-exo signal for TFB and RNAP (d) or TFEβ (e) within the PIC (n = 298). Data represent the average signal over a 50-nt window that we attributed to the PIC (see panel c). The geometric mean of three biological replicates is shown. f Aggregate plots of permanganate ChIP-seq signal at the promoter for initiation factor TFB (n = 298 TUs). The average signal for T-encoding positions on the non-template and template strand is shown above and below the line, respectively. Data are pooled from two biological replicates.
Fig. 2
Fig. 2. Productive transcription is limited by RNAP escape.
a Heatmap of ChIP-seq data for RNAP and the basal transcription machinery on a selected set of 212 TUs for exponential growth phase. The corresponding RNA-seq data for the plus strand are depicted on the right. Data are based on one representative of two biological replicates. be ChIP-seq occupancy plots on thsB coding for a subunit of the thermosome chaperone complex (b), rps8e (c), dhg-1 coding for a glucose-1-dehydrogenase (d) and CRISPR C (e). Traces show mean occupancy for two biological replicates with the range depicted as semi-transparent ribbon. fh Correlation of steady-state mRNA levels with RNAP occupancy at the promoter (RNAPPr,, f), the TU body (RNAPBd, g) and TFB promoter occupancy (h), n = 211 TUs. ChIP-seq data represent the geometric mean of two biological replicates. Rockhopper estimates of mRNA levels are based on two biological replicates.
Fig. 3
Fig. 3. Promoter-proximal elongation determines RNAP escape.
a, b Recruitment of elongation factor Spt4/5 precedes Elf1 and aCPSF1 recruitment to the TEC. Aggregate plots for TUs with high (EI RNAP >−1, n = 58) (a) and low escape indices (<−2.5, n = 41) from the set of 212 TUs analysed in Fig. 2 (b). Before averaging across TUs, RNAP, Spt4/5, Elf1 and aCPSF1 ChIP-seq occupancy was scaled to the average RNAP occupancy within the body of each specific TU (RNAPBd). The profiles thus represent the relative recruitment of the factors to the TEC. Lines represent mean values across TUs with 1x standard deviation shown as semi-transparent ribbon. Data are from a single representative of two biological replicates. c Scatter plot depicting the correlation between Spt4/5Pr and TSS-RNA (n = 438). Data represent the mean of two biological replicates. d TSS-RNA length distribution correlates with TEC escape. Boxplots depicting the fraction of TSS-RNAs smaller than 50 nt for TUs with low, intermediate, and high RNAP escape. Boxplots represent median, interquartile ranges and Tukey-style whiskers. Statistical significance of the observed differences was tested using a one-sidedwilcoxon rank sum test. **p < 0.01. The number of TUs in each EI category was 35 (low EI), 109 (intermediate EI) and 56 (high EI). Data represent the mean of two biological replicates. e Scatter plots depicting the anticorrelation between Elf1 EI (mean of two biological replicates) and the relative load of aCPSF1 on the Elf1-bound TEC calculated as aCPSF1Pr to Elf1Pr ratio (geometric mean of two biological replicates, n = 212 genes). f Correlation of aCPSF1 load (aCPSFPr/Elf1Pr) to mRNA expression levels (mean of two biological replicates, n = 211 genes).
Fig. 4
Fig. 4. The CRISPR C promoter shows early pausing in vitro.
a Schematic overview of the cell lysate-based synchronised in vitro transcription system for S. solfataricus. Cell lysates were treated with shrimp alkaline phosphatase for NTP degradation before heat inactivation of the phosphatase. Linearised plasmid DNA containing a S. solfataricus promoter were added to allow PIC formation on the templates with inherent initiation factor TFB. Simultaneously with the addition of ribonucleotides to allow the PICs to initiate a single round of transcription, we added an excess of a recombinant TFB variant termed TFBc that blocks subsequent rounds of PIC formation. The generated transcripts were purified by affinity purification using immobilised 25 nt antisense oligonucleotides. b Synchronised in vitro transcription assay with two promoters showing high TEC escape (thsB and rps8e) and two promoters showing low TEC escape in vivo (dhg-1 and CRISPR C). Samples were withdrawn 15 s, 30 s and 45 s after simultaneous addition of 50 µM rNTPs including [α-32P]-UTP and TFBc. Purified radiolabelled transcripts were resolved on a denaturing polyacrylamide gel. The position of run-off transcripts and transcripts resulting from pausing in the promoter-proximal region is indicated. A representative experiment of three technical replicates is shown.
Fig. 5
Fig. 5. TEC escape changes during oxidative stress response.
a High escape TUs show reduced TEC escape under oxidative stress. Scatter plots comparing escape indices under exponential growth and oxidative stress conditions for 71 TUs accessible for analysis in both conditions. b Heatmap showing correlated changes in initiation factor occupancy, escape indices and RNA output between exponential growth and oxidative stress. Spearman rank correlations were calculated for protein-encoding TUs accessible for analysis in both conditions (n = 70). Correlations were calculated for the mean escape index and the geometric mean of all other values for two biological replicates. * denotes an adjusted p-value < 0.05 after multiple testing correction (Benjamini–Hochberg) and  p < 0.05 for two combinations of individual biological replicates tested. cf ChIP-seq profiles of the basal transcription machinery for four different promoters during exponential growth (Expon.), and oxidative stress (Oxid.): rrn (c), gdhA-4 (d), NuoB (e), and SSO8549 (f). Traces show mean occupancy for two biological replicates with the range depicted as semi-transparent ribbon.
Fig. 6
Fig. 6. DNA duplex stability around the TSS is linked to TEC escape.
a, b TEC escape is sensitive to DNA duplex stability around the TSS under oxidative stress. DNA duplex stability was calculated over a 7-bp sliding window for individual promoters and correlated with the escape indices for RNAP, Spt4/5 and Elf1 (mean of two biological replicates) under oxidative stress conditions (a) and during exponential growth (b). Selected TUs with mapped TSS were included (n = 93 for oxidative stress and n = 140 for exponential growth).
Fig. 7
Fig. 7. A model for the promoter-proximal elongation phase.
Schematic overview of the promoter-proximal elongation phase and the effect of TEC escape regulation on individual steps leading towards productive transcription. Low TEC escape is associated with the accumulation of PICs and the two different TEC intermediates TECSpt4/5 and TECSpt4/5-Elf1.

References

    1. Ehrensberger AH, Kelly GP, Svejstrup JQ. Mechanistic interpretation of promoter-proximal peaks and RNAPII density maps. Cell. 2013;154:713–715. doi: 10.1016/j.cell.2013.07.032. - DOI - PubMed
    1. Browning DF, Busby SJ. Local and global regulation of transcription initiation in bacteria. Nat. Rev. Microbiol. 2016;14:638–650. doi: 10.1038/nrmicro.2016.103. - DOI - PubMed
    1. Hahn S, Young ET. Transcriptional regulation in Saccharomyces cerevisiae: transcription factor regulation and function, mechanisms of initiation, and roles of activators and coactivators. Genetics. 2011;189:705–736. doi: 10.1534/genetics.111.127019. - DOI - PMC - PubMed
    1. Gressel, S. et al. CDK9-dependent RNA polymerase II pausing controls transcription initiation. Elife6, e29736 (2017). - PMC - PubMed
    1. Shao, W. & Zeitlinger, J. Paused RNA polymerase II inhibits new transcriptional initiation. Nat. Genet. 49, 1045–1051 (2017). - PubMed

Publication types

MeSH terms