. 2021 Sep 17;12(1):5512.
doi: 10.1038/s41467-021-25790-2.

ADAR-mediated RNA editing of DNA:RNA hybrids is required for DNA double strand break repair

Affiliations

ADAR-mediated RNA editing of DNA:RNA hybrids is required for DNA double strand break repair

Sonia Jimeno et al. Nat Commun. .

Abstract

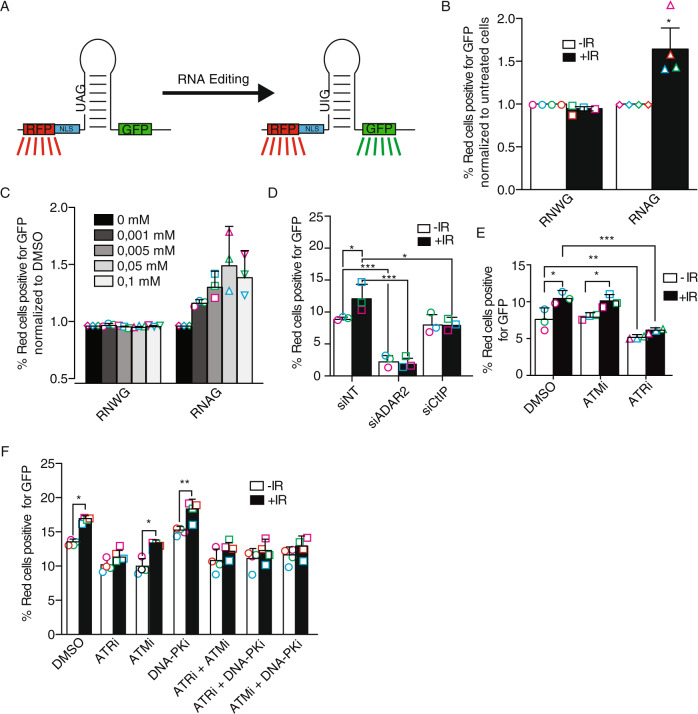
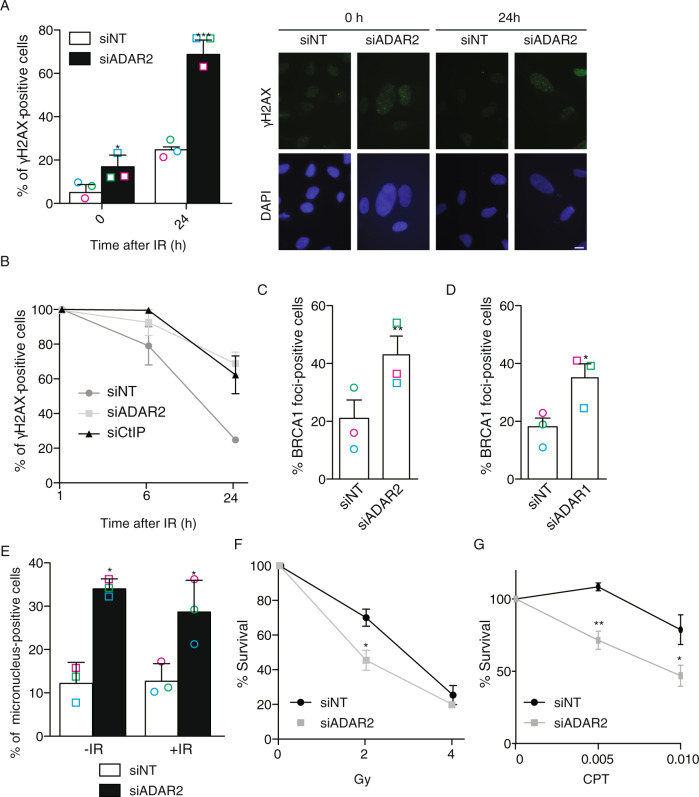
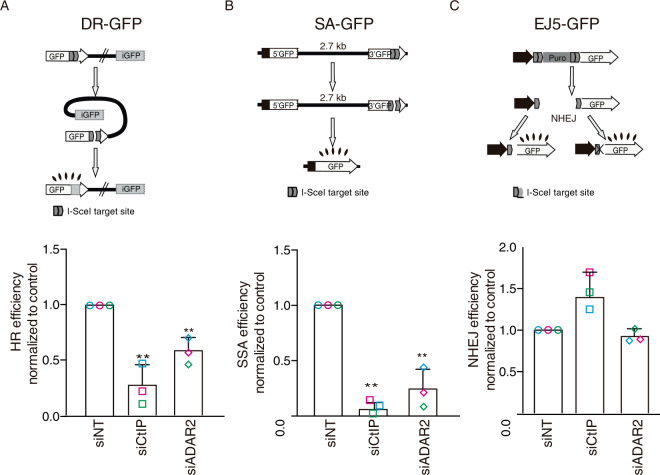
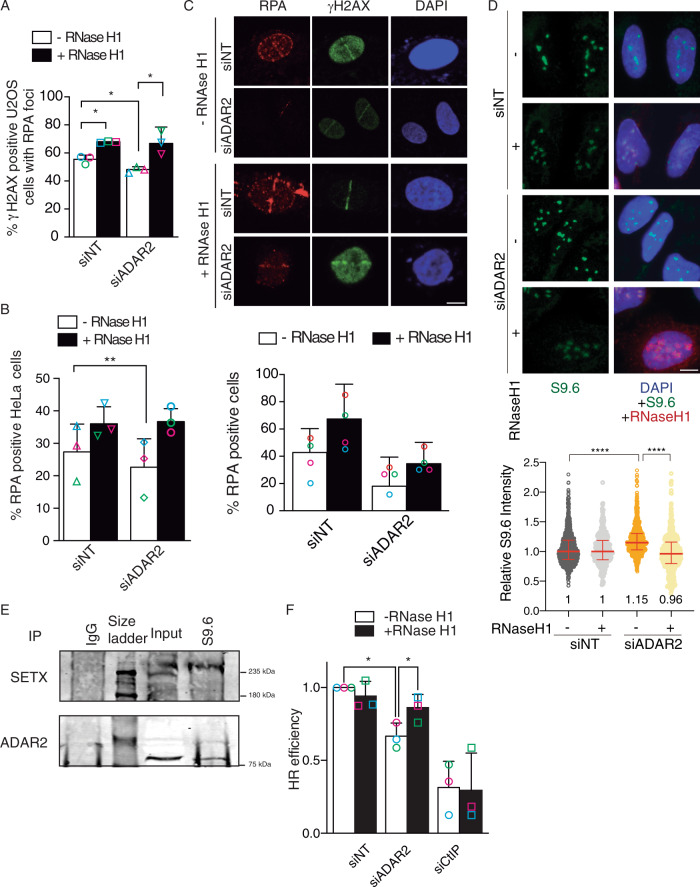
The maintenance of genomic stability requires the coordination of multiple cellular tasks upon the appearance of DNA lesions. RNA editing, the post-transcriptional sequence alteration of RNA, has a profound effect on cell homeostasis, but its implication in the response to DNA damage was not previously explored. Here we show that, in response to DNA breaks, an overall change of the Adenosine-to-Inosine RNA editing is observed, a phenomenon we call the RNA Editing DAmage Response (REDAR). REDAR relies on the checkpoint kinase ATR and the recombination factor CtIP. Moreover, depletion of the RNA editing enzyme ADAR2 renders cells hypersensitive to genotoxic agents, increases genomic instability and hampers homologous recombination by impairing DNA resection. Such a role of ADAR2 in DNA repair goes beyond the recoding of specific transcripts, but depends on ADAR2 editing DNA:RNA hybrids to ease their dissolution.


Conflict of interest statement

The authors declare no competing interests.

Figures

Fig. 1
Fig. 1. DNA damage increases RNA editing.
A Scheme of the RNAG editing system. A bi-cistronic mRNA containing the RFP and GFP sequences is produced. The presence of a stop codon impedes the expression of the GFP ORF, except when the adenine is edited to inosine. The presence of a secondary structure containing such stop codon allows its recognition and deamination of the adenine by ADAR proteins. B DNA damage-induced RNA editing. The plot shows the percentage of cells bearing the RNAG reporter or the constitutively edited RNWG system that express both the RFP (red cells) and GFP (green cells). Cells were either irradiated (+IR; 10 Gy; black bars) or mock-treated (–IR; white bars) and incubated for 12 h. The percentage of green cells over 10.000 red cells were analyzed on BD FACSAriaTM using FACSDiva v5.0.3 software. For each reporter, the ratio of green and red cells was normalized with the untreated conditions. Statistical significance was determined with a two-tailed paired Student’s t-test. C Same as B, but cells were treated with the indicated concentration of camptothecin (CPT). D Cells bearing the RNAG reporter were transfected with the indicated siRNAs and irradiated or not, and the percentage of red cells that were also green is plotted. Statistical significance was determined with a two-way ANOVA. E Same as D, but cells were pretreated for 2 h with 10 μM of inhibitors of ATM (ATMi), ATR (ATRi), or DMSO as control, previous to the irradiation. Cells were collected to check for editing levels 10 h after irradiation. The inhibitors were kept for the duration of the experiment. Statistical significance was determined with a two-way ANOVA. F Same as E, but, cells were also treated with DNA–PK inhibitor (DNA–PKi), as well as the double combinations of the ATM, ATR, and DNA–PK inhibitors, as indicated. Statistical significance was determined with a two-way ANOVA. The average and the standard deviation of the medians of four (panels B and F) or three (panels C–E) independent experiments are shown. Each individual replica is marked with a colored symbol. One, two, or three asterisks represent p < 0.05, p < 0.01, or p < 0.001, respectively. Actual p-values can be found in the Source data file. Only biological relevant comparisons are shown.
Fig. 2
Fig. 2. ADAR2 depletion causes genetic instability and DNA repair defects.
A Percentage of cells positive for γH2AX foci upon spontaneous accumulation (0 h) or 24 h post irradiation with 10 Gy in U2OS cells transfected either a siRNA against ADAR2 or with control siNT. Quantification is shown on the left. A representative image is shown on the right. Scale bars represent 10 µm. B Repair kinetics is shown as the disappearance of γH2AX foci 1, 6, and 24 h post irradiation with 10 Gy in U2OS cells transfected either a siRNA against ADAR2, CtIP or with control siNT. C Percentage of spontaneous BRCA1 foci-positive cells in cells transfected with either a siRNA against ADAR2 or with control siNT. The average and SD of three independent experiments is shown. D Same as C but in cells depleted for ADAR1. E Percentage of cells positive for micronucleus without exposure to DNA damage (-IR) or 24 h post irradiation with 10 Gy (+IR) in U2OS cells transfected either with a siRNA against ADAR2 or with control siNT. Other details as in (A). F Clonogenic assays of U2OS cells depleted with a siRNA against ADAR2 or with control siNT after treatment with different doses of IR. Other details as in (A). G Same as F but cells treated with camptothecin (CPT; μM; right). In all panels, the average and SD of three independent experiments are shown and statistical significance was determined with a two-tailed paired Student’s t-test. Each individual replica is marked with a colored symbol. One, two, or three asterisks represent p < 0.05, p < 0.01, or p < 0.001, respectively. Actual p-values can be found in the Source data file. Only biological relevant comparisons are shown.
Fig. 3
Fig. 3. ADAR2 depletion affects homologous recombination.
A Effect of ADAR2 depletion in the DR-GFP reporter. A scheme of the reporter is shown on the top. Induction of a DSB using I-SceI meganuclease renders GFP-positive cells when the donor repeat (iGFP) is used in a gene conversion event. The efficiency of classical recombination (HR) was calculated as the percentage of GFP-positive cells in response to I-SceI expression upon downregulation of the indicated genes and normalized with the control. The average and standard deviation of at least three independent experiments are shown. B Same as A but using the Single Strand Annealing (SSA) reporter SA-GFP (top). In this case, the induction of a DSB located between two repeats in direct orientation will render GFP-positive cells only when intramolecular SSA takes place. C Same as A but using the non-homologous end-joining (NHEJ) reporter EJ5-GFP (Top). In this case, two I-SceI-induced DSBs could be repaired by conservative or mutagenic NHEJ granting the accumulation of functional GFP. In all panels, the average and SD of three independent experiments are shown and statistical significance was determined with a two-tailed paired Student’s t-test. Each individual replica is marked with a colored symbol. One, two, or three asterisks represent p < 0.05, p < 0.01, or p < 0.001, respectively. Actual p-values can be found in the Source data file. Only biological relevant comparisons are shown.
Fig. 4
Fig. 4. ADAR depletion impairs in DNA resection.
A DNA resection proficiency after 10 Gy of irradiation in U2OS cells measured as the percentage of RPA foci-positive cells in cells transfected either with siRNAs against ADAR1, ADAR2, ADAR3, CtIP or with control siNT. The average and SD of three independent experiments are shown. Each individual replica is marked with a colored symbol. Significance was determined by two-tailed Student’s t-test comparing each condition to siNT cells. *P < 0.05. Actual p-values can be found in the Source data file. Representative images of the experiments are shown on Supplementary Fig. 3A. B DNA resection proficiency measured as the percentage of RPA foci-positive cells in U2OS cells expressing either GFP-ADAR2 wild type or a catalytically dead version of the protein (ADAR2 E/A) transfected either with a siRNA against the 3'UTR of ADAR2 (black boxes) or a control siNT-UTR (white boxes). Each individual replica is marked with a colored symbol. Significance was determined by two-tailed Student’s t-test comparing each condition to siNT cells. *P < 0.05. Actual p-values can be found in the Source data file. Other details as in (A). C RPA foci formation upon in U118 cells treated with 10 Gy of radiation in cells expressing either GFP, GFP-ADAR2 wild type or a catalytically dead version of the protein. Each individual replica is marked with a colored symbol. Significance was determined by two-tailed Student’s t-test. ***P < 0.001. Actual p-values can be found in the Source data file. Other details as in (A). D DNA resection proficiency was measured as RPA stripes-positive cells upon laser microirradiation in cells transfected either an siRNA against ADAR2, CtIP or with control siNT. The average and SD of four independent experiments are shown. Each individual replica is marked with a colored symbol. Representative images of the experiments are shown on the right. Scale bars represent 10 µm. Significance was determined by two-tailed Student’s t-test comparing each condition to siNT cells. **P < 0.01; ***P < 0.001. Actual p-values can be found in the Source data file. Other details as in (A). E Resection length measured with the SMART assay using DNA fibers extracted from U2OS downregulated for ADAR2. A non-target siRNA (siNT) was used as control. One out of three representative experiment with similar results is shown. Significance was determined by two-tailed Student’s t-test comparing. ***P < 0.001. Actual p-values can be found in the Source data file. Other details as in (A). F RNA sequencing of U118 cells complemented with a plasmid bearing wild type ADAR2, catalytically dead ADAR2 E/A or the empty vectors in untreated conditions (black bars) or upon exposure to 10 Gy of ionizing radiation (white bars) was used to analyze the changes in RNA sequence of codons known to be edited by ADAR2. The Recoding Editing Index (REI) was reported as percentage. The average of two independent experiments is shown. Each individual replica is marked with a colored symbol. G U2OS cells bearing GFP-ADAR2 or GFP, as a control, were micro-irradiated using a laser as described in the methods section. Cells were fixed at the indicated time points and the presence of γH2AX (red) or ADAR2 (green) at lasers stripes was analysed. Representative images out of three independent experiments are shown. Scale bars represent 10 µm.
Fig. 5
Fig. 5. The connection of DNA resection defect with R-loop increase.
A DNA resection proficiency measured as the percentage of RPA foci-positive cells after 1 h of 10 Gy of irradiation in cells U2OS transfected either with a siRNA against ADAR2 or with control siNT and transfected either with RNaseH1 overexpression plasmid (black) or with the control empty plasmid (white). The plot shows the percentage of cells positive for RPA foci and the average and standard deviation of at least four independent experiments. For each replicate, at least 200 cells were measured. The average and standard deviation of three independent experiments is shown. Each individual replica is marked with a colored symbol. Significance was determined by two-tailed Student’s t-test comparing each condition to siNT cells. *P < 0.05. Actual p-values can be found in the Source data file. Other details as Fig. 4A. B Same as A, but in HeLa cells. The average and standard deviation of three independent experiments is shown. Each individual replica is marked with a colored symbol. Significance was determined by two-tailed Student’s t-test comparing each condition to siNT cells. **P < 0.01. Actual p-values can be found in the Source data file. C HeLa cells were transfected with the indicated siRNAs and plasmids and micro-irradiated with a laser to induce DNA damage. Representative images are shown on top. Scale bars represent 10 µm. The percentage of cells positive for RPA recruitment to DSB are plotted below the images. The graph shows the average and standard deviation of four independent experiments. At least 20 cells per replica were studied and the number of stripes was analyzed using FIJI software. D Accumulation of RNA–DNA hybrids in ADAR2-depleted cells. U2OS cells transfected with siNT and siADAR2 and bearing the pcDNA3-RNaseH1 or pCDNA3 empty vector were immunostained to detect DNA:RNA hybrids using the S9.6 antibody. Relative S9.6 signal intensity per nucleus in U2OS cells with or without overexpression of RNaseH1 was calculated (bottom). The median with interquartile range obtained from three independent experiments for each population is shown. Statistical significance was calculated using a two-sided Mann–Whitney U test. Actual p-values can be found in the Source data file. One significant experiment out of three is shown. Scale bars represent 10 µm. E Protein samples from U2OS cells were immunoprecipitated using the anti-DNA:RNA hybrid S9.6 antibody or a non-related IgG as a control. Inputs and immunoprecipitates were resolved in SDS-PAGE and blotted for ADAR2 and Senataxin, as indicated. A representative western blot, out of three independent replicas, is shown. Source data are provided in the Source data file. F Effect of RNaseH1 overexpression in the ADAR2-mediated impairment of homologous recombination (HR). U2OS cells bearing the DR-GFP reporter were transfected with either a siRNA against ADAR2 or with control siNT and either with RNAseH1 overexpression plasmid (white) or with the control empty plasmid (black). The efficiency of classical recombination was calculated as the percentage of GFP-positive cells in response to I-SceI expression upon down-regulation of the indicated genes and normalized with the control. The average and standard deviation of three independent experiments are shown. Each individual replica is marked with a colored symbol. Significance was determined by paired two-tailed Student’s t-test comparing each condition to siNT cells. *P < 0.05. Actual p-values can be found in the Source data file. Other details as in Fig. 3A.
Fig. 6
Fig. 6. DNA:RNA hybrid stabilization impairs resection.
A Percentage of RPA foci-positive cells in cells transfected either with a siRNA against SETX or with control siNT. The average and standard deviation of four independent experiments is shown. Each individual replica is marked with a colored symbol. Significance was determined by paired two-tailed Student’s t-test comparing each condition to siNT cells.*P < 0.05. Actual p-values can be found in the Source data file. Other details are as in Fig. 4A. B DNA resection proficiency is measured as the length of resected DNA with SMART in cells transfected either with a siRNA against SETX or with control siNT. Other details as in Fig. 4E. C Percentage of BRCA1 foci-positive cells in cells transfected either with a siRNA against SETX or with control siNT. The average and standard deviation of four independent experiments are shown. Each individual replica is marked with a colored symbol. Significance was determined by paired two-tailed Student’s t-test comparing each condition to siNT cells. **P < 0.01. Actual p-values can be found in the Source data file. Other details as in Fig. 1C. D Protein samples from U2OS cells were immunoprecipitated using an anti-BRCA1 antibody or a non-related IgG as a control, in cells irradiated (+IR; right) or not (-IR; left). Inputs and immunoprecipitates (IP) were resolved in SDS-PAGE and blotted for BRCA1, ADAR1, ADAR2, and Senataxin, as indicated. A representative western blot, out of four independent replicas, is shown. Source data are provided in the Source data file. E Protein samples from U2OS cells were immunoprecipitated using an anti-ADAR2 antibody or a non-related IgG as a control, in non-irradiated cells. Inputs and immunoprecipitates were resolved in SDS-PAGE and blotted for BRCA1, ADAR2, SETX and Ku80 as indicated. A representative western blot, out of three independent experiments, is shown. Source data are provided in the Source data file. F Protein samples from U2OS cells were immunoprecipitated using an anti-Senataxin antibody or a non-related IgG as a control, in non-irradiated cells. Inputs and immunoprecipitates were resolved in SDS-PAGE and blotted for Senataxin and ADAR2, as indicated. A representative western blot, out of three, is shown. Source data are provided in the Source data file. G Protein samples from U2OS cells were immunoprecipitated using an anti-SETX antibody or a non-related IgG as a control, in non-irradiated cells. Inputs and immunoprecipitates were resolved in SDS-PAGE and blotted for ADAR2 and SETX as indicated. A representative western blot, out of three independent experiments, is shown. H A schematic representation of how ADAR2 might help resection. 1 DNA:RNA hybrids might appear close to DSBs, either because they were already formed there or specifically formed upon DNA damage. Those hybrids will block resection progression. 2 The formation of some ssDNA by CtIP will activate the ATR branch of the checkpoint, that in turn will stimulate the activity of ADAR2 at DNA:RNA hybrids, including those close to DNA breaks. 3 ADAR2 activity will create mismatches in the DNA:RNA pairing (red tilde), facilitating the dissolution of those structures by SETX–BRCA1. 45 Once the DNA:RNA hybrids are eliminated, resection can proceed unimpeded.

References

    1. Jackson SP, Bartek J. The DNA-damage response in human biology and disease. Nature. 2009;461:1071–1078. doi: 10.1038/nature08467. - DOI - PMC - PubMed
    1. Davis AJA, Chen DDJ. DNA double strand break repair via non-homologous end-joining. Transl. Cancer Res. 2013;2:130–143. - PMC - PubMed
    1. Jasin, M. & Rothstein, R. Repair of strand breaks by homologous recombination. Cold Spring Harb. Perspect. Biol.5, https://pubmed.ncbi.nlm.nih.gov/24097900 (2013). - PMC - PubMed
    1. Symington, L. S. et al. End Resection at Double-Strand Breaks: Mechanism and Regulation End Resection at Double-Strand Breaks: Mechanism and Regulation. 10.1101/cshperspect.a016436 (2014). - PMC - PubMed
    1. Cejka P. DNA end resection: nucleases team up with the right partners to initiate homologous recombination. J. Biol. Chem. 2015;290:22931–22938. doi: 10.1074/jbc.R115.675942. - DOI - PMC - PubMed

Publication types

MeSH terms