. 2021 Sep 17;12(1):5505.
doi: 10.1038/s41467-021-25728-8.

MAPK-pathway inhibition mediates inflammatory reprogramming and sensitizes tumors to targeted activation of innate immunity sensor RIG-I

Affiliations

MAPK-pathway inhibition mediates inflammatory reprogramming and sensitizes tumors to targeted activation of innate immunity sensor RIG-I

Johannes Brägelmann et al. Nat Commun. .

Abstract

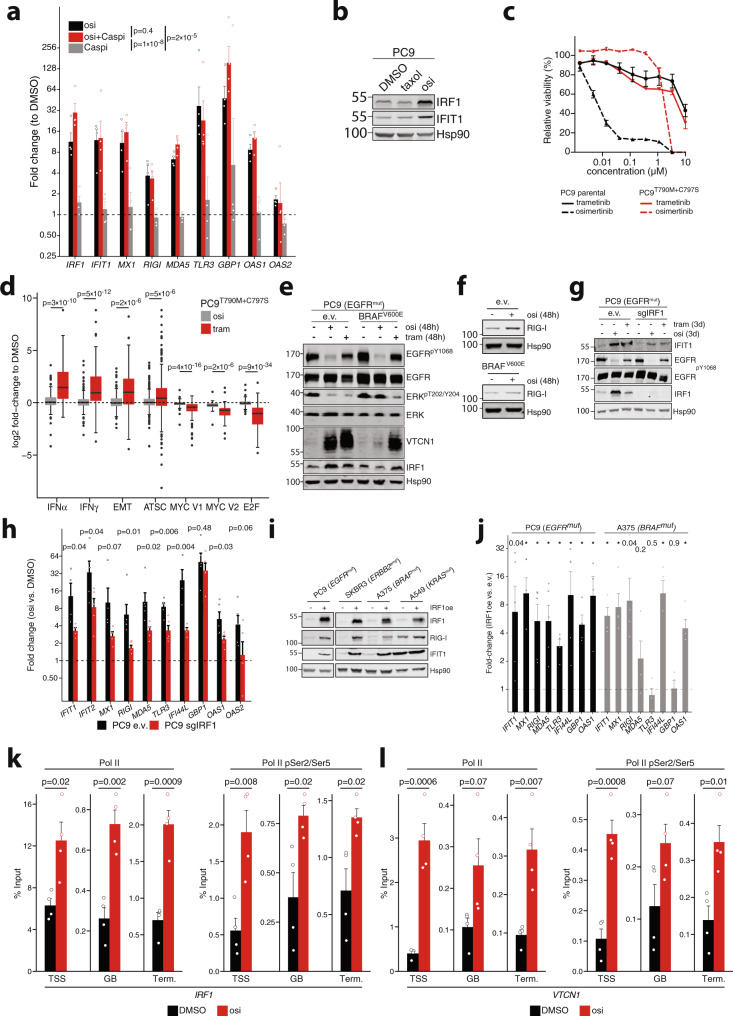
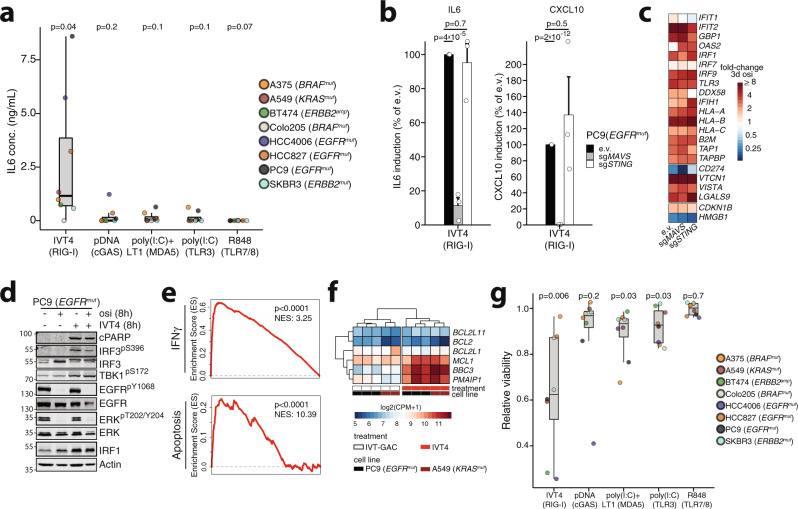
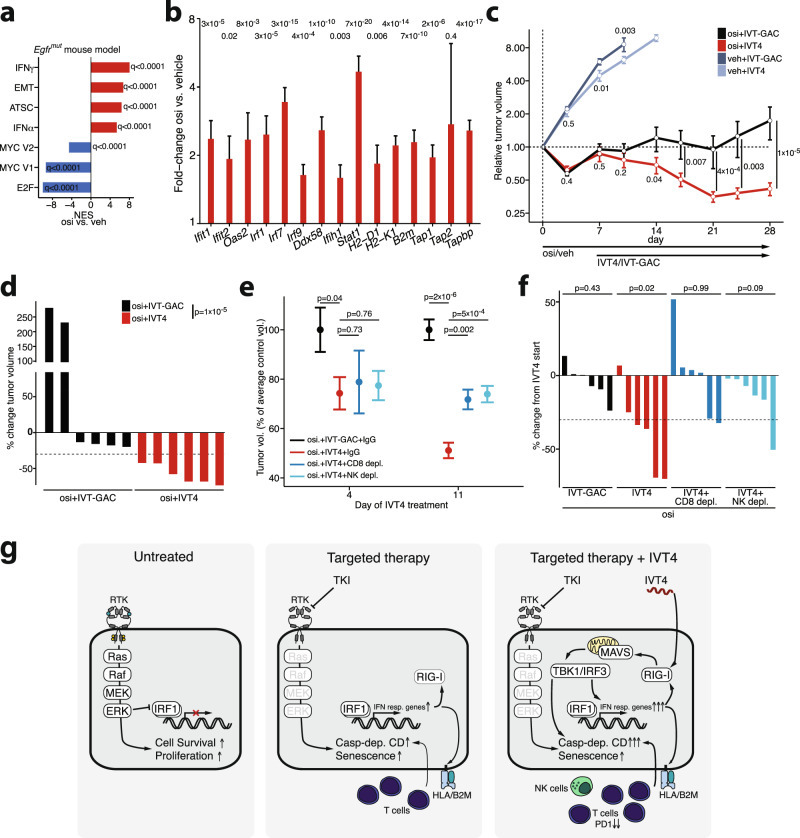
Kinase inhibitors suppress the growth of oncogene driven cancer but also enforce the selection of treatment resistant cells that are thought to promote tumor relapse in patients. Here, we report transcriptomic and functional genomics analyses of cells and tumors within their microenvironment across different genotypes that persist during kinase inhibitor treatment. We uncover a conserved, MAPK/IRF1-mediated inflammatory response in tumors that undergo stemness- and senescence-associated reprogramming. In these tumor cells, activation of the innate immunity sensor RIG-I via its agonist IVT4, triggers an interferon and a pro-apoptotic response that synergize with concomitant kinase inhibition. In humanized lung cancer xenografts and a syngeneic Egfr-driven lung cancer model these effects translate into reduction of exhausted CD8+ T cells and robust tumor shrinkage. Overall, the mechanistic understanding of MAPK/IRF1-mediated intratumoral reprogramming may ultimately prolong the efficacy of targeted drugs in genetically defined cancer patients.


Conflict of interest statement

M.L.S. is a founder and shareholder of PearlRiver Bio (now part of Centessa Pharmaceuticals) and received consulting honoraria from PearlRiver Bio. M.L.S. receives research funding from PearlRiver Bio and Novartis. R.B. is an employee of Targos Molecular Pathology. H.L. is an employee of CrownBiosciences. G.H. is co‐founder of Rigontec GmbH. M.S. is listed as inventor on a patent application covering RIG-I activating structures. R.K.T. is founder of PearlRiver Bio (now part of Centessa Pharmaceuticals), founder of NEO New Oncology (now part of Siemens Healthcare), consulting honoraria from PearlRiver Bio and NEO New Oncology. K.O. received research funding from Boehringer Ingelheim, Novartis, AstraZeneca, Eli Lilly, and Daiichi-Sankyo outside the submitted work. K.O. reports honoraria from AstraZeneca, MSD and Chugai pharmaceutical outside the submitted work. The other authors declare no competing interests.

Figures

Fig. 1
Fig. 1. Kinase inhibition induces senescence-associated inflammatory signaling.
a Core gene set of a combined gene set enrichment analysis (GSEA) in oncogene-driven cancer cell lines (PC9, HCC827, HCC4006, H1993, H3122, A375, Colo205) after 3 days of treatment with their respective kinase inhibitor. b Cell count of EGFRmut PC9 cells under osimertinib (osi, 300 nM). The upper line indicates normalized cell number, shaded areas corresponding cell cycle distribution (n = 3). Inset: Immunoblot of cell cycle regulator genes in PC9 cells after 5 days of osimertinib treatment. c, d GSEA of time-series RNAseq in EGFRmut cells indicates temporal adaptation processes (ATSC = adult tissue stem cell gene set, NES = Normalized enrichment score). e GSEA of the ATSC and the IFNα gene set across the two EGFRmut PDX models (osi vs. vehicle). f Schematic of the humanized mouse model (top) and exemplary histology of low (−), medium (+), and high (++) CD8 T cell infiltration (bottom). Scale bar 100 µm, representative images of in total n = 19 tumors of n = 10 mice. g Digital pathology-based quantification of T cell infiltration in humanized mice following 4 days of treatment with osimertinib (5 mg/kg, n = 9 tumors) or vehicle (n = 10 tumors) (error bars indicate mean ± SEM). h Hyperion imaging mass cytometry false-color image of an osimertinib treated tumor from (f) stained for pan-cytokeratin (CK, cyan), CD8 (green), and Granzyme B (red). The overlay of CD8 and red is colored yellow. Scale bar 100 µm, representative image of n = 6 regions. i Flow cytometry analysis of infiltrating T cells in humanized PC9 xenografts after 4 days of treatment (in total n = 6 tumors of n = 3 mice per group; error bars indicate mean ± SEM). j RNA-seq-based GSEA of public BRAFmut melanoma patient data, comparing patients before (Pre-treatment) with patients during BRAF or BRAF + MEK inhibition (On-treatment). k Proportion of CD8 T cell infiltration inferred from bulk RNA-seq in the melanoma patients from (j) sequenced before (Pre, n = 11) or during (On, n = 11) kinase inhibition or after resistance (Resist, n = 10) had developed. l Cytolytic activity as the geometric mean of granzyme A and perforin RNA expression in patients from (j). Significance was calculated by t tests in (g), (i), (k) (l) and Kolmogorov–Smirnov-based permutation test as FDR-corrected q-values in (a), (e), (j). All tests are two-sided. Boxplots display median (center line), 25th/75th percentile (lower/upper box hinges), whiskers extend to the most extreme value within 1.5× interquartile range (IQR) of the hinges. Source data are provided as a Source Data file.
Fig. 2
Fig. 2. MAPK-pathway mediates inflammatory signaling and immune escape.
a Fold-changes by RNAseq expression analysis following 3 days kinase inhibitor treatment in oncogene-driven cancer cell lines. b Fold-changes in BRAFmut melanoma patients sequenced before (Pre) or during (On) kinase inhibition or after resistance (Resist) to BRAF or BRAF + MEK inhibition. c Fold-changes in primary cells derived from a KRASmut PDAC GEMM after 48 h treatment with trametinib compared to controls. d Left: Immunoblot of key inflammatory signaling nodes in EGFRmut PC9 cells treated for 12 or 24 h with osimertinib (osi, 300 nM) or trametinib (tram, 100 nM). Right: Immunoblot of treated KRASmut A549 (trametinib, 100 nM) and BRAFmut A375 (vemurafenib, 1 µM) for 3 days. Each representative blot of n = 3 independent experiments. e FACS estimation of surface expression in EGFRmut cells following 3 days treatment with osimertinib (300 nM) or trametinib (100 nM). mean fluorescent intensity (MFI) as fold-change normalized to DMSO controls. Bars display mean ± SEM of independent biological replicates (PC9 B2M/HLA: osi n = 10, tram n = 5; VTCN1: osi n = 5, tram n = 8; HCC827 B2M/HLA: osi/tram n = 4, VTCN1 osi n = 3, tram n = 4; HCC4006 HLA/B2M osi n = 6, tram n = 3, VTCN1 osi/tram n = 3); P-values adjusted by Benjamini–Hochberg. f Combined GSEA of RNA-seq from PC9, HCC827 and HCC4006 cells treated with trametinib (100 nM, 72 h). (Significance as FDR-corrected q-values). g Pairwise correlations of single-sample (ss) GSEA scores for key gene sets in RNA-seq of untreated BRAFmut melanoma patients (n = 14, top) or TCGA lung adenocarcinoma patients (LUAD, n = 515, bottom). Color indicates Pearson correlation coefficients. h Left: Correlation of RNA-seq inferred CD8 T cell infiltration with an expression of the negative MAPK feedback regulator DUSP6 in untreated BRAFmut melanoma patients (n = 11) (TPM = transcripts per million). Right: Distribution of individual correlations of CD8 T cell proportion with an extended set of MAPK activity genes in patients from (b and Fig. 1k). Distribution of the n = 10 genes’ correlation coefficients with CD8 T cell proportion was tested for significance using one-sample t tests adjusted with Bonferroni–Holm. i Left: Correlation of RNA-seq-based CD8 T cell infiltration with DUSP6 in untreated TCGA lung adenocarcinoma patients (n = 350) grouped as n = 10 patients per bin and normalized expression/CD8 T cell proportion as median per bin. Right: Correlation of CD8 T cell proportion with genes of the extended n = 10 MAPK genes in unbinned patients (n = 350). Significance was calculated with two-sided paired t tests for log fold-changes (e) and one-sample t tests in (h, right) and (i, right). Spearman correlation was used in (h, i). Boxplots display median (center line), 25th/75th percentile (lower/upper box hinges), whiskers extend to the most extreme value within 1.5× interquartile range (IQR) of the hinges. Data points beyond the whiskers are displayed individually. Source data are provided as a Source Data file.
Fig. 3
Fig. 3. Inflammatory transcription is driven by the MAPK–IRF1 axis.
a RT-qPCR analysis of IFN-target genes of PC9 cells treated with osi (300 nM), Caspase inhibitor (Caspi; Q-VD-OPH, 10 µM) or a combination of both for 72 h. Fold-change compared to DMSO controls (mean ± SEM of n = 4 independent biological replicates). b Immunoblot of PC9 cells treated with osi (300 nM) or taxol (30 nM) for 48 h. Representative image of n = 3 independent experiments. c Viability of treated parental PC9 and CRISPR-edited PC9T790M+C797S (72 h, mean ± SEM of n = 3 independent biological replicates). d RNA-seq-based expression changes in relevant gene sets in treated vs. control PC9T790M+C797S (72 h with n = 2 replicates across n = 2 conditions). Boxplots display median (center line), 25th/75th percentile (lower/upper box hinges), whiskers extend to the most extreme value within 1.5× interquartile range (IQR) of the hinges. Data points beyond the whiskers are displayed individually. e, f Immunoblots of PC9-e.v. control or PC9-BRAFV600E cells following 48 h treatment with osimertinib or trametinib. Representative images of n = 3 independent experiments each. g Immunoblot of PC9 carrying lentiCRISPRv2 empty vector (e.v.) or an IRF1-KO (sgIRF1). h RT-qPCR analysis in osimertinib treated (300 nM, 72 h) cells from (g). Fold-changes were calculated as 2^ddCt compared to DMSO control and normalized to GAPDH. Mean ± SEM of independent biological replicates (n = 4 MX1, IFIT1, IFI44L, n = 5 other genes). i Immunoblot after transfection with IRF1 overexpression (oe) or empty vector (e.v.) plasmid for 72 h. Representative image of n = 4 independent experiments. j RT-qPCR analyses after 72 h IRF1 overexpression in PC9 and A375 (n = 5 and n = 4 independent transfection experiments, respectively). Fold-changes are calculated as 2^ddCt compared to e.v. control and normalized to GAPDH, Benjamini–Hochberg corrected p-values shown, *p = 0.02; Bars indicate mean ± SEM. k, l ChIP-qPCR analysis of total Pol II or phosphorylated Pol II pSer2/5 RNA Pol II binding to the transcription start site (TSS), gene body (GB) and transcription termination site (Term.) of IRF1 and VTCN compared to input control after 72 h osimertinib (300 nM) or DMSO treatment (n = 4 independent biological replicates, mean ± SEM). Significance of global treatment differences calculated on log-fold changes using Tukey-post hoc test after two-way ANOVA adjusting for gene-specific effects in (a). Significance calculated by two-sided t tests on log-fold changes with Benjamini–Hochberg adjustment for multiple testing in (d, j) and by two-sided t tests in (h, k, l). Source data are provided as a Source Data file.
Fig. 4
Fig. 4. Nucleic acid receptor agonists induces cytokine secretion and impairs cell growth in oncogene-driven cancer cells.
a ELISA of IL6 secretion from oncogene-driven cells following stimulation with NAR agonists for 16 h. (points indicate mean of n = 3 independent replicates per cell line) Boxplots display median (center line), 25th/75th percentile (lower/upper box hinges), whiskers extend to the most extreme value within 1.5× interquartile range (IQR) of the hinges. b Secretion of IL6 and CXCL10 in PC9 cells carrying CRISPRv2 e.v. or with a MAVS or STING sgRNA after 16 h stimulation with RIG-I agonist IVT4 (1 ng/µL) (mean ± SEM of n = 3 independent biological replicates). c RNA-seq based expression of IFN target genes in cells from (b) treated with osimertinib (300 nM, 3d) compared to DMSO controls. d Immunoblot following osimertinib or IVT4 treatment (1 ng/µL) (cPARP = cleaved PARP). Representative image of n = 3 biological replicates. e GSEA analysis of joint differential expression analysis for RNA-seq of PC9 and A549 cells after 8 h IVT4 treatment (1 ng/µL) compared to control (NES = normalized enrichment score, FDR-adjusted q-values of Kolmogorov–Smirnov-based permutation test shown). f Expression of apoptosis-related genes in IVT4-treated cells from e (CPM = count per million). g Relative viability of cancer cell lines stimulated with innate immunity agonists for 16 h measured with MTT assay (normalized to controls) (points indicate mean of n = 3 independent biological replicates per cell line and agonist). Boxplots display median (center line), 25th/75th percentile (lower/upper box hinges), whiskers extend to the most extreme value within 1.5× interquartile range (IQR) of the hinges. Significance was calculated by one-sample t tests (a, g) and two-sample t tests (b). All tests are two-sided. Source data are provided as a Source Data file.
Fig. 5
Fig. 5. Targeted kinase-inhibition enhances NAR agonist-induced cell death.
a Flow-cytometric analysis of cell death induction following 24 h treatment of PC9 cells carrying CRISPRv2 e.v. or sgMAVS with DMSO/osimertinib (300 nM) and IVT4/IVT-GAC (1 ng/µL) (vertical axis displays the normalized percentage of AnnexinV and/or PI-positive cells = % non-viable cells) (mean ± SEM of independent experiments with n = 3 osi + IVT4, n = 4 other treatments). b CTG assay for cell lines pre-treated (48 h) with trametinib (tram, 100 nM) or vemurafenib (vem, 1 µM) and subsequent addition of IVT4/IVT-GAC (1 ng/µL) for 24 h. Viability was normalized to respective IVT-GAC controls (mean ± SEM log10 viability of independent experiments: n = 3 A549, vem A375, Colo205, and n = 4 otherwise). c Flow-cytometric analysis of cell death induction for cell lines pre-treated (48 h) with trametinib (100 nM) or vemurafenib (1 µM) and subsequent addition of IVT4/IVT-GAC (1 ng/µL for 24 h (vertical axis displays the normalized percentage of AnnexinV and/or PI-positive cells = % cell death) (mean ± SEM of independent biological replicates for A375 n = 4, A549 n = 5, Colo205 n = 3). d Flow-cytometric analysis of cell death induction in PC9 cells transfected for 48 h with IRF1 or e.v. followed by the addition of IVT4/IVT-GAC (1 ng/µL) for 24 h (vertical axis displays the percentage of AnnexinV and/or PI-positive cells = Cell death %) (mean ± SEM of n = 3 independent experiments). e Humanized PC9 xenografts treated with osimertinib or vehicle p.o. followed by IVT4 or control IVT-GAC i.t. as shown in the schematic (left, n = 5 mice per arm inoculated with 2 tumors per mouse). Relative tumor volumes are shown on the right (mean ± SEM of tumors treated with osi-IVT4 (n = 9), osi-IVT-GAC (n = 8), veh-IVT4 (n = 6), veh-IVT-GAC (n = 6)). f Flow-cytometry of tumor-infiltrating CD4 and CD8 lymphocytes for TIM3 and PD1 expression after 4 days osimertinib and 6 days IVT4/IVT-GAC. (each data point = one of n = 4 tumors per group, error bars represent mean ± SEM). g Tumor volumes at study end compared to treatment start in mice from (e) (each bar = one tumor). h GSEA on RNA-seq of xenograft tumors in humanized mice after pre-treatment with osimertinib and IVT4/IVT-GAC. (FDR-adj. q-values). Significance was calculated by t tests (a, e) and paired t tests (b) adjusted for multiple testing with Bonferroni–Holm method; ANOVA with Tukey post-hoc tests (c, f), two-way ANOVA adjusting for the mouse in osi or vehicle groups (f) and two-way ANOVA with Tukey post hoc tests (d, g). All tests are two-sided. Source data are provided as a Source Data file.
Fig. 6
Fig. 6. Combined kinase inhibitor and RIG-I agonist treatment in an EGFRmut syngeneic mouse model.
a RNA-seq followed by GSEA of Egfrmut syngenic mouse models comparing all control mice (0 days, 10 days vehicle; n = 4) vs. all osi treated mice (4 days, 10 days; n = 4). Two mice per treatment time-point, one tumor per mouse analyzed (in total n = 8 mice). b RNA-seq analysis of inflammatory gene s for mice from (a) comparing all control (0 days, 10 days vehicle) vs. all osi-treated mice (bar height indicates fold-change from differential expression analysis, error bar: standard error of the fold-change; FDR-adjusted q-values shown). c Relative tumor volumes of syngenic Egfrmut mice treated with osimertinib or vehicle p.o. subsequent addition of IVT4 or IVT-GAC i.t. (mean ± SEM of n = 6 tumors per group). d Change of individual tumor volumes in mice from (c). e Relative tumor volumes of syngeneic Egfrmut mice treated with osimertinib and IVT4/IVT-GAC with the addition of depleting antibodies for CD8 or NK cells or IgG control. Volumes were normalized to the average of the control group per time point (mean ± SEM of n = 6 tumors per group). f Individual tumor volumes from (f) at tumor harvest displayed as percent of their volume at the start of IVT4/IVT-GAC (one bar = one tumor, max. 2 per mouse). g Schematic of the proposed processes driving the response to tyrosine kinase inhibition (TKI) and IVT4 treatment (Casp-dep. CD = Caspase-dependent cell death, RTK = receptor tyrosine kinase). Significance was calculated as FDR-adjusted q-values (a, b), by two-way ANOVA adjusting for the mouse in osi or vehicle groups (c, d), two-sample t tests (e), and one-sample t tests (f). All tests are two-sided. Source data are provided as a Source Data file.

References

    1. Soria J-C, et al. Osimertinib in untreated EGFR-mutated advanced non-small-cell lung cancer. N. Engl. J. Med. 2018;378:113–125. doi: 10.1056/NEJMoa1713137. - DOI - PubMed
    1. Flaherty KT, et al. Combined BRAF and MEK inhibition in melanoma with BRAF V600 mutations. N. Engl. J. Med. 2012;367:1694–1703. doi: 10.1056/NEJMoa1210093. - DOI - PMC - PubMed
    1. Hyman DM, et al. Vemurafenib in multiple nonmelanoma cancers with BRAFV600 mutations. N. Engl. J. Med. 2015;373:726–736. doi: 10.1056/NEJMoa1502309. - DOI - PMC - PubMed
    1. Sharma SV, et al. A chromatin-mediated reversible drug-tolerant state in cancer cell subpopulations. Cell. 2010;141:69–80. doi: 10.1016/j.cell.2010.02.027. - DOI - PMC - PubMed
    1. Russo M, et al. Adaptive mutability of colorectal cancers in response to targeted therapies. Science. 2019;366:1473–1480. doi: 10.1126/science.aav4474. - DOI - PubMed

Publication types

MeSH terms