. 2021 Sep 17;4(1):1095.
doi: 10.1038/s42003-021-02598-w.

Impacts of environmental conditions, and allelic variation of cytosolic glutamine synthetase on maize hybrid kernel production

Affiliations

Impacts of environmental conditions, and allelic variation of cytosolic glutamine synthetase on maize hybrid kernel production

Nardjis Amiour et al. Commun Biol. .

Abstract

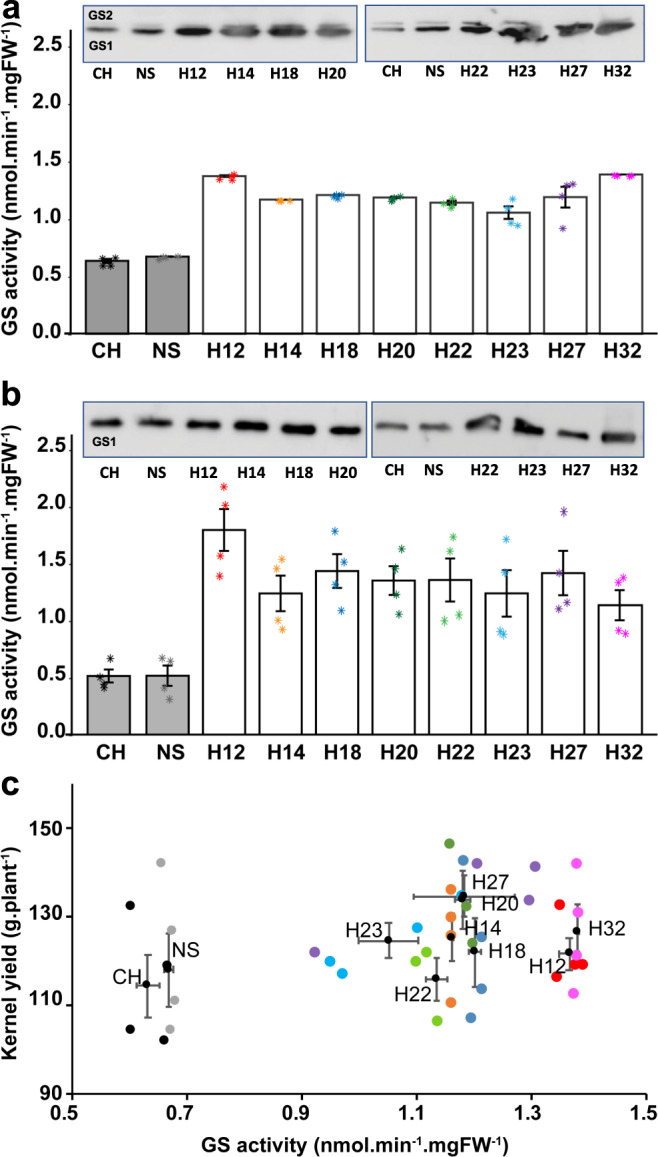
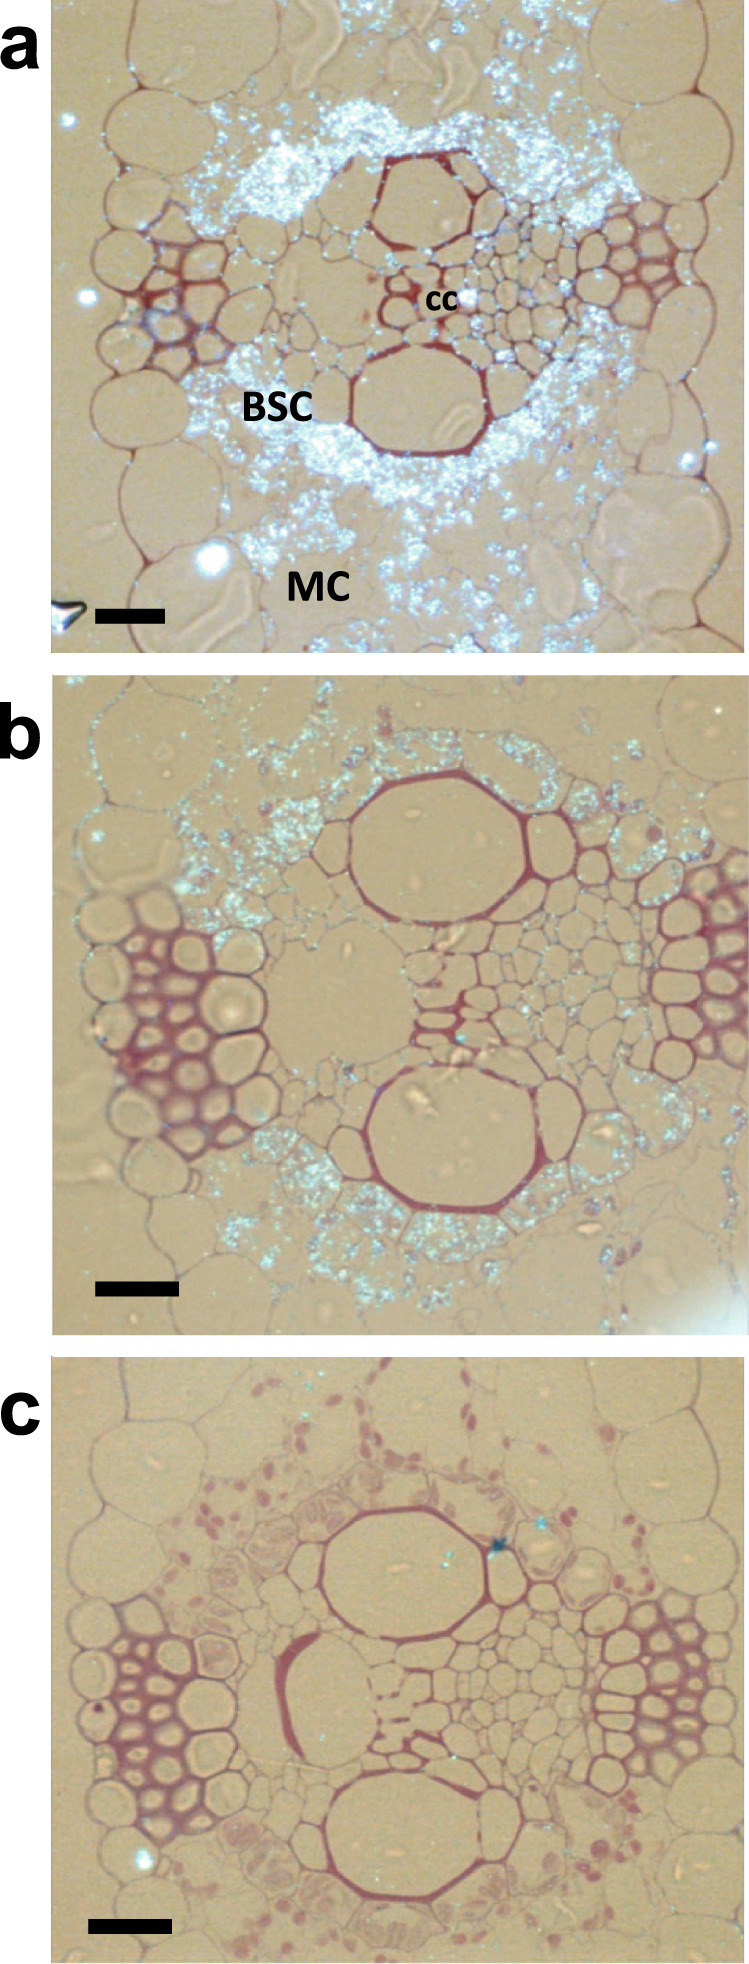
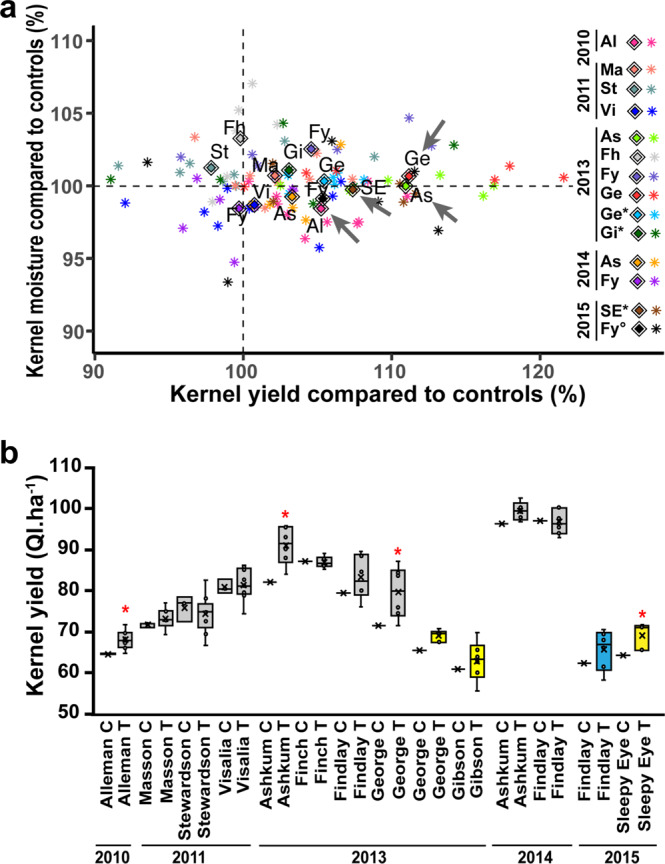
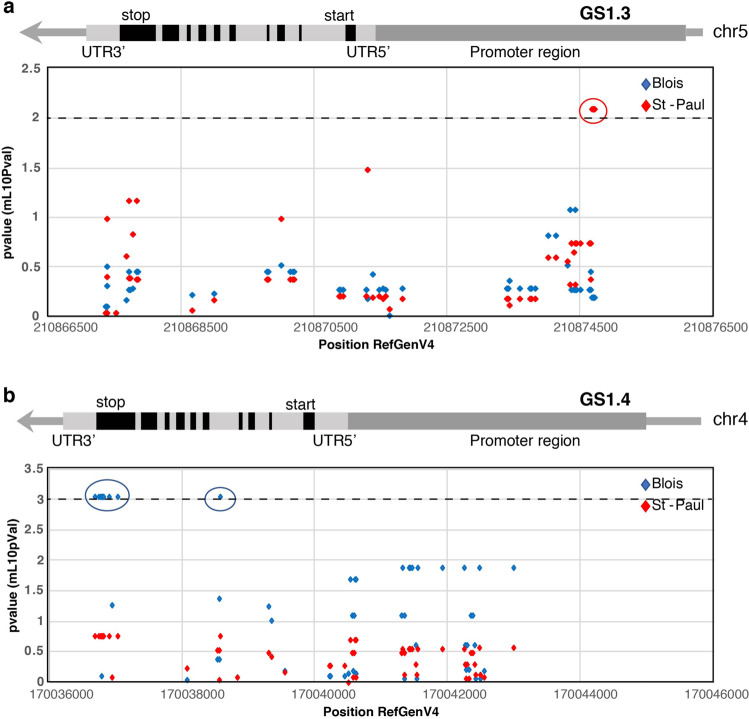
Cytosolic glutamine synthetase (GS1) is the enzyme mainly responsible of ammonium assimilation and reassimilation in maize leaves. The agronomic potential of GS1 in maize kernel production was investigated by examining the impact of an overexpression of the enzyme in the leaf cells. Transgenic hybrids exhibiting a three-fold increase in leaf GS activity were produced and characterized using plants grown in the field. Several independent hybrids overexpressing Gln1-3, a gene encoding cytosolic (GS1), in the leaf and bundle sheath mesophyll cells were grown over five years in different locations. On average, a 3.8% increase in kernel yield was obtained in the transgenic hybrids compared to controls. However, we observed that such an increase was simultaneously dependent upon both the environmental conditions and the transgenic event for a given field trial. Although variable from one environment to another, significant associations were also found between two GS1 genes (Gln1-3 and Gln1-4) polymorphic regions and kernel yield in different locations. We propose that the GS1 enzyme is a potential lead for producing high yielding maize hybrids using either genetic engineering or marker-assisted selection. However, for these hybrids, yield increases will be largely dependent upon the environmental conditions used to grow the plants.


Conflict of interest statement

The authors declare no competing interests.

Figures

Fig. 1
Fig. 1. Characterization of the maize hybrids overexpressing Gln1-3.
The transgenic and control hybrids were grown in the field in 2011 in Finch (MA, USA). a Glutamine synthetase activity in leaves of untransformed control hybrids (CH), a pool of two bulks of hybrids null segregants (NS), and eight independent transgenic hybrids overexpressing Gln1-3 under the control of the CsVMV and the maize RbcS promoters (H12 to H32) at the vegetative (V) stage. b Total leaf GS activity and subunit composition at the grain filling stage, 15 days after silking (15DAS). Total leaf GS activity was measured on four different plants for each of the eight independent transgenic hybrids and protein gel blot analysis was conducted using proteins extracted from a pool of the four different plants for each transgenic hybrid and controls. In panels a, b a protein gel blot showing the GS subunit composition in the leaves of the untransformed hybrids and null segregants and the eight hybrids overexpressing Gln1-3 is shown. At the V stage, the upper band (molecular mass of 44 kDa) corresponds to the plastidic GS (GS2) subunit, and the lower band (molecular mass of 40 kDa) corresponds to the cytosolic GS (GS1) subunit for the vegetative (V) stage. At 15DAS only GS1 subunit was detected. The two separate sets of protein gel blots shown in both (a, b) were selected from the original gel blots presented in Supplementary Fig. 2. c Scatter plot showing the relationship between kernel mass per plant and total leaf GS activity at the V stage in untransformed control plants and the eight independent hybrids overexpressing Gln1-3. Kernel mass per plant (g) was measured on four plants for each transgenic hybrid grown in the field in 2011 (location Finch, MA, USA) under non-limiting N fertilization conditions. Values are the mean ± SD for GS activity and yield. For the eight transgenic hybrids, the yield increase was on average 7% higher compared to the CH and the NS (P = 0.04). Symbols asterisks (a, b) and dots (c) for the values of the four plants: CH: black, NS: gray, H12: red, H14: orange, H18: blue, H20: dark green, H22: light green, H23: light blue, H27: purple, H32: pink.
Fig. 2
Fig. 2. Histological immunolocalization of GS in transverse leaf sections of a transgenic maize hybrid overexpressing Gln1-3 under the control of the CsVMV and maize RbcS promoters.
Sections were examined under bright-field epipolarized light. a Immunolocalization of GS in the leaf of a transgenic hybrid overexpressing Gln1-3 under the control of the CsVMV and of the maize RbcS promoters (hybrid line H27). b Immunolocalization of GS in untransformed hybrids. c Control section treated with preimmune serum. BSC bundle sheath cell; cc phloem companion cells; MC mesophyll cell. Bars = 100 µm.
Fig. 3
Fig. 3. Impact of Gln1-3 overexpression on kernel yield of maize hybrids grown in the field over five years in different locations.
a Relationship between kernel yield (measured in Ql. ha−1) and of kernel moisture (% compared to the control hybrids and null segregants) corresponding to the difference between the mean of all the different transgenic hybrids overexpressing Gln1-3 and the mean of the two types of control hybrids (colored diamonds). The colored asterisks represent the different transgenic events tested in the different locations over the five years of experimentation: Alleman (Al) in 2010 (pink). Masson (Ma), (orange); Stewardson (St) (green) and Visalia (Vi) (dark blue) in 2011. Ashkum (As), (light green); Finch (Fh), (light gray); Findlay (Fy), (violet); George (Ge), (red); George (Ge*),(cyan) and Gibson (Gi*), (dark green) in 2013. Ashkum (As), (yellow−orange) and Findlay (Fy), (dark purple) in 2014. Sleepy Eyes (SE*), (brown−orange) and Findlay (Fy°) (black) in 2015. Presence of a moderate water deficit in George (Ge*) and Gibson (Gi*) in 2013, Sleepy Eyes (SE*) in 2015, and water-saturated soil conditions in Findlay (Fy°) in 2015. The data are from Supplemental Data 4 in which the number of transgenic events, the years of experimentation, the locations, the experimental design, and the statistical analyses are presented. The list of different transgenic events used in the field experiments is summarized in Supplemental Data 1a. The significant increase in kernel yield in a location (p < 0.05) is indicated by a gray arrow Alleman (Al) in 2010, Askhum (As) in 2013, George (Ge) in 2013, and Sleepy Eyes (SE) in 2015. b Box plots showing details of kernel yield obtained over the five years of experimentation (2010, 2011, 2013, 2014, and 2015) in the different locations in the control hybrids (C) and in the transgenic hybrids (T). The yellow boxes indicate the presence of a moderate water deficit and the blue symbol water-saturated soil conditions. The black dots in the box represent the different transgenic events and the horizontal line in the box the average value for kernel yield. The Significant increase in kernel yield in a location (p < 0.05) is indicated by a red asterisk.
Fig. 4
Fig. 4. Manhattan plots showing SNP association with the genes encoding Gln1-3 and Gln1-4.
Manhattan plots showing association mapping p-values associated with kernel yield at 15% moisture (KY15) and genomic location of SNPs located in gene encoding GS1.3 (a) and  GS1.4 (b). Each symbol represents the p-value of a single SNP associated with a trait measured in the field trial conducted in Blois in 2015 (blue) and in Saint-Paul in 2016 (red). The horizontal dashed line represents the significant threshold with a −log10(p-value) >2 and >3 for Gln1-3 and Gln1-4 respectively. The six TAS markers (at markers C05M60, C05M61, C05M62, C05M63, C05M64, and C05M65) for Gln1-3 and the nine TAS markers (at markers C04M01, C04M02, C04M03, C04M05, C04M06, C04M07, C04M08, C04M10, and C04M15) for Gln1-4 are indicated by circles. In the upper part of the figure is indicated the position of the introns, exons, 3′ UTR, 5′ UTR, and promoter region of the two genes.

References

    1. Hirel, B. & Lea, P. J. in The Zea mays Genome. Compendium of Plant Genomes (eds. Bennetzen, J., Flint-Garcia, S. Hirsch, C. & Tuberosa, R.) 259–286 (Springer International Publishing, 2018).
    1. Hirel, B. & Lea, P. J. in The Molecular and Physiological Basis of Nutrient Use Efficiency in Crops (eds. Hawkesford, M. J. & Barraclough, P. B.) 139–164 (Wiley-Blackwell, 2011).
    1. Good AG, Shrawat AK, Muench DG. Can less yield more? Is reducing nutrient input into the environment compatible with maintaining crop production? Trends Plant Sci. 2004;9:597–605. doi: 10.1016/j.tplants.2004.10.008. - DOI - PubMed
    1. Amiour N, et al. The use of metabolomics integrated with transcriptomic and proteomic studies for identifying key steps involved in the control of nitrogen metabolism in crops such as maize. J. Exp. Bot. 2012;63:5017–5033. doi: 10.1093/jxb/ers186. - DOI - PubMed
    1. Simons M, et al. Assessing the metabolic impact of nitrogen availability using a compartmentalized maize leaf genome-scale model. Plant Physiol. 2014;166:1659–1674. doi: 10.1104/pp.114.245787. - DOI - PMC - PubMed

Publication types