. 2021 Dec;26(12):7498-7508.
doi: 10.1038/s41380-021-01281-0. Epub 2021 Sep 17.

IQSEC2 mutation associated with epilepsy, intellectual disability, and autism results in hyperexcitability of patient-derived neurons and deficient synaptic transmission

Affiliations

IQSEC2 mutation associated with epilepsy, intellectual disability, and autism results in hyperexcitability of patient-derived neurons and deficient synaptic transmission

Boris Brant et al. Mol Psychiatry. 2021 Dec.

Abstract

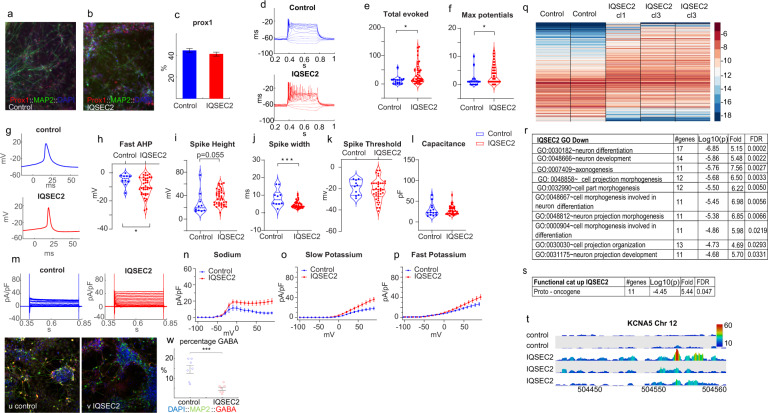
Mutations in the IQSEC2 gene are associated with drug-resistant, multifocal infantile and childhood epilepsy; autism; and severe intellectual disability (ID). We used induced pluripotent stem cell (iPSC) technology to obtain hippocampal neurons to investigate the neuropathology of IQSEC2-mediated disease. The neurons were characterized at three-time points during differentiation to assess developmental progression. We showed that immature IQSEC2 mutant dentate gyrus (DG) granule neurons were extremely hyperexcitable, exhibiting increased sodium and potassium currents compared to those of CRISPR-Cas9-corrected isogenic controls, and displayed dysregulation of genes involved in differentiation and development. Immature IQSEC2 mutant cultured neurons exhibited a marked reduction in the number of inhibitory neurons, which contributed further to hyperexcitability. As the mutant neurons aged, they became hypoexcitable, exhibiting reduced sodium and potassium currents and a reduction in the rate of synaptic and network activity, and showed dysregulation of genes involved in synaptic transmission and neuronal differentiation. Mature IQSEC2 mutant neurons were less viable than wild-type mature neurons and had reduced expression of surface AMPA receptors. Our studies provide mechanistic insights into severe infantile epilepsy and neurodevelopmental delay associated with this mutation and present a human model for studying IQSEC2 mutations in vitro.


Conflict of interest statement

The authors declare no competing interests.

Figures

Fig. 1
Fig. 1. Young (5 weeks post differentiation) IQSEC2-mutant neurons are hyperexcitable compared to control neurons with a reduction in the number of GABA expressing neurons.
a, b Representative images of a control (a) and IQSEC2-mutant (b) neuronal cultures that were immunostained for DAPI, MAP2, and PROX1. c There was no significant change between the percentage of PROX1 positive neurons in the control and IQSEC2-mutant cultures. d A representative recording of evoked potentials in current-clamp mode. e The total number of evoked action potentials is larger in the IQSEC2-mutant neurons than in the control neurons. f The maximum number of evoked action potentials is larger in IQSEC2-mutant neurons than in control neurons. g Representative traces of a control (upper) and IQSEC2-mutant (lower) action potentials. The first action potential evoked with minimal injected current is plotted. h The amplitude of the fast AHP is larger in IQSEC2-mutant neurons than in control neurons. i The spike amplitude is larger in IQSEC2-mutant neurons than in control neurons (p = 0.055). j The spike width is narrower in IQSEC2-mutant neurons than in control neurons. k The threshold for eliciting an action potential is not different between IQSEC2-mutant and control neurons. l The cell capacitance is not different between IQSEC2-mutant and control neurons. m Representative traces of sodium and potassium currents recorded in voltage-clamp in control (left) and IQSEC2-mutant (right) neurons. n The average sodium currents in IQSEC2-mutant neurons are increased compared to control neurons. o The average slow potassium currents in IQSEC2-mutant neurons are increased compared to control neurons. p The average fast potassium currents are increased in IQSEC2-mutant compared to control neurons. q A heat-map of the differentially expressed genes (by RNA sequencing) between control (2 biological replicates) and IQSEC2-mutant DG granule neurons (one sample derived from clone 1 and 2 biological replicates derived from clone 3). r Significant gene ontology (GO) terms (Biological processes) that were downregulated in IQSEC2-mutant neurons. s Functional categories that were upregulated in IQSEC2-mutant neurons. t A screenshot of KCNA5 expression; (from the top track down): control neurons sample 1, control sample 2, IQSEC2-mutant neurons (clone 1), IQSEC2-mutant neurons (clone 3) sample 1, and IQSEC2-mutant neurons (clone 3) sample 2. KCNA5 mRNA is expressed at a significantly higher level in IQSEC2-mutant compared with the control neuronal samples. The data was collected using a Wiggle plot with a step size of 2 base pairs. u An example image of immunohistochemistry staining for DAPI (blue), MAP2 (green), and GABA (red) of a control neuronal culture. v An example image of immunohistochemistry staining for DAPI (blue), MAP2 (green), and GABA (red) of an IQSEC2-mutant neuronal culture. w The averages of the percentage of GABA expressing neurons (identified by the red staining) out of the total neurons (identified with the green MAP2 staining) in the IQSEC2-mutant neuronal cultures are significantly lower than the percentage of GABA expressing neurons in the control neuronal cultures. Data was obtained by imaging 7 control and 7 IQSEC2-mutant neuronal cultures. In this figure asterisks represent statistical significance by the following code: *p value<0.05, **p value<0.01, ***p < 0.001, ****p < 0.0001. Error bars represent the standard error in this figure.
Fig. 2
Fig. 2. At 7 weeks, IQSEC2-mutant neurons start to decrease excitability while control neurons increase excitability compared to the earlier time point.
a A representative trace of evoked action potentials in the current-clamp mode of control (upper graph) and IQSEC2-mutant (lower graph) neurons. b The total number of evoked action potentials is similar on average between IQSEC2-mutant and control neurons. c The maximum number of evoked action potentials is similar between IQSEC2-mutant and control neurons. d Representative traces of a control (upper graph) and IQSEC2-mutant (lower graph) action potentials. The first action potential with minimal injected current is plotted. e The amplitude of the fast AHP is larger in IQSEC2-mutant neurons than in control neurons. f The spike amplitude is similar between IQSEC2-mutant neurons and control neurons. g The spike width is narrower in IQSEC2-mutant neurons than in control neurons. h The threshold for eliciting an action potential is not different between IQSEC2-mutant and control neurons. i The cell capacitance is not different between IQSEC2-mutant and control neurons. j Representative traces of sodium and potassium currents recorded in voltage-clamp in control (upper graph) and IQSEC2-mutant (lower graph) neurons. k The average sodium currents in IQSEC2-mutant neurons are increased compared to control neurons. l The average slow potassium currents in IQSEC2-mutant neurons are increased compared to control neurons. m The average fast potassium currents are increased in IQSEC2-mutant compared to control neurons. n A heatmap of the differentially expressed genes (by RNA sequencing) between control (3 biological replicates) and IQSEC2-mutant neurons (one sample derived from clone 1 and one sample derived from clone 3). o Significant gene ontology (GO) terms (Biological processes) that were downregulated in IQSEC2-mutant neurons. p Functional categories that were downregulated in IQSEC2-mutant neurons. q Functional categories that were upregulated in IQSEC2-mutant neurons. r Significant gene ontology (GO) terms (Biological processes) that were upregulated in IQSEC2-mutant neurons. s A screenshot of KCNA5 expression; (from the top track down): control sample 1, control sample 2, control sample 3, IQSEC2-mutant clone 1, IQSEC2-mutant clone 3 (s). KCNA5 expression is significantly greater in IQSEC2-mutant neurons compared to the control neurons. The data was collected using a Wiggle plot with a step size of 2 bp. In this figure asterisks represent statistical significance by the following code: *p value < 0.05, ****p < 0.0001. Error bars represent the standard error in this figure.
Fig. 3
Fig. 3. IQSEC2-mutant neurons become hypoexcitable at 11 weeks, with reduced sodium and potassium currents.
a A representative recording of evoked action potentials in the current-clamp mode of control (upper graph) and IQSEC2-mutant neurons (lower graph). b The total number of evoked action potentials is similar on average between IQSEC2-mutant and control neurons. c The maximum number of evoked action potentials is reduced in IQSEC2-mutant neurons compared to control neurons. d Representative traces of action potentials in a control (upper graph) and IQSEC2-mutant (lower graph) neurons. The first action potential with minimal injected current is plotted. e The amplitude of the fast AHP is similar between IQSEC2-mutant and control neurons. f The spike amplitude is similar between IQSEC2-mutant neurons and control neurons. g The spike width is similar between IQSEC2-mutant and control neurons. h The threshold for eliciting an action potential is not different between IQSEC2-mutant and control neurons. i The cell capacitance is not different between IQSEC2-mutant and control neurons. j Representative traces of sodium and potassium currents recorded in voltage-clamp in control (upper graph) and IQSEC2-mutant neurons (lower graph). k The average sodium currents in IQSEC2-mutant neurons are decreased compared to control neurons. l The average slow potassium currents in IQSEC2-mutant neurons are decreased compared to control neurons. m The average fast potassium currents are decreased in IQSEC2-mutant compared to control neurons. n A heatmap of the differentially expressed genes (by RNA sequencing) between control (2 biological replicates) and IQSEC2-mutant neurons (2 biological replicates derived from clone 3). The down-regulated gene ontology terms and functional categories are shown in separate tables (Supplementary Table 3 and Supplementary Table 4). o Significant upregulated GO terms in IQSEC2-mutant neurons. p Functional categories that were upregulated in IQSEC2-mutant neurons. q Down-regulated KEGGs pathways in IQSEC2-mutant neurons compared to control neurons. r A screenshot of KCNA5 expression; (from the top track down): control sample 1, control sample 2, IQSEC2-mutant neurons derived from clone 3 sample 1, and IQSEC2-mutant neurons derived from clone 3 sample 2. KCNA5 gene expression at this time point is severely reduced in the IQSEC2-mutant samples. The data was collected using a Wiggle plot with a step size of 2 bp. In this figure, asterisks represent statistical significance by the following code: *p value < 0.05. Error bars represent the standard error.
Fig. 4
Fig. 4. Synaptic transmission is severely impaired and surface GluA2 is reduced in 11 weeks old IQSEC2-mutant neurons.
a A representative trace of excitatory postsynaptic currents (EPSCs) that were measured in a control neuron at 5 weeks post-differentiation. b A representative trace of EPSCs measured in an IQSEC2-mutant neuron at 5 weeks post-differentiation. c The average amplitude of synaptic events was increased in the IQSEC2-mutant neurons (p = 0.053). d The average rate of synaptic events was not significantly different between control and IQSEC2-mutant neurons. e The cumulative distribution of the amplitude of synaptic events is right-shifted in the IQSEC2-mutant neurons indicating higher amplitudes of synaptic events. f A representative trace of synaptic activity measured in a control neuron at 7 weeks of age. g A representative trace of synaptic activity measured in an IQSEC2-mutant neuron at 7 weeks. h The average amplitude of synaptic events is similar between IQSEC2-mutant and control neurons at 7 weeks of age. i The average rate of synaptic events was not significantly different between control and IQSEC2-mutant neurons at 7 weeks. j The cumulative distribution of the amplitude of synaptic events shows a slight right shift in IQSEC2-mutant neurons. k A representative trace of synaptic activity measured in a control neuron at 11 weeks. l A representative trace of synaptic activity measured in an IQSEC2-mutant neuron at 11 weeks. m The average amplitude of synaptic events is similar between IQSEC2-mutant and control neurons at 11 weeks post-differentiation. n The average rate of synaptic events is significantly decreased in IQSEC2-mutant neurons compared to control neurons at 11 weeks. o The cumulative distribution of the amplitude of synaptic events. p Immunoblots after BS3-crosslinking of samples to assess surface (crosslinking “+”) and total protein expression of AMPARs (crosslinking “−”). q Quantification of relative total protein levels of AMPA receptor subunits in samples not cross-linked. r Quantification of relative surface protein levels of AMPA receptor subunits in samples treated with BS3 (crosslinking “+”). Surface expression is the ratio of s-GluA2 to the total GluA2 signal in the lane. Signal intensities normalized to actin signal and wild type as 100%. s Representative images of labeled total (tGluA2) and surface (sGluA2) GluA2 in IQSEC2-mutant and control DG granule neurons. t Quantification of the percentage of sGluA2 to tGluA2 as a measure surface GluA2 expression. u (left). An image of the FACS gating of a control neuronal culture at 7 weeks after the start of differentiation. The live neurons that passed all the gating (GFP positive indicating PROX1 expression and live) were ~55% of the cells in the culture (marked with the red line). u (right). An image of the FACS gating of an IQSEC2-mutant neuronal culture at 7 weeks. The live neurons that passed all the gating were ~41% of the cells in the culture. v (left). An image of the FACS gating of a control neuronal culture at 11 weeks. The live neurons that passed all the gating were approximately 36% of the cells in the culture. v (right) An image of the FACS gating of an IQSEC2-mutant neuronal culture at 11 weeks. The live neurons that passed all the gating were approximately 14% of the cells in the culture. w (left) Immunohistochemistry staining for DAPI (blue), MAP2 (green), and Caspase3 (red) in an example control neuronal culture. w (right) Immunohistochemistry staining for DAPI (blue), MAP2 (green), and Caspase3 (red) in an example IQSEC2-mutant neuronal culture. x An increased average percentage of neurons stained for caspase3 (out of the total MAP2 positive neurons) in the IQSEC2-mutant neuronal cultures compared to the control neuronal cultures indicate an increased number of apoptotic neurons. In this figure, asterisks indicate statistical significance by the following code: *p value < 0.05, **p < 0.01. Error bars represent the standard error.
Fig. 5
Fig. 5. Summary of the progression of changes during the maturation of IQSEC2-mutant vs. control neurons.
a The total number of evoked action potentials is higher in the IQSEC2-mutant neurons than the controls at 5 weeks and is decreased at 11 weeks compared to control neurons. b Similarly, the Max number of action potentials is higher in the IQSEC2-mutant neurons at 5 weeks and later decreases below the controls at 11 weeks. Both these measures in (a) and (b) represent neuronal excitability. c At 5 and 7 weeks the fast AHP amplitude is increased in the IQSEC2-mutant neurons, and at 11 weeks the fast AHP is similar between control and IQSEC2-mutant neurons. d The spike amplitude is larger at all time points in the IQSEC2-mutant neurons. e The spike width (Full Width at Half the Maximum—FWHM) is narrower in the IQSEC2-mutant neurons at 5 weeks and 7 weeks but is similar to the controls at 11 weeks. f The spike threshold is similar between the IQSEC2-mutant neurons and the control neurons at all-time points. g The capacitance is similar between the IQSEC2-mutant neurons and the control neurons at all-time points. h The rate of excitatory postsynaptic currents (EPSCs) starts very low in both IQSEC2-mutant and wild-type neurons and increases significantly at 11 weeks. This rate is reduced in the IQSEC2-mutant neurons at 11 weeks when compared to the control neurons.

References

    1. Shoubridge C, Tarpey PS, Abidi F, Ramsden SL, Rujirabanjerd S, Murphy JA, et al. Mutations in the guanine nucleotide exchange factor gene IQSEC2 cause nonsyndromic intellectual disability. Nat Genet. 2010;42:486–8. doi: 10.1038/ng.588. - DOI - PMC - PubMed
    1. Zerem A, Haginoya K, Lev D, Blumkin L, Kivity S, Linder I, et al. The molecular and phenotypic spectrum of IQSEC2-related epilepsy. Epilepsia. 2016;57:1858–69. doi: 10.1111/epi.13560. - DOI - PubMed
    1. Shoubridge C, Harvey RJ, Dudding-Byth T. IQSEC2 mutation update and review of the female-specific phenotype spectrum including intellectual disability and epilepsy. Hum Mutat. 2019;40:5–24. doi: 10.1002/humu.23670. - DOI - PubMed
    1. Murphy JA, Jensen ON, Walikonis RSBRAG1. a Sec7 domain-containing protein, is a component of the postsynaptic density of excitatory synapses. Brain Res. 2006;1120:35–45. doi: 10.1016/j.brainres.2006.08.096. - DOI - PubMed
    1. Sakagami H, Sanda M, Fukaya M, Miyazaki T, Sukegawa J, Yanagisawa T, et al. IQ-ArfGEF/BRAG1 is a guanine nucleotide exchange factor for Arf6 that interacts with PSD-95 at postsynaptic density of excitatory synapses. Neurosci Res. 2008;60:199–212. doi: 10.1016/j.neures.2007.10.013. - DOI - PubMed

Publication types

Substances