

Genomic and functional characterization of a mucosal symbiont involved in early-stage colorectal cancer
- PMID: 34536346
- PMCID: PMC8979638
- DOI: 10.1016/j.chom.2021.08.013
Genomic and functional characterization of a mucosal symbiont involved in early-stage colorectal cancer
Abstract
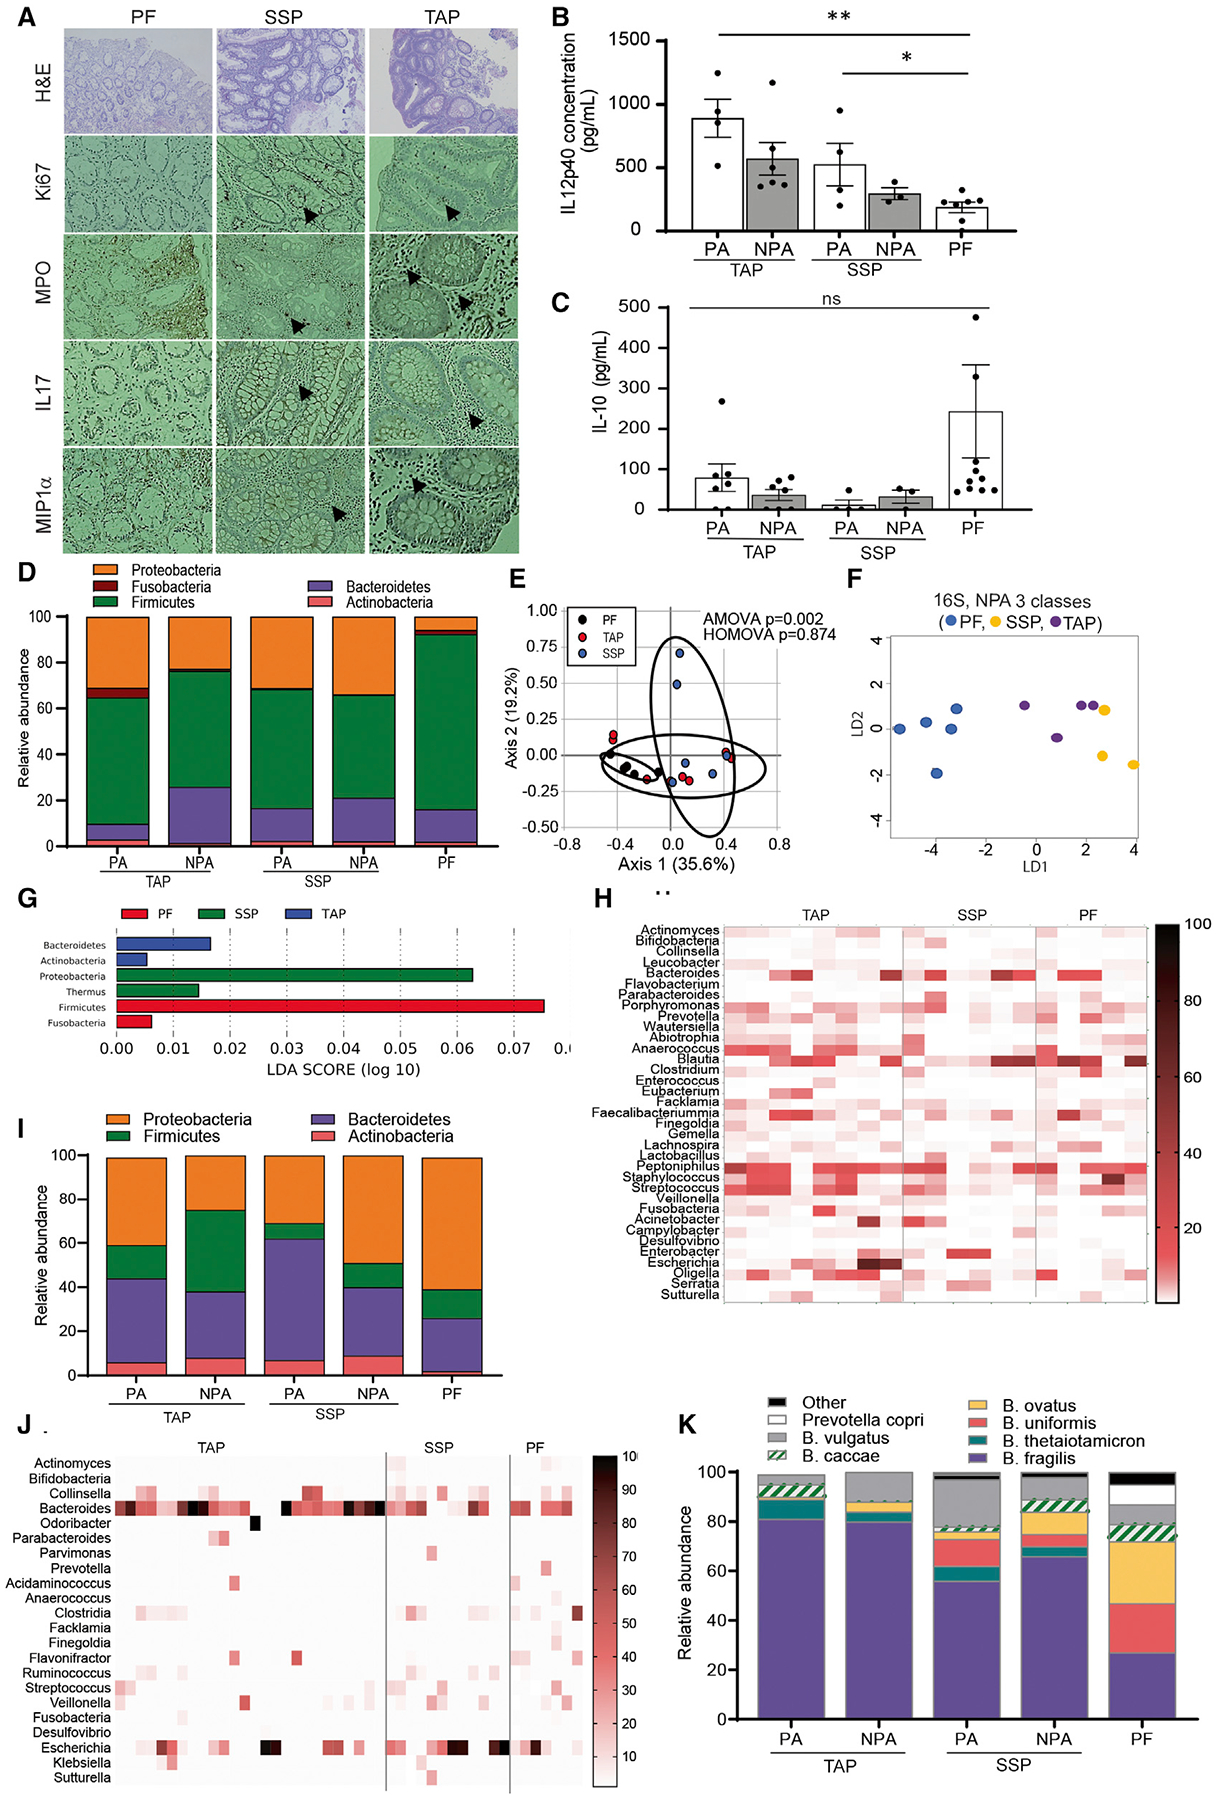
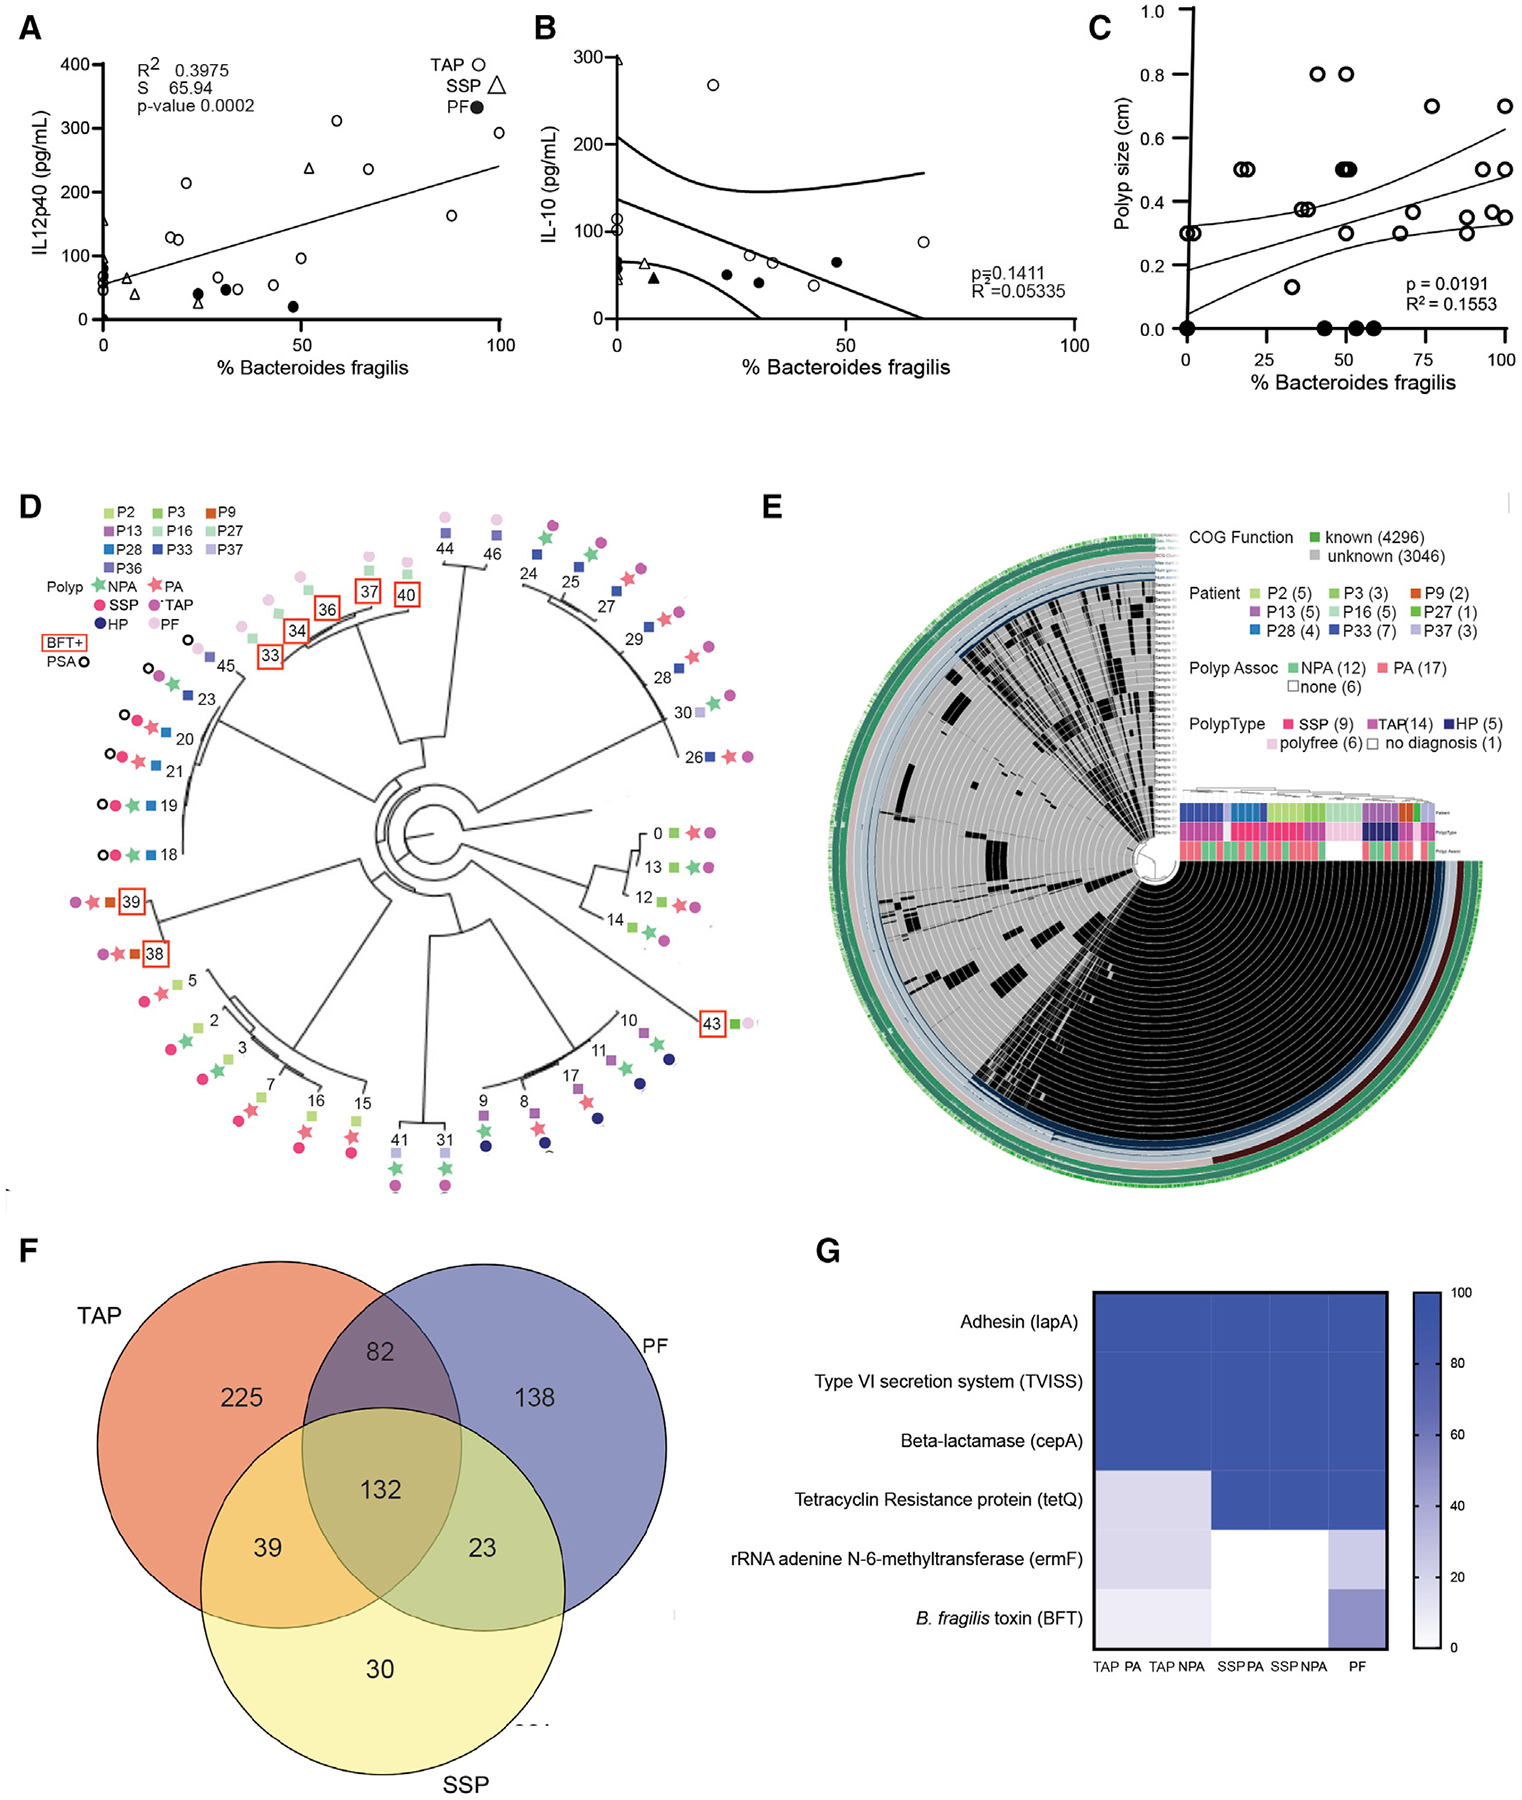
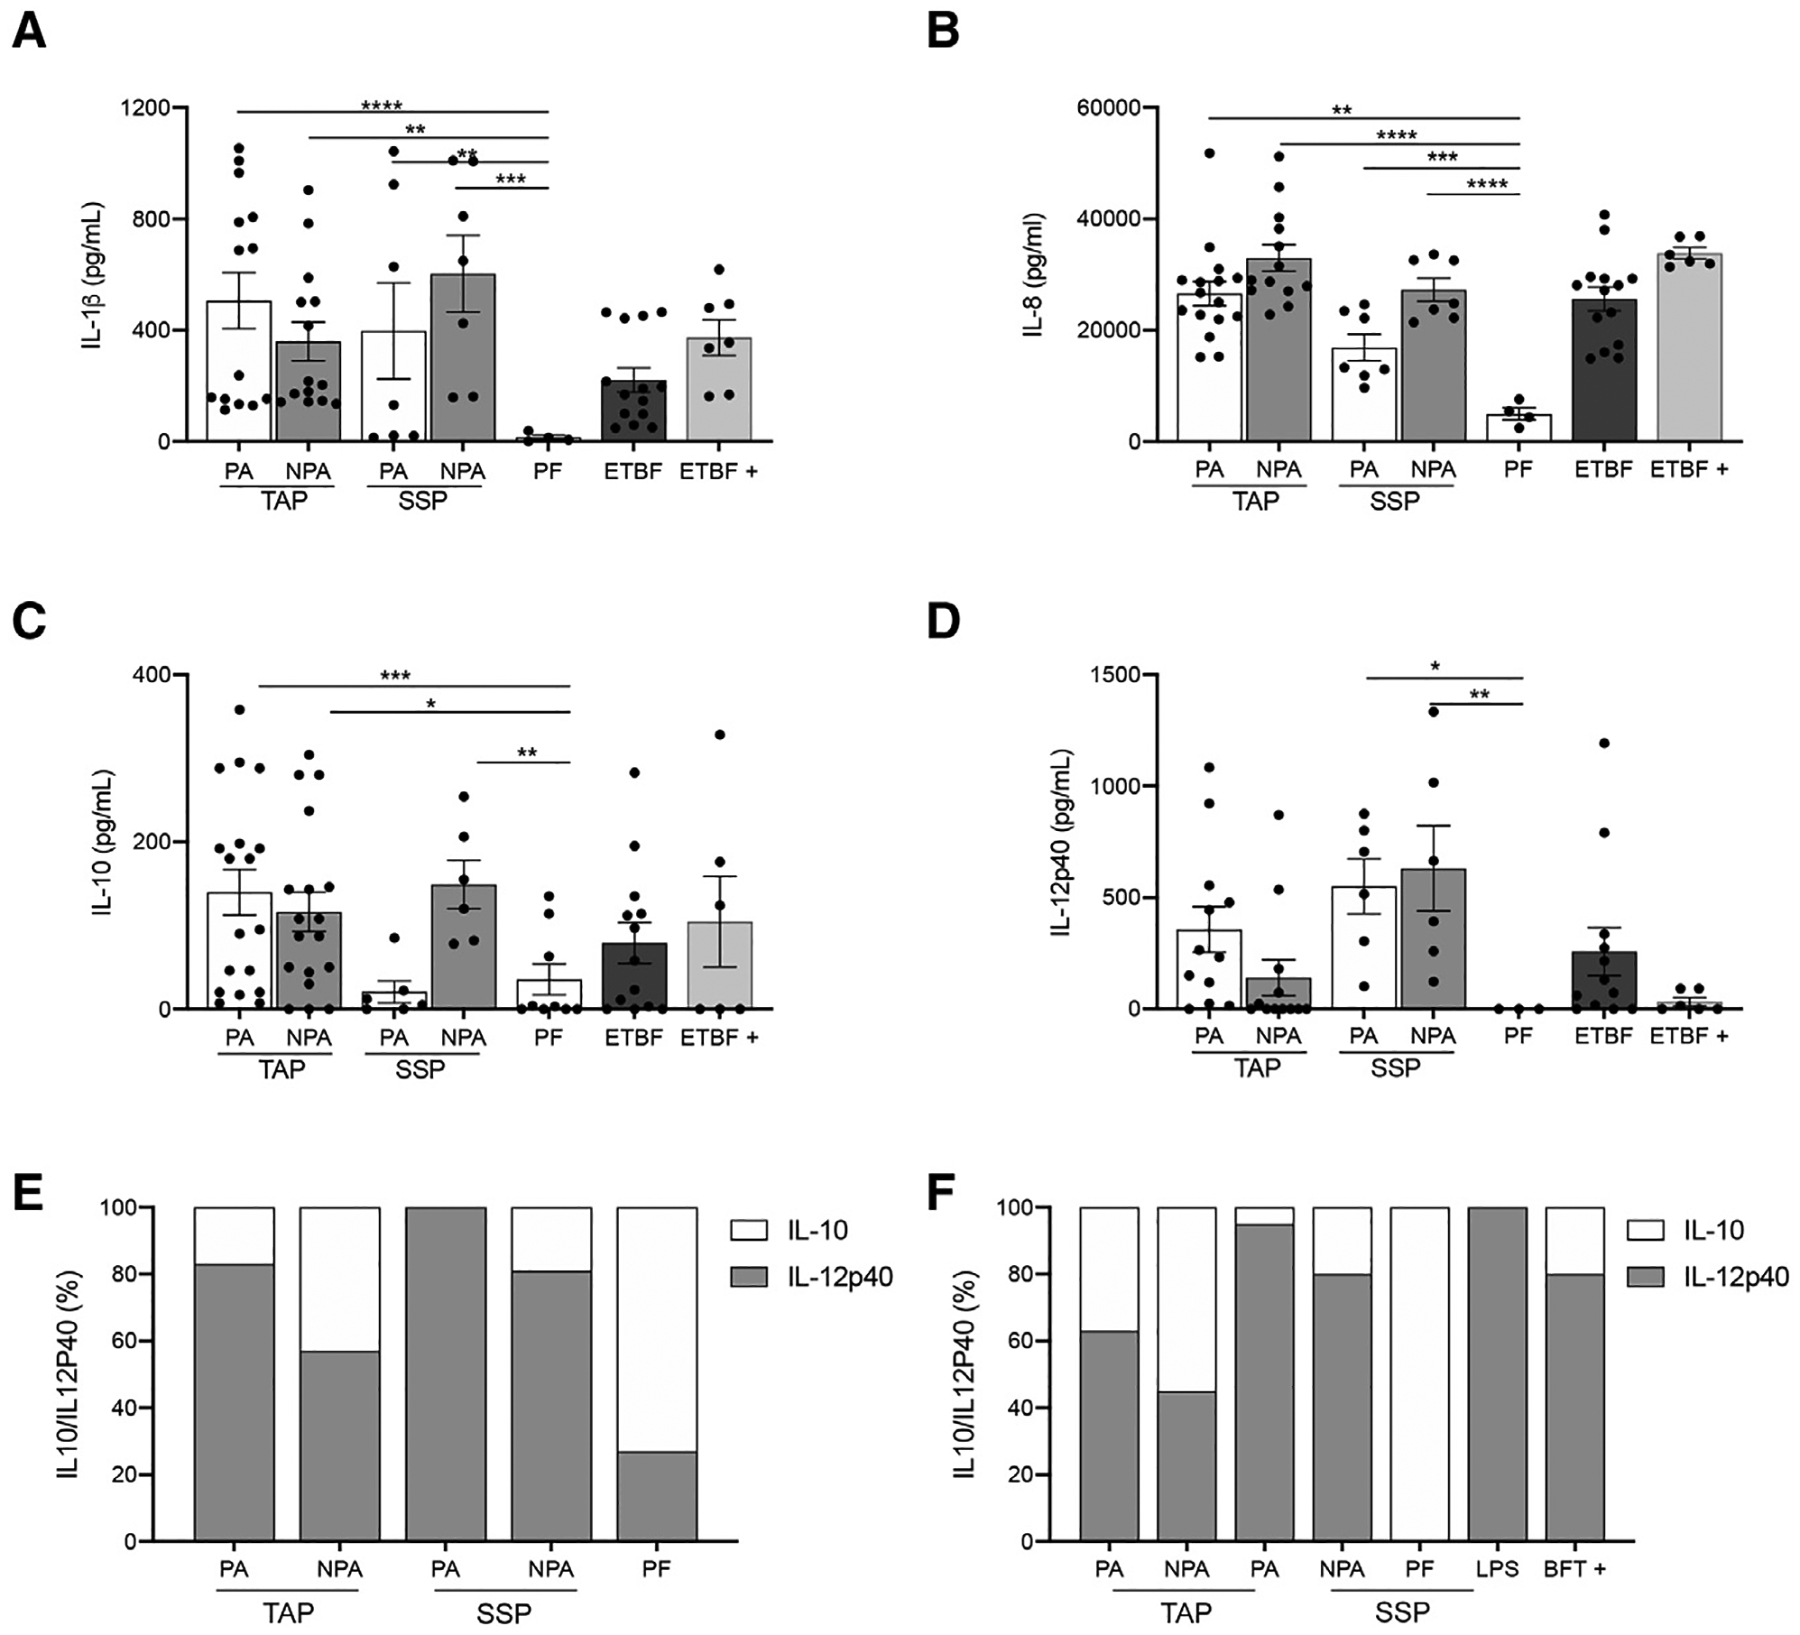
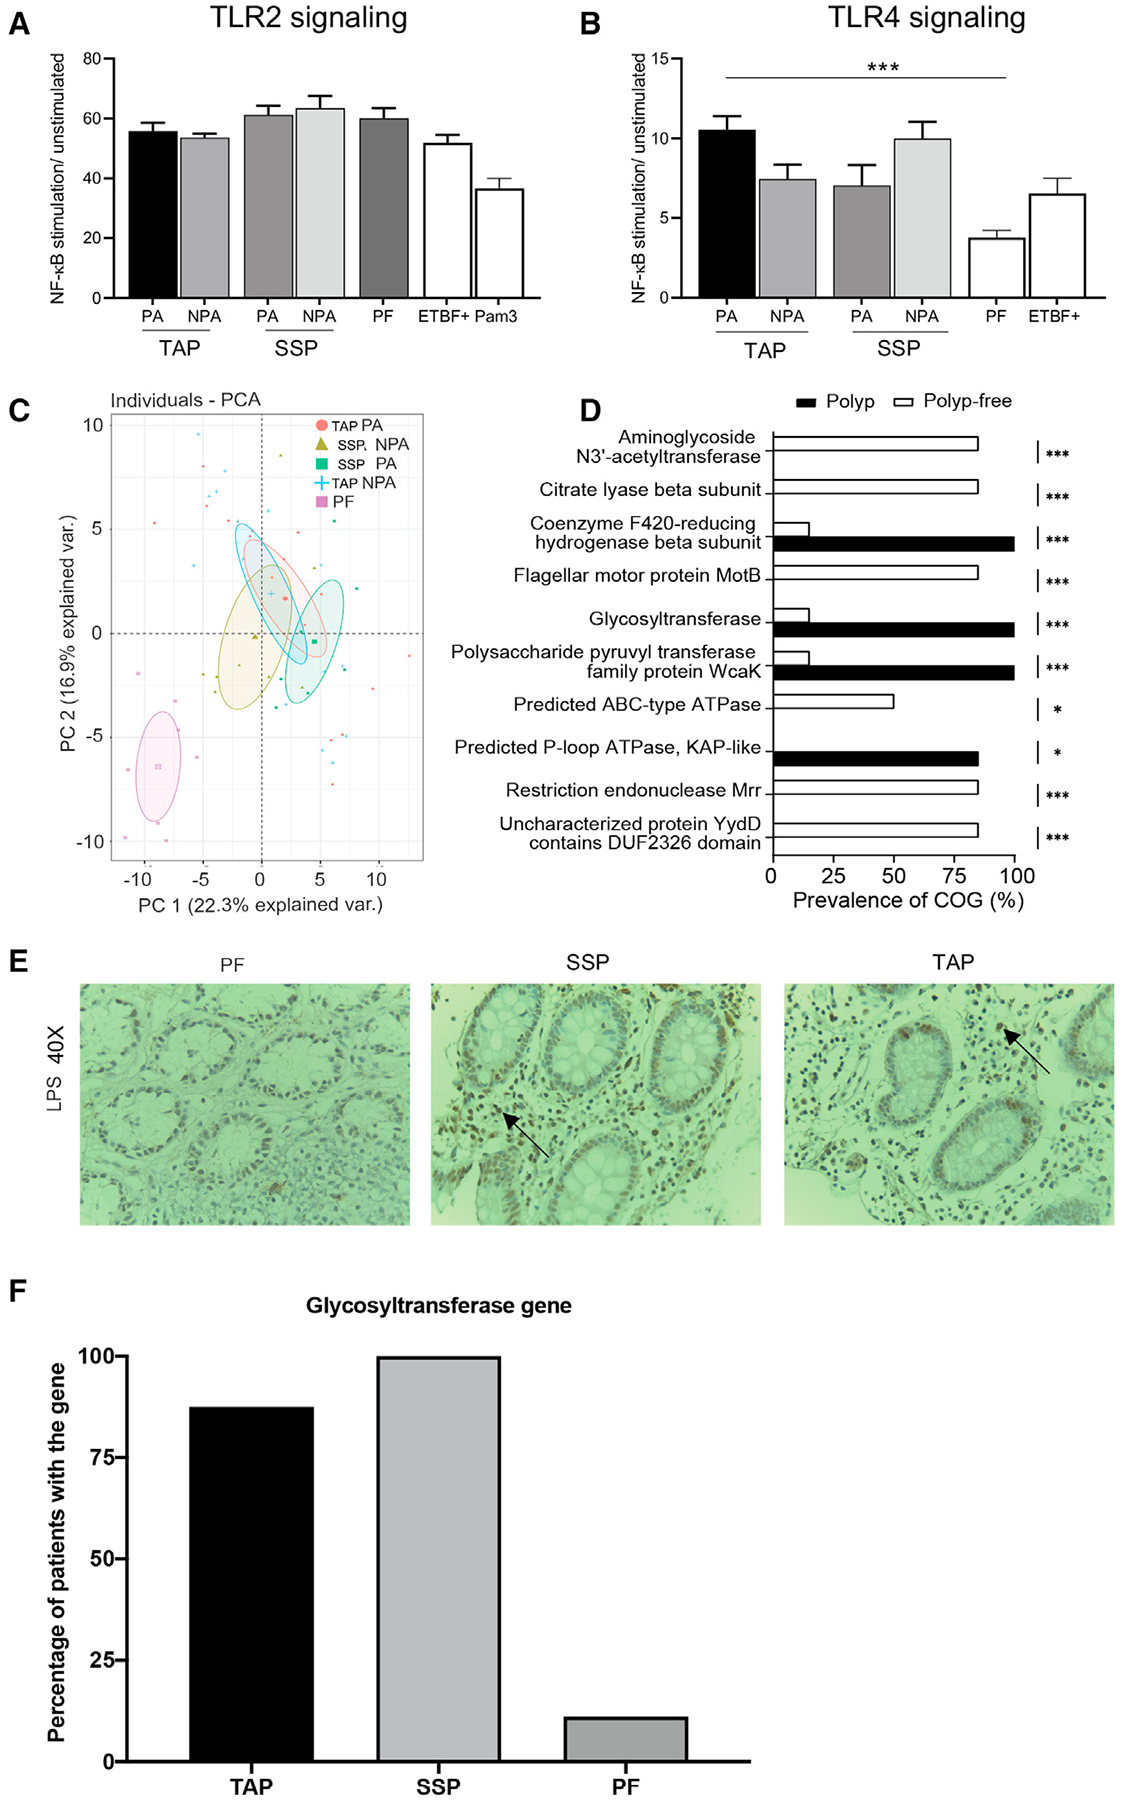
Colorectal cancer is a major health concern worldwide. Growing evidence for the role of the gut microbiota in the initiation of CRC has sparked interest in approaches that target these microorganisms. However, little is known about the composition and role of the microbiota associated with precancerous polyps. Here, we found distinct microbial signatures between patients with and without polyps and between polyp subtypes using sequencing and culturing techniques. We found a correlation between Bacteroides fragilis recovered and the level of inflammatory cytokines in the mucosa adjacent to the polyp. Additional analysis revealed that B. fragilis from patients with polyps are bft-negative, activate NF-κB through Toll-like receptor 4, induce a pro-inflammatory response, and are enriched in genes associated with LPS biosynthesis. This study provides fundamental insight into the microbial microenvironment of the pre-neoplastic polyp by highlighting strain-specific genomic and proteomic differences, as well as more broad compositional differences in the microbiome.
Keywords: Bacteroides fragilis; colon cancer; colorectal polyp; inflammation; innate immunity; microbiome; microbiota.
Copyright © 2021 Elsevier Inc. All rights reserved.
Conflict of interest statement
Declaration of interests The authors declare the following competing interests. R.W.D. is on the advisory board of MicrobiomX. W.M.G. is on the advisory board of Guardant Health, Freenome, SEngine, and consults for Diacarta and receives research support from Jannsen and Tempus. . C.W.K. receives research support from Freenome.
Figures
Comment in
-
A colon cancer "prequel".Cell Host Microbe. 2021 Oct 13;29(10):1480-1481. doi: 10.1016/j.chom.2021.09.013. Cell Host Microbe. 2021. PMID: 34648740
Similar articles
-
The Bacteroides fragilis toxin gene is prevalent in the colon mucosa of colorectal cancer patients.Clin Infect Dis. 2015 Jan 15;60(2):208-15. doi: 10.1093/cid/ciu787. Epub 2014 Oct 9. Clin Infect Dis. 2015. PMID: 25305284 Free PMC article.
-
Genomic alterations in Bacteroides fragilis favor adaptation in colorectal cancer microenvironment.BMC Genomics. 2025 Mar 18;26(1):269. doi: 10.1186/s12864-025-11421-3. BMC Genomics. 2025. PMID: 40102781 Free PMC article.
-
Gut microbiota signatures in tissues of the colorectal polyp and normal colorectal mucosa, and faeces.Front Cell Infect Microbiol. 2023 Jan 10;12:1054808. doi: 10.3389/fcimb.2022.1054808. eCollection 2022. Front Cell Infect Microbiol. 2023. PMID: 36704106 Free PMC article. Clinical Trial.
-
Study of Microbiota Associated to Early Tumors Can Shed Light on Colon Carcinogenesis.Int J Mol Sci. 2024 Dec 11;25(24):13308. doi: 10.3390/ijms252413308. Int J Mol Sci. 2024. PMID: 39769073 Free PMC article. Review.
-
Gut bacteria signaling to mitochondria in intestinal inflammation and cancer.Gut Microbes. 2020 May 3;11(3):285-304. doi: 10.1080/19490976.2019.1592421. Epub 2019 Mar 26. Gut Microbes. 2020. PMID: 30913966 Free PMC article. Review.
Cited by
-
Liquid chromatography-tandem mass spectrometry analysis of a ratio-optimized drug pair of Sophora flavescens Aiton and Coptis chinensis Franch and study on the mechanism of anti-colorectal cancer effect of two alkaloids thereof.Front Oncol. 2023 Jun 19;13:1198467. doi: 10.3389/fonc.2023.1198467. eCollection 2023. Front Oncol. 2023. PMID: 37404762 Free PMC article.
-
Fecal bacterial biomarkers and blood biochemical indicators as potential key factors in the development of colorectal cancer.mSystems. 2025 Mar 18;10(3):e0004325. doi: 10.1128/msystems.00043-25. Epub 2025 Feb 27. mSystems. 2025. PMID: 40013832 Free PMC article.
-
The pan-cancer landscape of abnormal DNA methylation and intratumor microorganisms.Neoplasia. 2023 Mar;37:100882. doi: 10.1016/j.neo.2023.100882. Epub 2023 Feb 13. Neoplasia. 2023. PMID: 36791577 Free PMC article.
-
Gut microbiota dysbiosis promotes the development of epithelial ovarian cancer via regulating Hedgehog signaling pathway.Gut Microbes. 2023 Jan-Dec;15(1):2221093. doi: 10.1080/19490976.2023.2221093. Gut Microbes. 2023. PMID: 37282604 Free PMC article.
-
Decoding the Tumor-Associated Microbiota: From Origins to Nanomedicine Applications in Cancer Therapy.Biology (Basel). 2025 Feb 27;14(3):243. doi: 10.3390/biology14030243. Biology (Basel). 2025. PMID: 40136500 Free PMC article. Review.
References
-
- Andersen V, Holst R, Kopp TI, Tjønneland A, and Vogel U (2013). Interactions between diet, lifestyle and IL10, IL1B, and PTGS2/COX-2 gene polymorphisms in relation to risk of colorectal cancer in a prospective Danish case-cohort study. PLoS One 8, e78366. 10.1371/journal.pone.0078366. - DOI - PMC - PubMed
-
- Bodnar KA (2002). The interaction between murine dendritic cell and Mycobacterium tuberculosis. http://d-scholarship.pitt.edu/6320/.
MeSH terms
Substances
Grants and funding
LinkOut - more resources
Full Text Sources
Medical
Molecular Biology Databases
