

Characterizing Expiratory Respiratory Muscle Degeneration in Duchenne Muscular Dystrophy Using MRI
- PMID: 34536384
- PMCID: PMC9160975
- DOI: 10.1016/j.chest.2021.08.078
Characterizing Expiratory Respiratory Muscle Degeneration in Duchenne Muscular Dystrophy Using MRI
Abstract
Background: Expiratory muscle weakness and impaired airway clearance are early signs of respiratory dysfunction in Duchenne muscular dystrophy (DMD), a degenerative muscle disorder in which muscle cells are damaged and replaced by fibrofatty tissue. Little is known about expiratory muscle pathology and its relationship to cough and airway clearance capacity; however, the level of muscle replacement by fat can be estimated using MRI and expressed as a fat fraction (FF).
Research question: How does abdominal expiratory muscle fatty infiltration change over time in DMD and relate to clinical expiratory function?
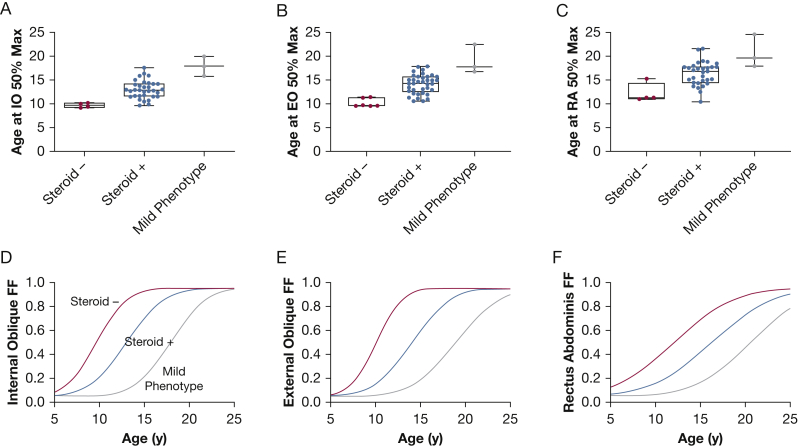
Study design and methods: Individuals with DMD underwent longitudinal MRI of the abdomen to determine FF in the internal oblique, external oblique, and rectus abdominis expiratory muscles. FF data were used to estimate a model of expiratory muscle degeneration by using nonlinear mixed effects and a cumulative distribution function. FVC, maximal inspiratory and expiratory pressures, and peak cough flow were collected as clinical correlates to MRI.
Results: Forty individuals with DMD (aged 6-18 years at baseline) participated in up to five visits over 36 months. Modeling estimated the internal oblique progresses most quickly and reached 50% replacement by fat at a mean patient age of 13.0 years (external oblique, 14.0 years; rectus abdominis, 16.2 years). Corticosteroid-untreated individuals (n = 4) reached 50% muscle replacement by fat 3 to 4 years prior to treated individuals. Individuals with mild clinical dystrophic phenotypes (n = 3) reached 50% muscle replacement by fat 4 to 5 years later than corticosteroid-treated individuals. Internal and external oblique FFs near 50% were associated with maximal expiratory pressures < 60 cm H2O and peak cough flows < 270 L/min.
Interpretation: These data improve understanding of the early phase of respiratory compromise in DMD, which typically presents as airway clearance dysfunction prior to the onset of hypoventilation, and links expiratory muscle fatty infiltration to pulmonary function measures.
Keywords: Duchenne muscular dystrophy; MRI; airway clearance; cough; expiratory muscles.
Copyright © 2021 American College of Chest Physicians. Published by Elsevier Inc. All rights reserved.
Figures


Comment in
-
An Important Window Into Respiratory Muscle Decline.Chest. 2022 Mar;161(3):601-602. doi: 10.1016/j.chest.2021.10.017. Chest. 2022. PMID: 35256078 No abstract available.
Similar articles
-
Imaging respiratory muscle quality and function in Duchenne muscular dystrophy.J Neurol. 2019 Nov;266(11):2752-2763. doi: 10.1007/s00415-019-09481-z. Epub 2019 Jul 26. J Neurol. 2019. PMID: 31350642 Free PMC article.
-
Effects of Positioning on Cough Peak Flow and Muscular Electromyographic Activation in Duchenne Muscular Dystrophy.Respir Care. 2020 Nov;65(11):1668-1677. doi: 10.4187/respcare.07426. Epub 2020 Jun 16. Respir Care. 2020. PMID: 32546537
-
The relationship of body habitus and respiratory function in Duchenne muscular dystrophy.Respir Med. 2016 Oct;119:35-40. doi: 10.1016/j.rmed.2016.08.018. Epub 2016 Aug 22. Respir Med. 2016. PMID: 27692145
-
Cough and airway clearance in Duchenne muscular dystrophy.Paediatr Respir Rev. 2019 Aug;31:35-39. doi: 10.1016/j.prrv.2018.11.001. Epub 2018 Nov 24. Paediatr Respir Rev. 2019. PMID: 30553655 Review.
-
Clinical pulmonary function testing in Duchenne muscular dystrophy.Paediatr Respir Rev. 2019 Apr;30:9-12. doi: 10.1016/j.prrv.2018.08.004. Epub 2018 Oct 4. Paediatr Respir Rev. 2019. PMID: 30413352 Review.
Cited by
-
Roles of super enhancers and enhancer RNAs in skeletal muscle development and disease.Cell Cycle. 2023 Mar;22(5):495-505. doi: 10.1080/15384101.2022.2129240. Epub 2022 Oct 2. Cell Cycle. 2023. PMID: 36184878 Free PMC article. Review.
-
Draft Guidance for Industry Duchenne Muscular Dystrophy, Becker Muscular Dystrophy, and Related Dystrophinopathies - Developing Potential Treatments for the Entire Spectrum of Disease.J Neuromuscul Dis. 2024;11(2):499-523. doi: 10.3233/JND-230219. J Neuromuscul Dis. 2024. PMID: 38363616 Free PMC article.
-
Breathing in Duchenne muscular dystrophy: translation to therapy.J Physiol. 2022 Aug;600(15):3465-3482. doi: 10.1113/JP281671. Epub 2022 Jun 24. J Physiol. 2022. PMID: 35620971 Free PMC article. Review.
-
Chest Dynamic MRI as Early Biomarker of Respiratory Impairment in Amyotrophic Lateral Sclerosis Patients: A Pilot Study.J Clin Med. 2024 May 25;13(11):3103. doi: 10.3390/jcm13113103. J Clin Med. 2024. PMID: 38892814 Free PMC article.
-
Fat infiltration in skeletal muscle: Influential triggers and regulatory mechanism.iScience. 2024 Feb 15;27(3):109221. doi: 10.1016/j.isci.2024.109221. eCollection 2024 Mar 15. iScience. 2024. PMID: 38433917 Free PMC article. Review.
References
-
- Hoffman E.P., Brown R.H., Jr., Kunkel L.M. Dystrophin: the protein product of the Duchenne muscular dystrophy locus. Cell. 1987;51(6):919–928. - PubMed
-
- Mayer O.H. Pulmonary function and clinical correlation in DMD. Paediatr Respir Rev. 2019;30:13–15. - PubMed
-
- Dohna-Schwake C., Ragette R., Teschler H., et al. Predictors of severe chest infections in pediatric neuromuscular disorders. Neuromuscul Disord. 2006;16(5):325–328. - PubMed
-
- McDonald C.M., Gordish-Dressman H., Henricson E.K., et al. Longitudinal pulmonary function testing outcome measures in Duchenne muscular dystrophy: long-term natural history with and without glucocorticoids. Neuromuscul Disord. 2018;28(11):897–909. - PubMed
-
- Kotwal N., Shukla P.J., Perez G.F. Peak cough flow in children with neuromuscular disorders. Lung. 2020;198(2):371–375. - PubMed
Publication types
MeSH terms
Substances
Grants and funding
LinkOut - more resources
Full Text Sources
Medical
