. 2021 Sep 18;21(1):176.
doi: 10.1186/s12862-021-01905-7.

Sequencing refractory regions in bird genomes are hotspots for accelerated protein evolution

Affiliations

Sequencing refractory regions in bird genomes are hotspots for accelerated protein evolution

R Huttener et al. BMC Ecol Evol. .

Abstract

Background: Approximately 1000 protein encoding genes common for vertebrates are still unannotated in avian genomes. Are these genes evolutionary lost or are they not yet found for technical reasons? Using genome landscapes as a tool to visualize large-scale regional effects of genome evolution, we reexamined this question.

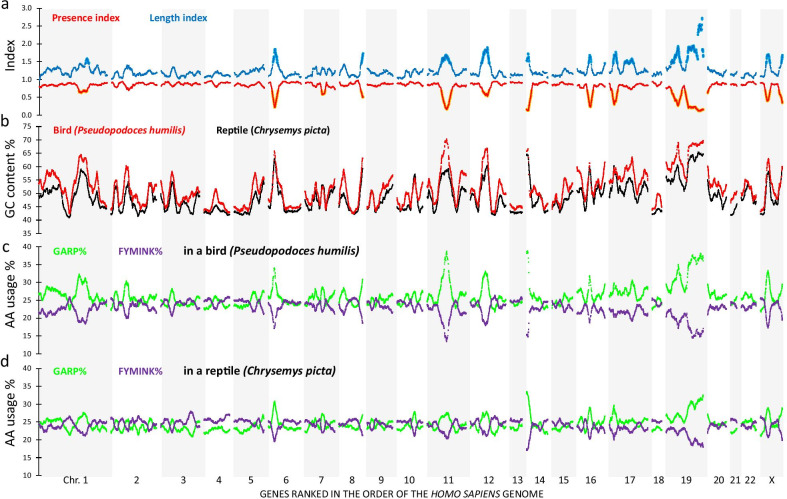
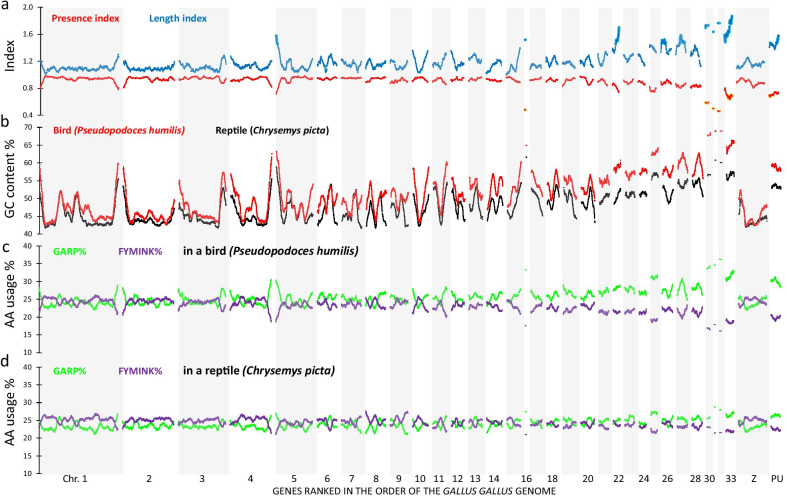
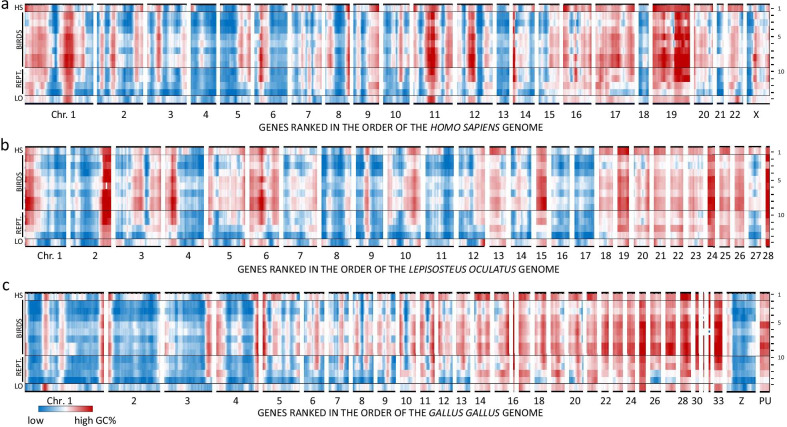
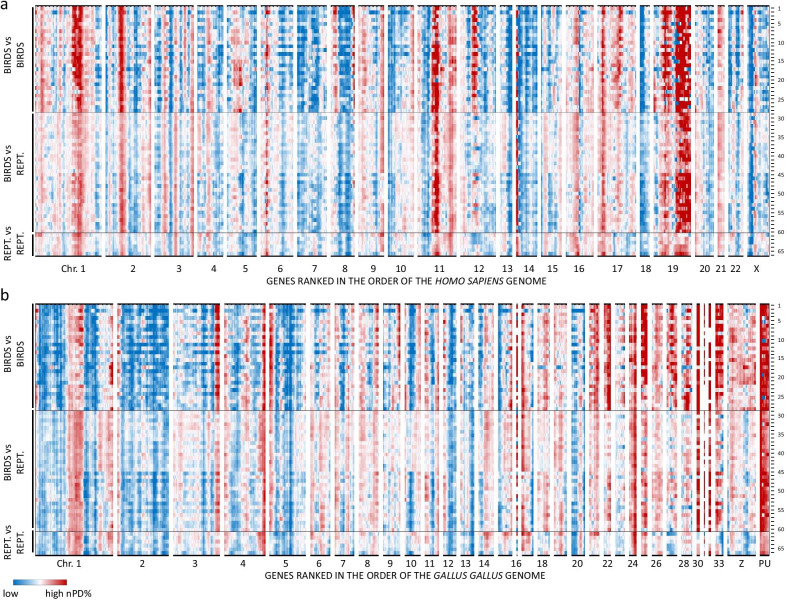
Results: On basis of gene annotation in non-avian vertebrate genomes, we established a list of 15,135 common vertebrate genes. Of these, 1026 were not found in any of eight examined bird genomes. Visualizing regional genome effects by our sliding window approach showed that the majority of these "missing" genes can be clustered to 14 regions of the human reference genome. In these clusters, an additional 1517 genes (often gene fragments) were underrepresented in bird genomes. The clusters of "missing" genes coincided with regions of very high GC content, particularly in avian genomes, making them "hidden" because of incomplete sequencing. Moreover, proteins encoded by genes in these sequencing refractory regions showed signs of accelerated protein evolution. As a proof of principle for this idea we experimentally characterized the mRNA and protein products of four "hidden" bird genes that are crucial for energy homeostasis in skeletal muscle: ALDOA, ENO3, PYGM and SLC2A4.

Conclusions: A least part of the "missing" genes in bird genomes can be attributed to an artifact caused by the difficulty to sequence regions with extreme GC% ("hidden" genes). Biologically, these "hidden" genes are of interest as they encode proteins that evolve more rapidly than the genome wide average. Finally we show that four of these "hidden" genes encode key proteins for energy metabolism in flight muscle.

Keywords: ALDOA; Accelerated; Avian genomes; ENO3; Evolution; GLUT4; Missing genes; PYGM; SLC2A4; Sequencing artifacts; Transcript landscapes.


Conflict of interest statement

The authors declare that they have no competing interests.

Figures

Fig. 1
Fig. 1
Avian and non-avian reptilian landscapes of protein encoding genes. A set of 15,135 common vertebrate genes was sorted in the order of the human reference genome, alternating grey/white bars represent the different chromosomes. A sliding window of a centered gene and its 100 neighbors was taken to calculate the regional genomic average for each variable. a Presence index (red) and length index (blue) of the genes in the eight avian genomes. The areas in orange dots define the genes where the presence index is below the threshold of 0.70. In light blue it is shown where the length index is higher than the threshold of 1.46. In panel b, we have displayed the GC content of mRNA transcripts of the best annotated of the 4 studied non-avian reptiles (black, Chrysemys picta) and eight studied birds (red, Pseudopodoces humilis). The highest peaks of GC content are often seen in areas of a low presence index. c and d Landscapes of the cumulative presence of GARP% (encoded by GC-rich codons, green) or FYMINK% (encoded by AU-rich codons, purple) in the Pseudopodoces humilis (c) and Chrysemys picta (d) genome. The amount of GARP% and GC content are strongly correlated (R = 0.92 for Chrysemys picta and R = 0.91 for Pseudopodoces humilis)
Fig. 2
Fig. 2
Avian and non-avian reptilian landscapes of protein encoding genes in the chicken genome order. The same data as in Fig. 1 are shown, but now the genes are ranked in the order of the chicken genome. For 214 genes, chicken chromosomal position is unknown (PU). a presence and length indices for birds indicate that most gene information (number of genes and sequence) is missing in the microchromosomes. b The GC content of Pseudopodoces humilis is the highest at the subtelomeres of the macrochromosomes and in the microchromosomes. Note that in the macrochromosomes the GC content in both species is more similar than in the microchromosomes. c and d GARP% and FYMINK% of the predicted proteins in Pseudopodoces humilis and Chrysemys picta
Fig. 3
Fig. 3
Heatmap of GC content profiles. The GC content of the predicted mRNA transcripts of eight birds, and four non-avian reptiles is shown together with the two reference genomes (Homo sapiens (HS) and Lepisosteus oculatus (LO)) using a heatmap display. Genes were positioned according to the order of the human genome a), the Lepisosteus oculatus genome (b) or the Gallus gallus genome (c). Most intense red (highest GC%) is found in the avian genomes (lines 2–9), typically in microchromosomes or subtelomeric in macrochromosomes when genes were ranked according to the chicken genome. When genes were ranked according to the human or gar genome, many regional GC maxima for birds were located far from the chromosomal ends. Numbering: 1 Homo sapiens, 2 Apteryx australis, 3 Struthio camelus, 4 Anser cygnoides, 5 Gallus gallus, 6 Calypte anna, 7 Aquila chrysaetos, 8 Pseudopodoces humilis, 9 Sturnus vulgaris, 10 Alligator mississippiensis, 11 Chrysemys picta, 12 Pogona vitticeps, 13 Python bivittatus, 14 Lepisosteus oculatus
Fig. 4
Fig. 4
Heatmaps of normalized protein divergence (nPD%). For each pair of orthologous proteins of two species the measured % of divergence (100—%identity) was normalized by the genome-wide average of % divergence. A sliding window of 101 genes generates data that can highlight regions where proteins diverge faster (red) or slower (blue) than the genome wide average. Heatmaps were made with the gene order of the human genome (a) and chicken genome (b). Note typically high rates of protein divergence in the chicken microchromosomes and in genes where mapping in the chicken genome is still unknown (PU). Individual lines represent three different groups of comparisons: avian//avian (1–28), avian//non-avian reptile (29–60), non-avian reptile//non-avian reptile (61–66)
Fig. 5
Fig. 5
Proof of concept of four "hidden" chicken genes. a After obtaining the complete coding sequence we assessed by quantitative PCR the expression profiles of muscle-type aldolase (ALDOA), enolase (ENO3), glycogen phosphorylase (PYGM), and glucose transporter (GLUT4). Expression signals were normalized against ribosomal protein gene RPS13 [74] and calculated relative to the expression ratio in pectoralis muscle. b Western blot of immunoreactive GLUT4 using protein extracts from the same tissue panel as for the mRNA analysis. Lower panel shows abundance of glyceraldehyde-3-phosphate dehydrogenase (GAPDH). c and d Schematic representation of human (c) and chicken (d) GLUT4 primary structure in a model of 12 transmembrane helices that surround the water-filled glucose diffusion pore [23]. Small circles, identical residues in both species; green, one of the following four amino acids (GARP) encoded by GC-rich codons. Residues that are important for sugar binding and transport and for GLUT4 recycling are conserved (violet and pink circles). e Counts (%) of glycine, alanine, arginine and proline in membrane and non-membrane parts in the human and chicken GLUT4. The avian increase in GARP is not random. For instance, the number of helix-disrupting prolines only rise in the non-membrane segments of the protein
Fig. 6
Fig. 6
Effect of GC content on “missing genes” in non-avian genomes. For each three genome comparisons (Panthera, a; Myotis, b; Crocodylia, c), the upper panel shows the GC content landscapes of the two species. In red, the species with the highest number of genes in the comparison is shown, while the less well annotated genome is shown in black. The lower panels represent the presence score, which was calculated for each gene as follows: − 1 = only present in the best annotated genome; 0 = present in both genomes; + 1 = only present in the least annotated genome. A sliding window of 101 genes was applied to the presence score and GC% showing a clearcut correlation between the two parameters. Thus, also in non-avian genomes a higher number of "missing" genes is found in regions with elevated GC%

Similar articles

Cited by

References

    1. Zhou Z, Barrett PM, Hilton J. An exceptionally preserved Lower Cretaceous ecosystem. Nature. 2003;421:807–814. doi: 10.1038/nature01420. - DOI - PubMed
    1. Brusatte SL, O’Connor JK, Jarvis ED. The origin and diversification of birds. Curr Biol. 2015;25:R888–R898. doi: 10.1016/j.cub.2015.08.003. - DOI - PubMed
    1. Zhang G, Li C, Li Q, Li B, Larkin DM, Lee C, et al. Comparative genomics reveals insights into avian genome evolution and adaptation. Science. 2014;346:1311–1320. doi: 10.1126/science.1251385. - DOI - PMC - PubMed
    1. Jarvis ED, Mirarab S, Aberer AJ, Li B, Houde P, Li C, et al. Whole-genome analyses resolve early branches in the tree of life of modern birds. Science. 2014;346:1320–1331. doi: 10.1126/science.1253451. - DOI - PMC - PubMed
    1. Carpenter KJ, Sutherland B. Eijkman’s contribution to the discovery of vitamins. J Nutr. 1995;125:155–163. - PubMed

Publication types

LinkOut - more resources