. 2021 Sep 18;79(1):167.
doi: 10.1186/s13690-021-00686-1.

Prevalence and predictors of hepatitis B virus (HBV) infection in east Africa: evidence from a systematic review and meta-analysis of epidemiological studies published from 2005 to 2020

Affiliations

Prevalence and predictors of hepatitis B virus (HBV) infection in east Africa: evidence from a systematic review and meta-analysis of epidemiological studies published from 2005 to 2020

Hussein Mukasa Kafeero et al. Arch Public Health. .

Abstract

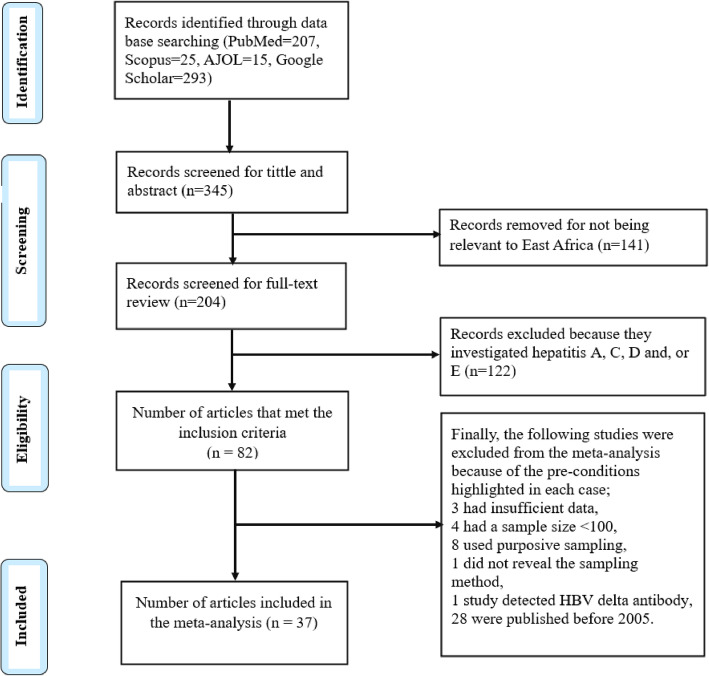
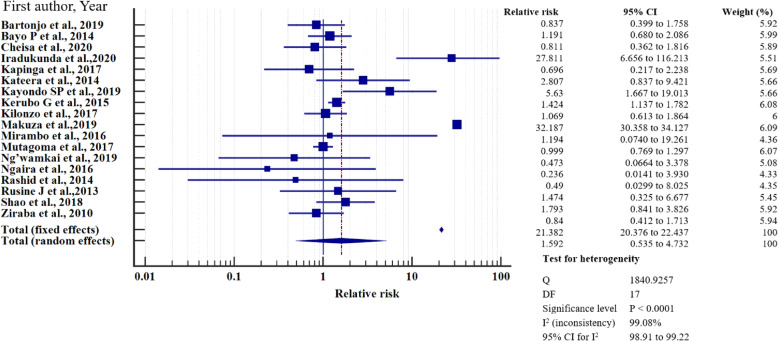
Background: The epidemiology of hepatitis B virus (HBV) in the general population in east Africa is not well documented. In this meta-analysis, we examined 37 full published research articles to synthesise up-to-date data on the prevalence and predictors of the HBV burden for the effective prevention and management of the virus in our region.

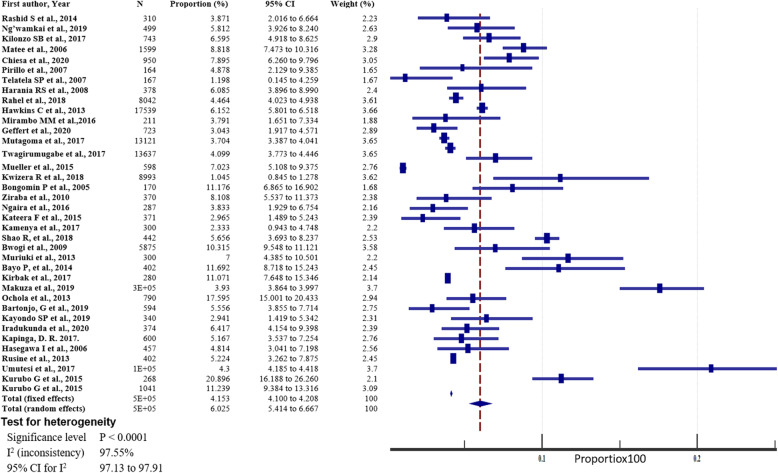
Methods: We examined 37 full published research articles found using PubMed, Scopus, African Journal Online (AJOL), and Google Scholar between May and October 2020. Dichotomous data on HBV prevalence and predictors of infection were extracted from the individual studies. The HBV prevalence, test of proportion, relative risk, and I2 statistics for heterogeneity were calculated using MedCalc software version 19.1.3. Begg's tests was used to test for publication bias. Sources of heterogeneity were analysed through sensitivity analysis, meta-regression, and sub-group analysis at 95% CI. P < 0.05 was considered significant for all analyses.

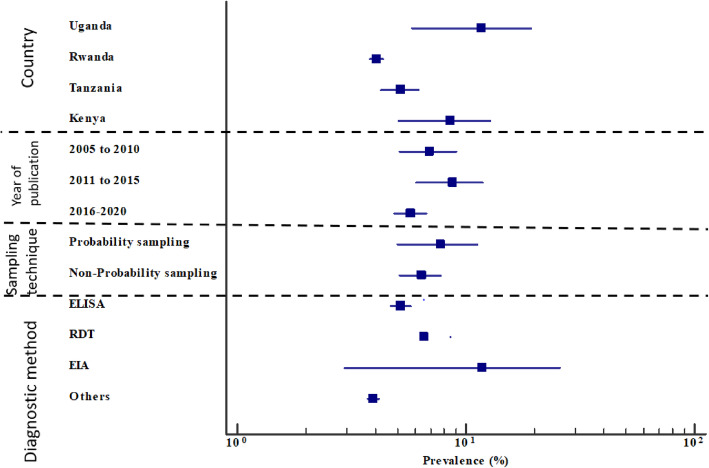
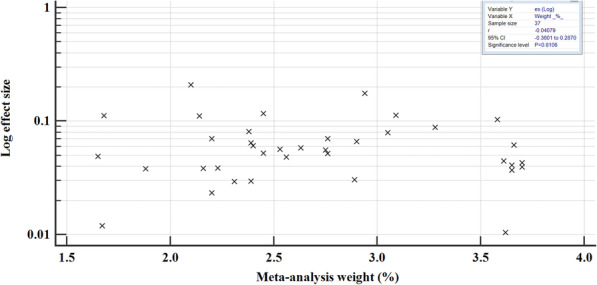
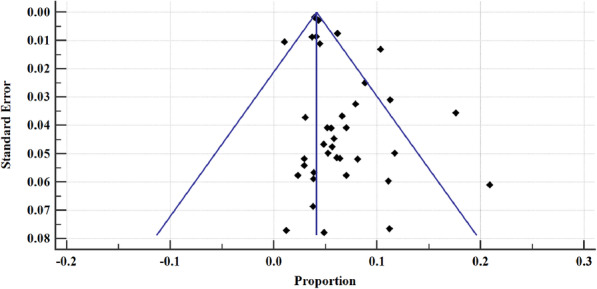
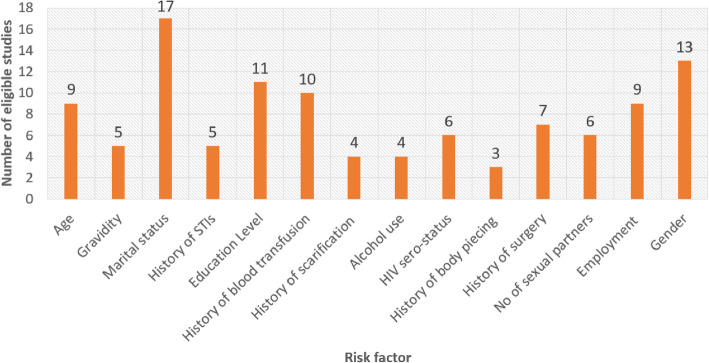
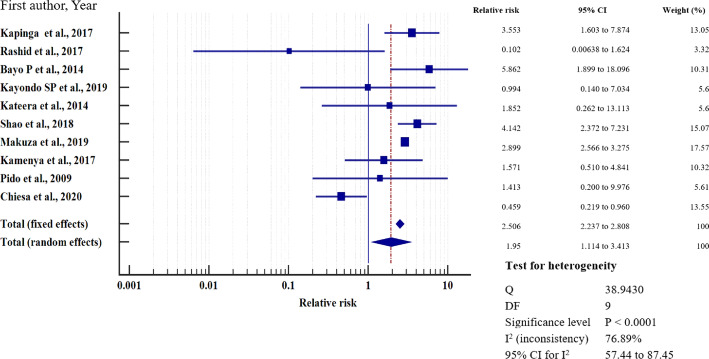
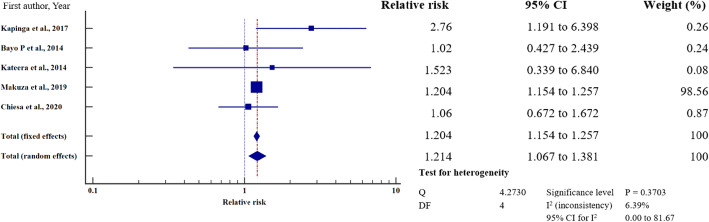
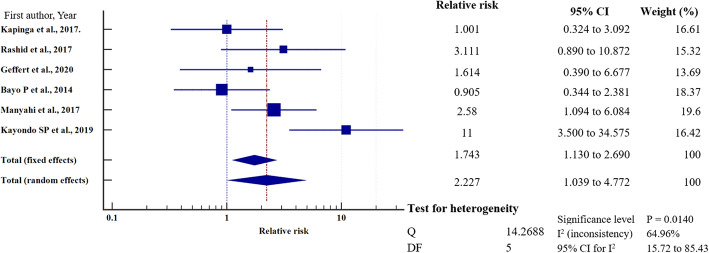
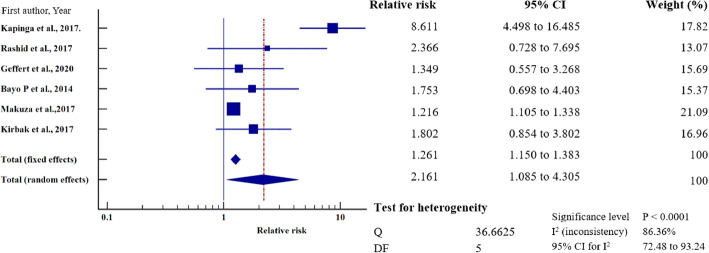
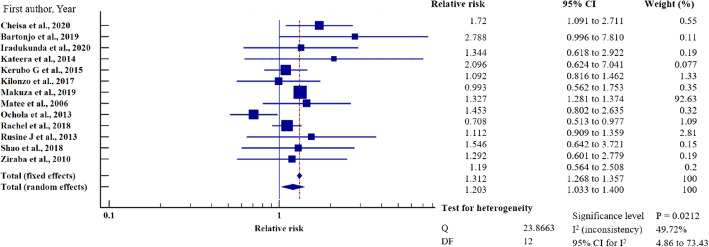
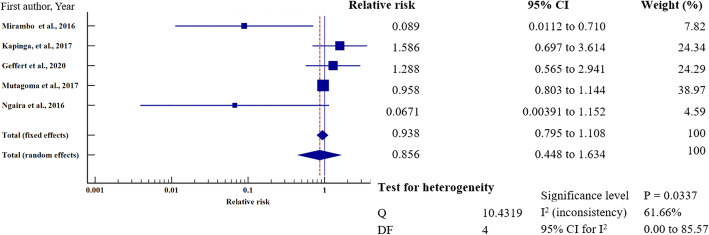
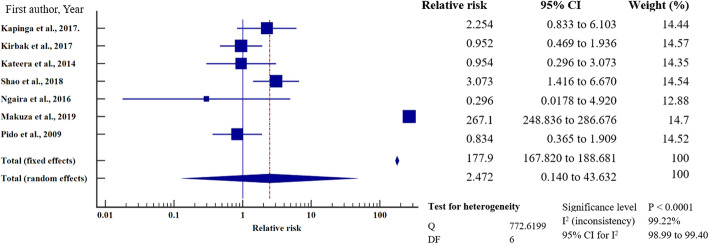
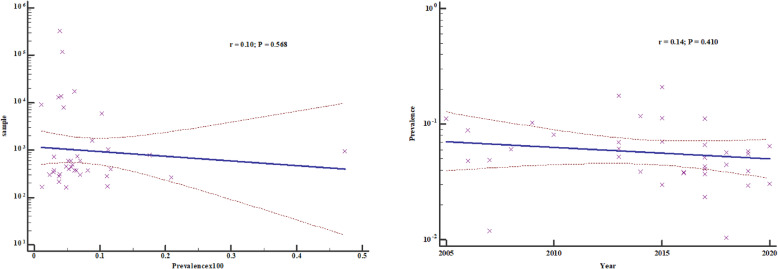
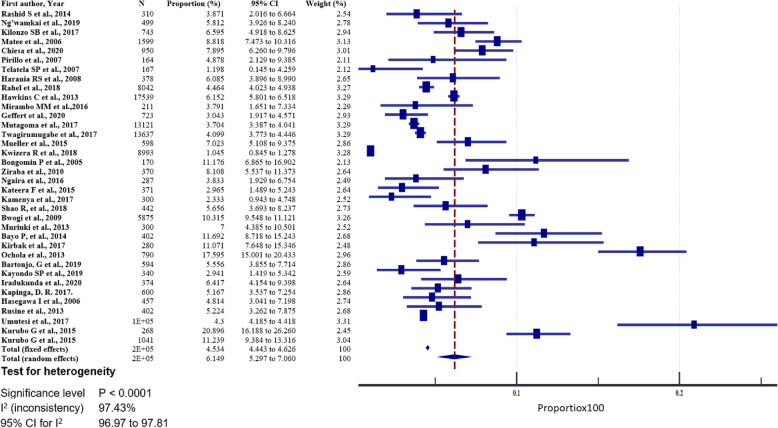
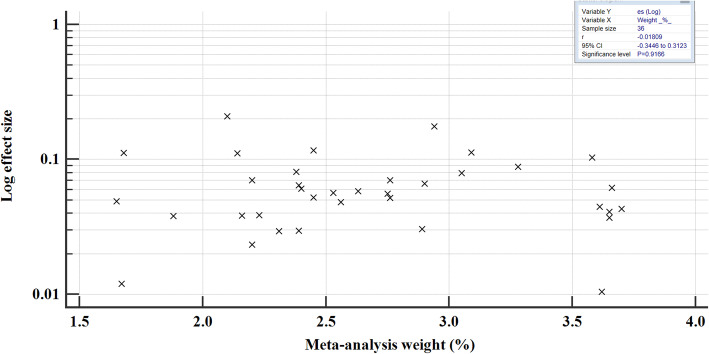
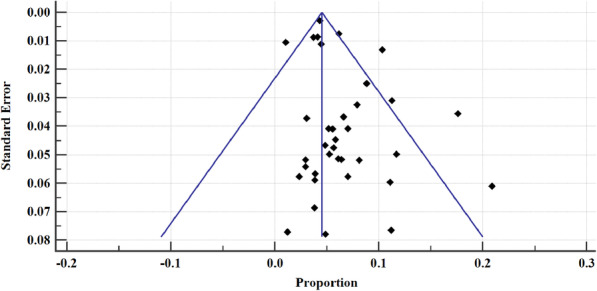
Results: The prevalence of HBV was generally high (6.025%), with publications from Kenya (8.54%), Uganda (8.454%) and those from between 2011 and 2015 (8.759%) reporting the highest prevalence (P < 0.05). Blood transfusion, scarification, promiscuity, HIV seropositivity, and being male were independent predictors significantly associated with HBV infection (P < 0.05), with the male sex being the most strongly associated predictor of HBV infection. Meta-regressions for the pooled HBV prevalence and sample size, as well as the year of publication, lacked statistical significance (P > 0.05). Omitting the study with the largest sample size slightly increased pooled HBV prevalence to 6.149%, suggesting that the studies are robust. Begg's test showed no evidence of publication bias for overall meta-analysis (p > 0.05).

Conclusion: The burden of HBV is still high, with the male sex, blood transfusion, body scarification, and HIV seropositivity being potential predictors of infection. Thus, it is important to scale up control and prevention measures targeting persons at high risk.

Keywords: East Africa; HBsAg; Hepatitis B; Predictors; Prevalence.


Conflict of interest statement

The authors declare that they have no competing interests.

Figures

Fig. 1
Fig. 1
Flow chart for study eligibility following PRISMA criterion; AJOL: African Journal Online, HBV: Hepatitis B Virus
Fig. 2
Fig. 2
Contribution of eligible studies for inclusion in the meta-analysis by country
Fig. 3
Fig. 3
Forest plot showing the HBV prevalence by country, publication period, sampling technique and HBsAg detection method; the blue diamond indicates the pooled prevalence of HBV and the horizontal line shows the 95% confidence interval. The longer the lines, the greater is the deviation from the pooled prevalence; ELISA: Enzyme Linked Immunosorbent Assay, RDT: Rapid Diagnostic Test, EIA: Enzyme Immunoassay
Fig. 4
Fig. 4
Pooled prevalence estimate of HBV in East-Africa by random effects model
Fig. 5
Fig. 5
Begg’s correlation test for publication bias; correlation of log effect size with meta-analysis weight for all the epidemiological studies published between 2005 to 2020 included in the meta-analysis
Fig. 6
Fig. 6
Bias assessment plot of studies reporting hepatitis B virus prevalence in East Africa from epidemiological studies published between 2005 to 2020 included in the data synthesis
Fig. 7
Fig. 7
Number of studies with disaggregated data on risk factors associated with HBV infection
Fig. 8
Fig. 8
History of blood transfusion on the risk of HBV infection when compared between those who have had blood transfusion and those who have never transfused. The RR > 1 indicates increased risk or susceptibility to HBV infection whereas the RR < 1 indicates reduced risk to HBV infection
Fig. 9
Fig. 9
History of scarification on the risk of HBV infection when compared between those with the history of scarification and those who have never scarified. The RR > 1 indicates increased risk or susceptibility to HBV infection whereas the RR < 1 indicates reduced risk to HBV infection
Fig. 10
Fig. 10
HIV sero-status on the risk of HBV infection when compared between the HIV sero-positive and sero-negative. The RR > 1 indicates increased risk or susceptibility to HBV infection whereas the RR < 1 indicates reduced risk to HBV infection
Fig. 11
Fig. 11
Number of sexual partners on the risk of HBV infection when compared those with one sexual partner and those with multiple sexual partners. The RR > 1 indicates increased risk or susceptibility to HBV infection whereas the RR < 1 indicates reduced risk to HBV infection
Fig. 12
Fig. 12
Sex on the risk of HBV infection when compared between the male and female. The RR > 1 indicates increased risk or susceptibility to HBV infection whereas the RR < 1 indicates reduced risk to HBV infection
Fig. 13
Fig. 13
Marital status on the risk of HBV infection when compared between the married and unmarried. Relative Risk (RR) > 1 indicates increased risk or susceptibility to HBV infection whereas the RR < 1 indicates reduced risk to HBV infection
Fig. 14
Fig. 14
Gravidity on the risk of HBV infection when compared between the primagravida and multigravida. Relative Risk (RR) > 1 indicates increased risk or susceptibility to HBV infection whereas the RR < 1 indicates reduced risk to HBV infection
Fig. 15
Fig. 15
History of surgery on the risk of HBV infection when compared between those previously exposed to surgical operation and those who have never. The RR > 1 indicates increased risk or susceptibility to HBV infection whereas the RR < 1 indicates reduced risk to HBV infection
Fig. 16
Fig. 16
Meta-regression analysis for the heterogeneity of HBV prevalence in East Africa 2005 to 2020
Fig. 17
Fig. 17
Forest plot for sensitivity analysis with one study with the highest sample size omitted
Fig. 18
Fig. 18
Begg’s correlation test for publication bias; correlation of log effect size and meta-analysis weight after exclusion of the study with the largest sample size
Fig. 19
Fig. 19
Bias assessment plot for sensitivity analysis of studies reporting hepatitis B virus prevalence in East Africa from 2005 to 2020

References

    1. Matsuura MK, Tanaka Y, Hige S, Yamada G, Murawaki Y, Komatsu M, et al. Distribution of hepatitis B virus genotypes among patients with chronic infection in Japan shifting toward an increase of genotype A. J Clin Microbiol. 2009;47(5):1476–1483. doi: 10.1128/JCM.02081-08. - DOI - PMC - PubMed
    1. Nguyen VT, Law MG, Dore GJ. An enormous hepatitis B virus-related liver disease burden projected in Vietnam by 2025. Liver Int. 2008;28(4):525–531. doi: 10.1111/j.1478-3231.2007.01646.x. - DOI - PubMed
    1. Weinbaum C, Williams I, Mast E, Wang S, Finelli L, Wasley A. Recommendations for identification and public health management of persons with chronic hepatitis B virus infection. MMWR Recomm Rep. 2008:1–20. - PubMed
    1. WHO . Global Hepatitis Report. 2017. pp. 0–80.
    1. Seremba E, Ssempijja V, Kalibbala S, Gray RH, Wawer MJ, Nalugoda F, Casper C, Phipps W, Ocama P, Serwadda D, Thomas DL, Reynolds SJ. Hepatitis B incidence and prevention with antiretroviral therapy among HIV-positive individuals in Uganda. AIDS. 2017;31(6):781–786. doi: 10.1097/QAD.0000000000001399. - DOI - PMC - PubMed

LinkOut - more resources