. 2021 Nov:99:102472.
doi: 10.1016/j.ceca.2021.102472. Epub 2021 Sep 10.

Ca2+ transients in ICC-MY define the basis for the dominance of the corpus in gastric pacemaking

Affiliations

Ca2+ transients in ICC-MY define the basis for the dominance of the corpus in gastric pacemaking

Salah A Baker et al. Cell Calcium. 2021 Nov.

Abstract

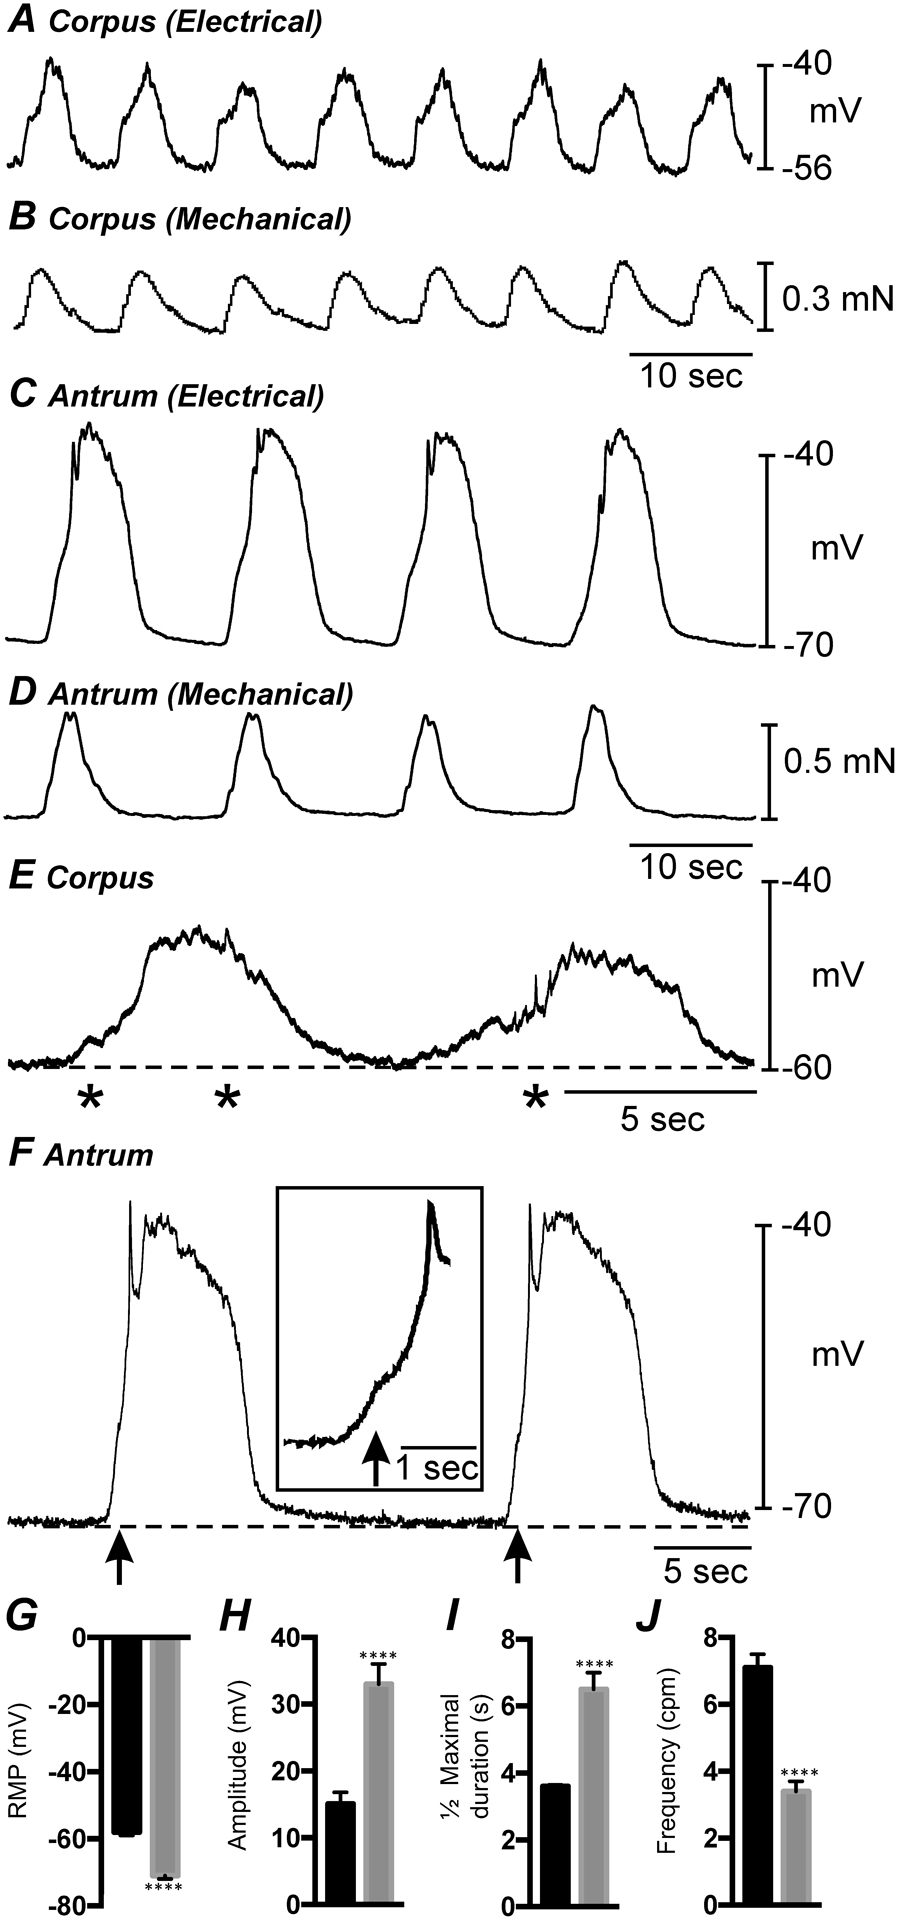
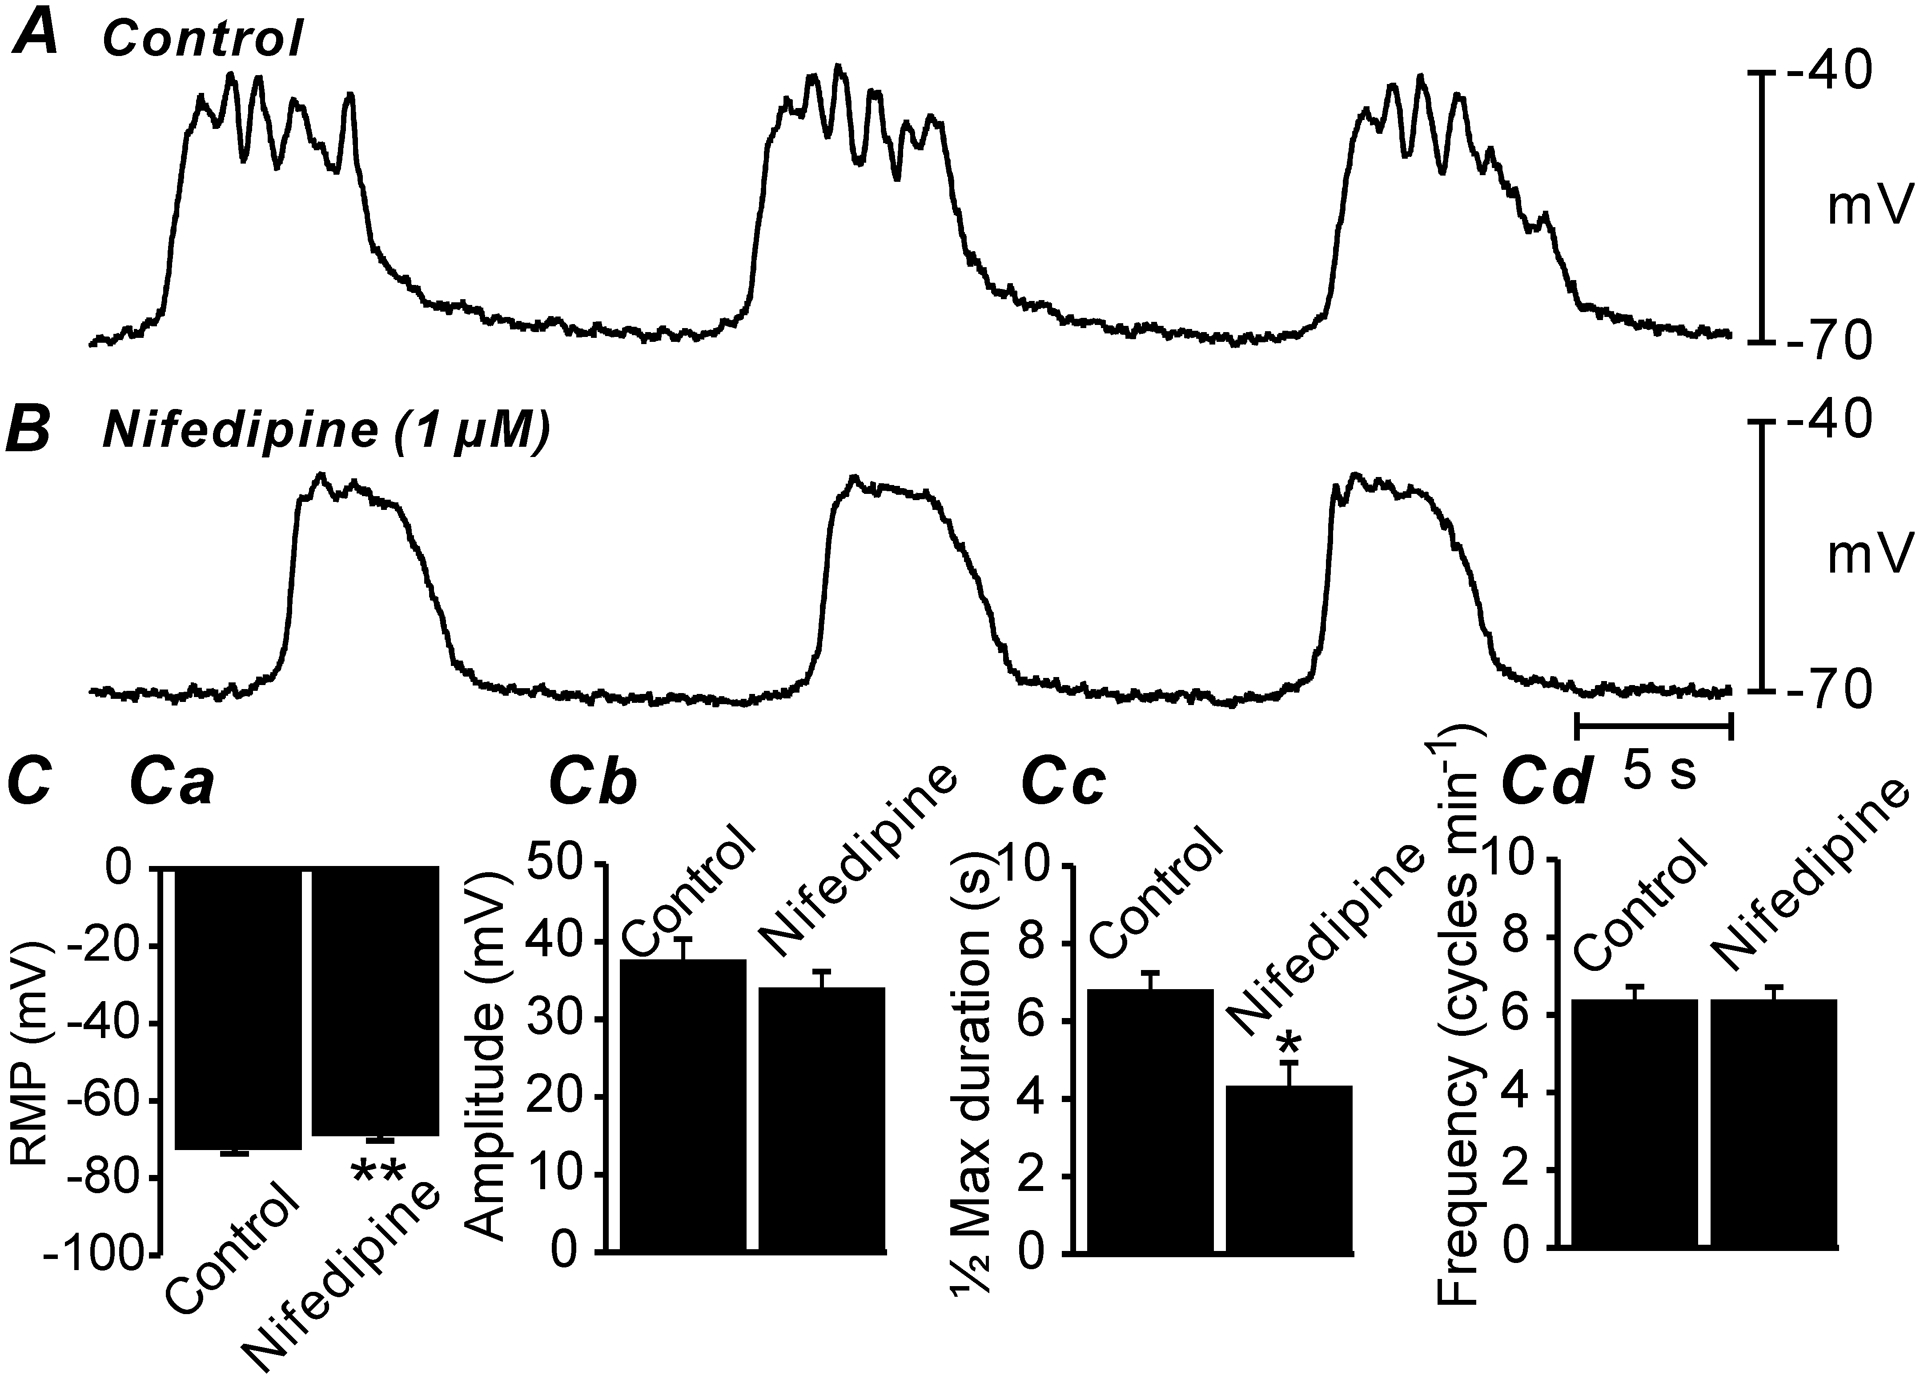
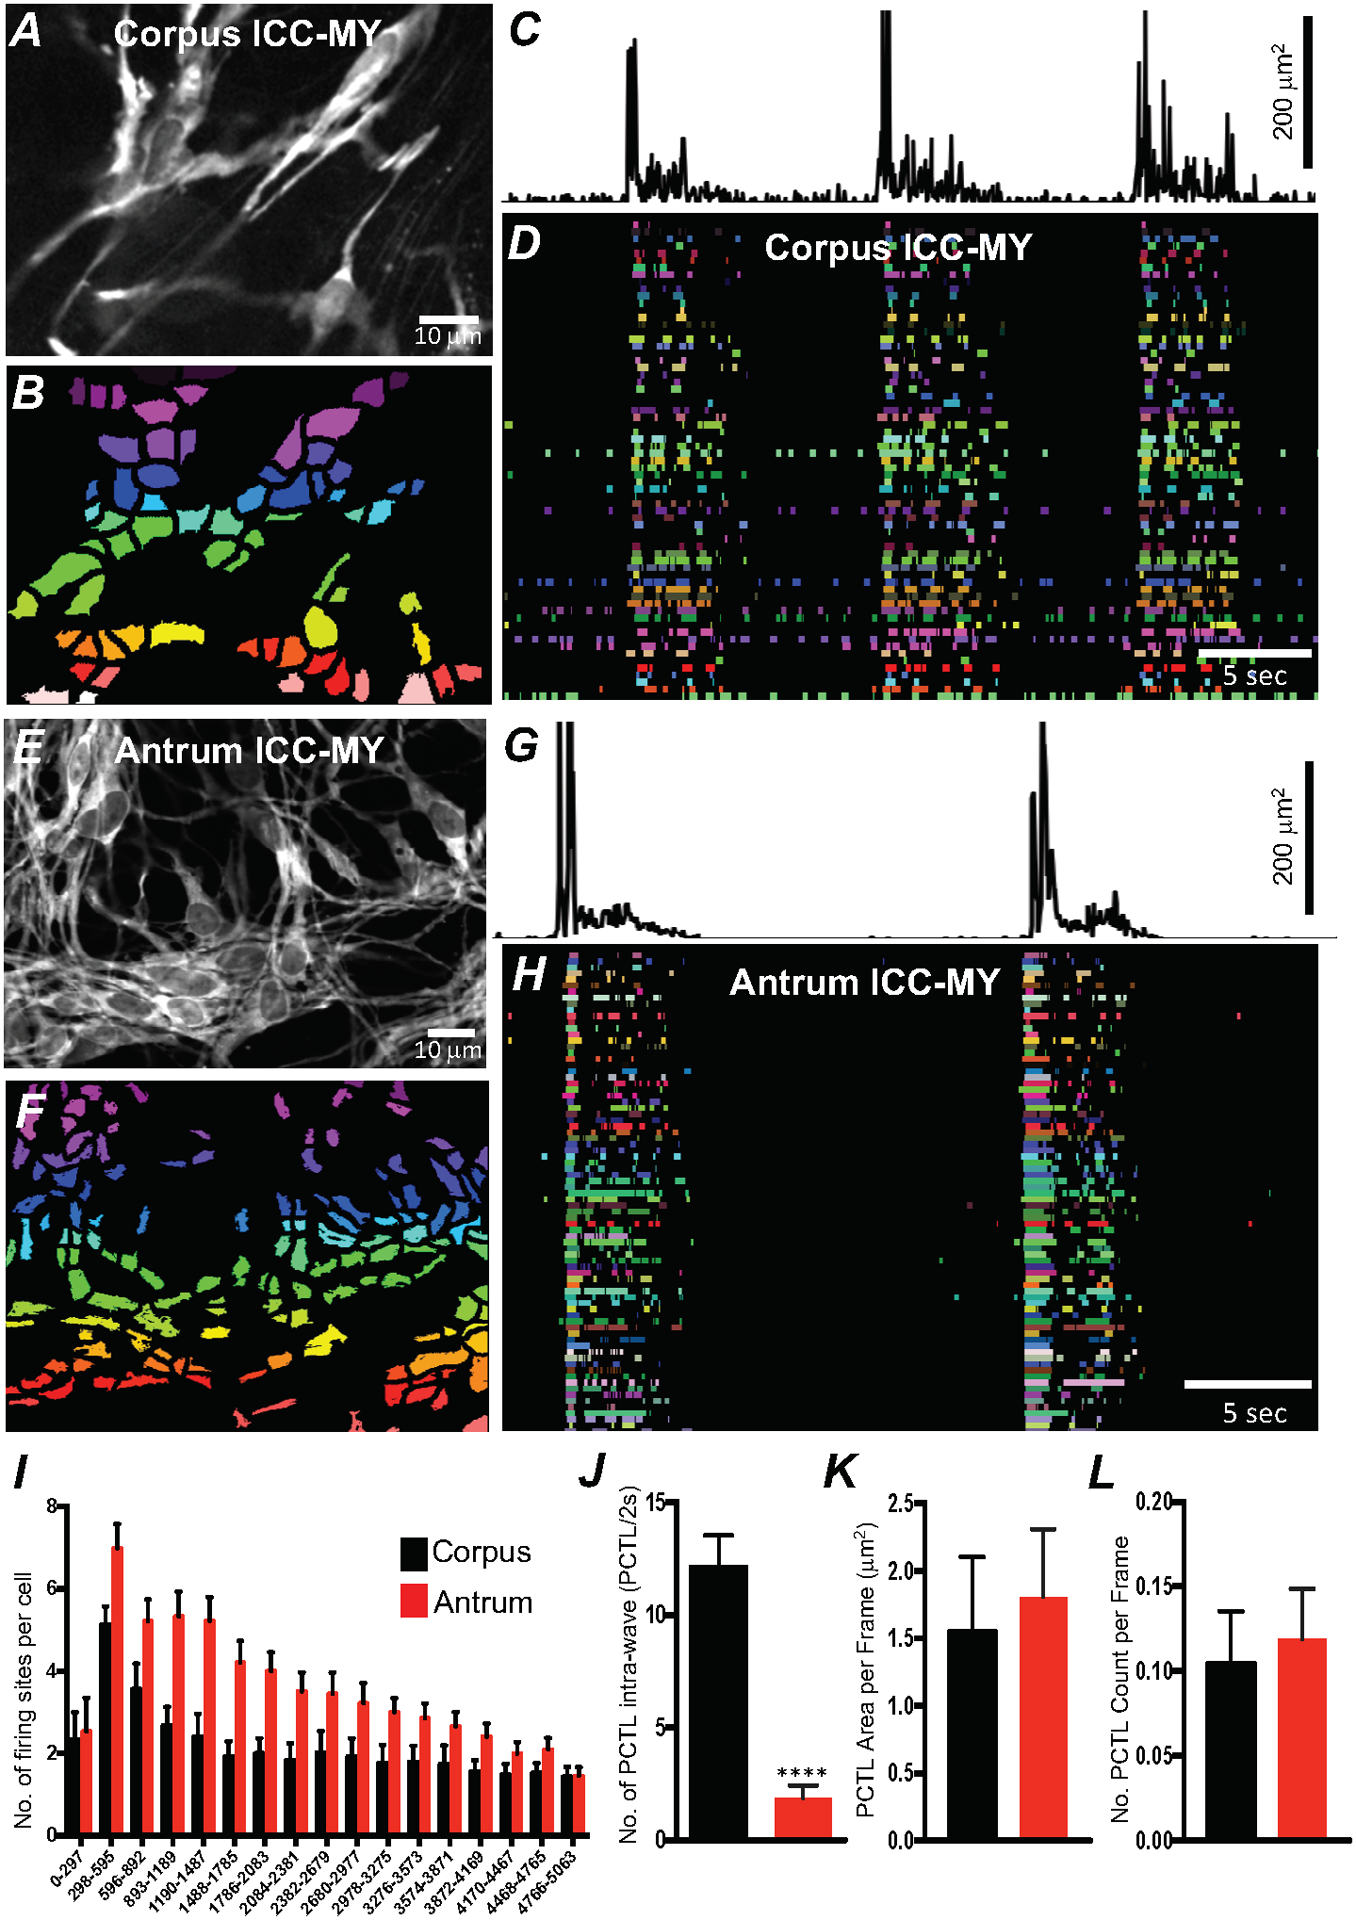
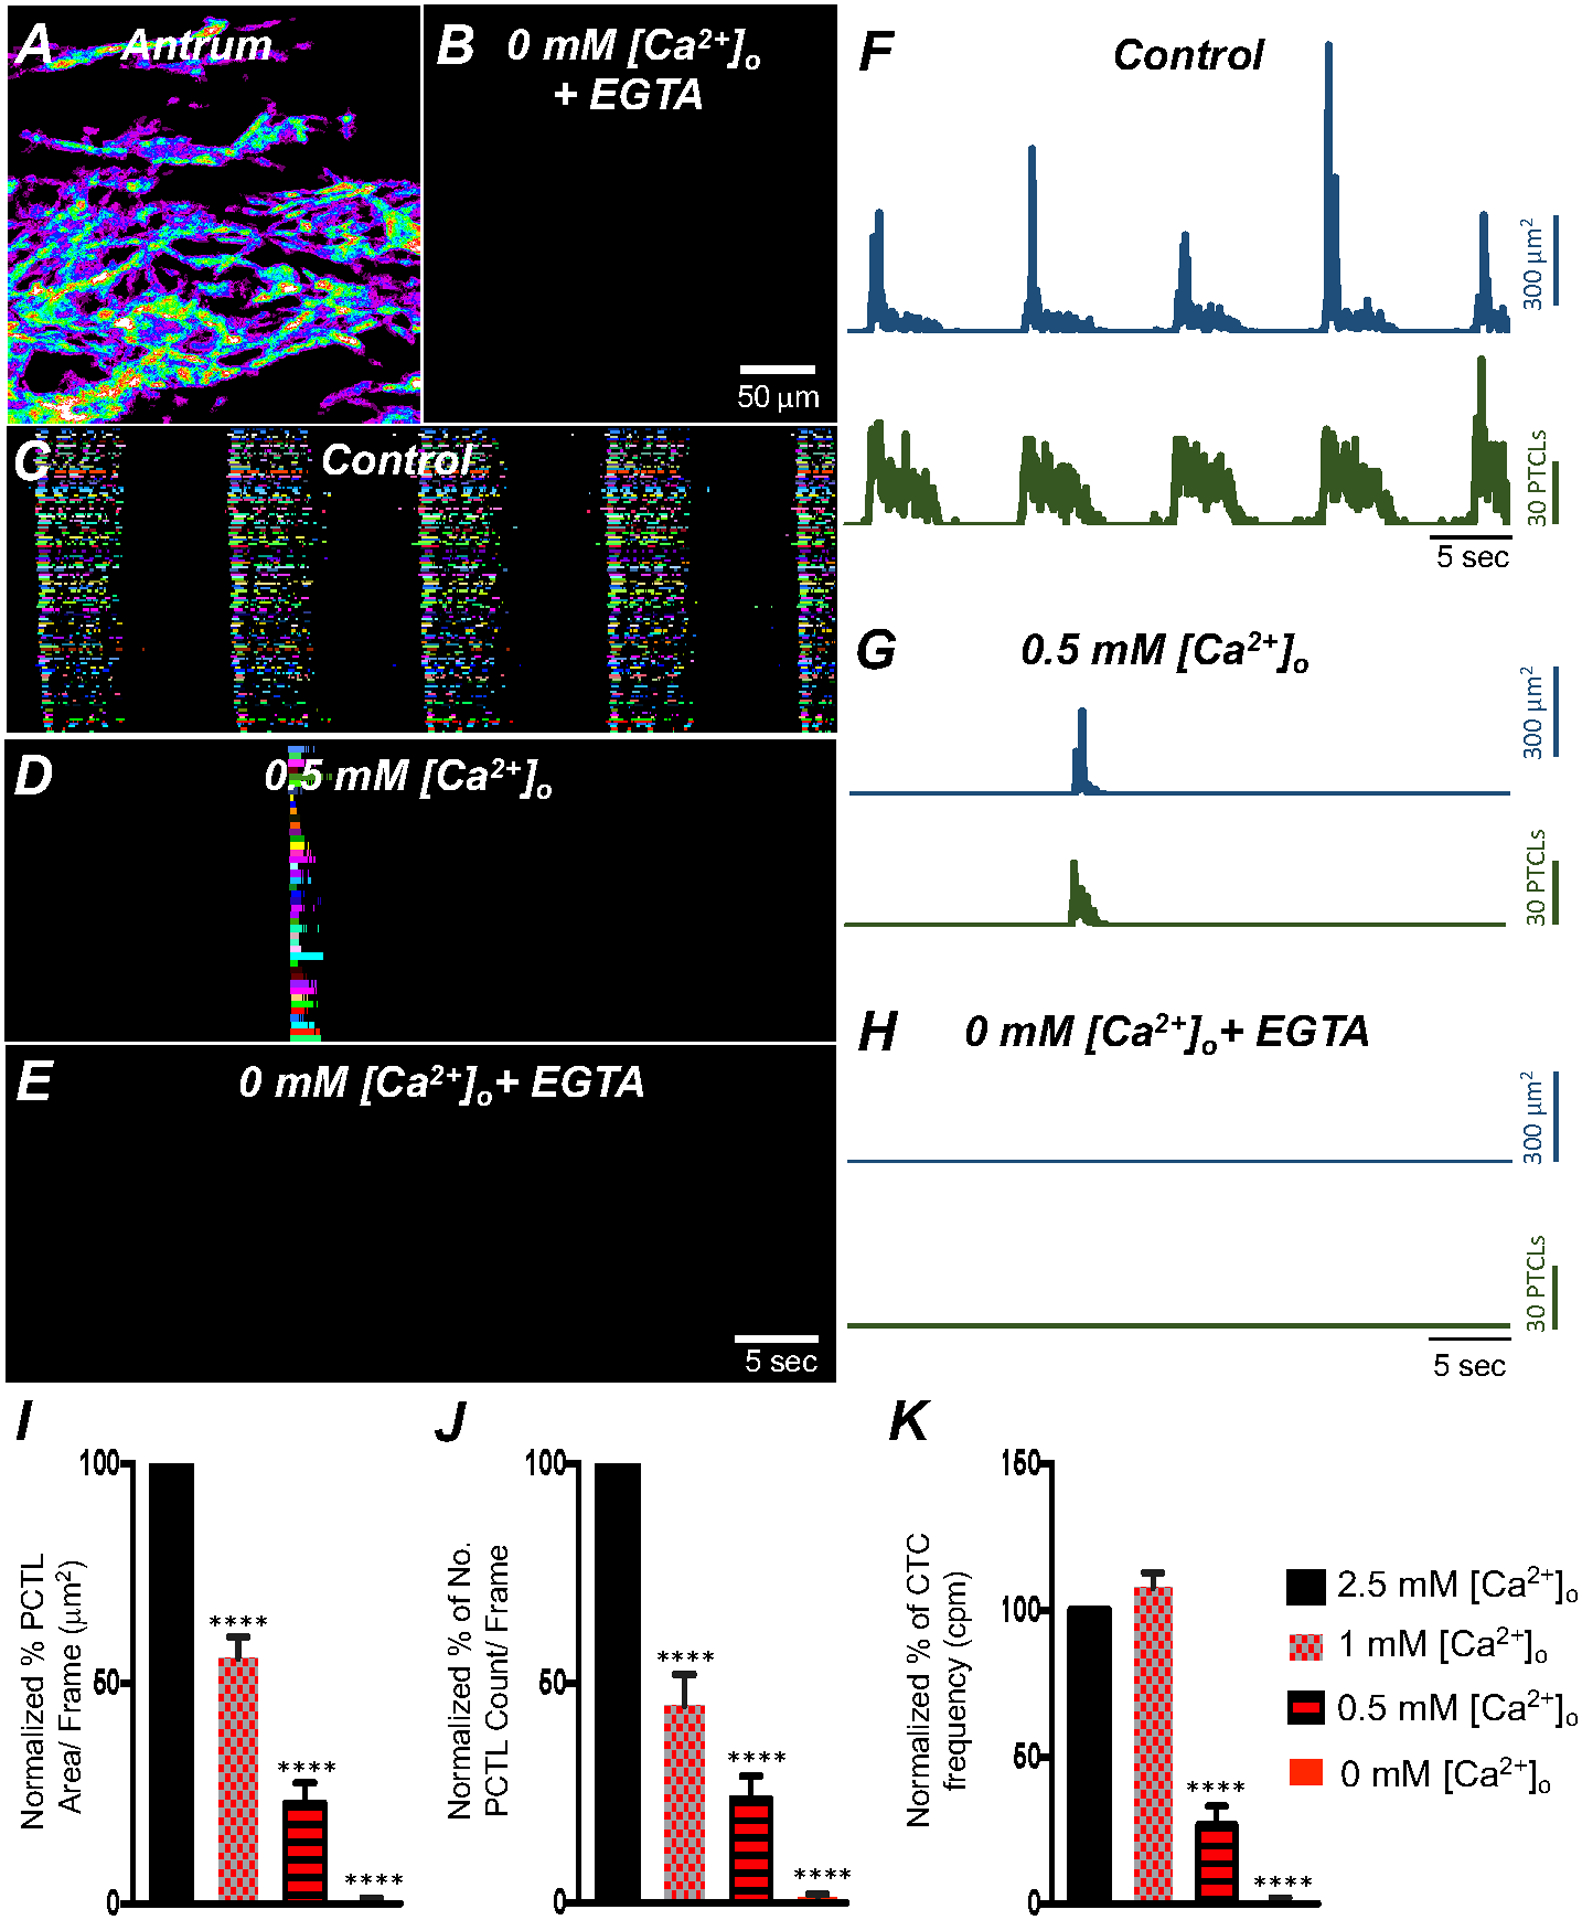
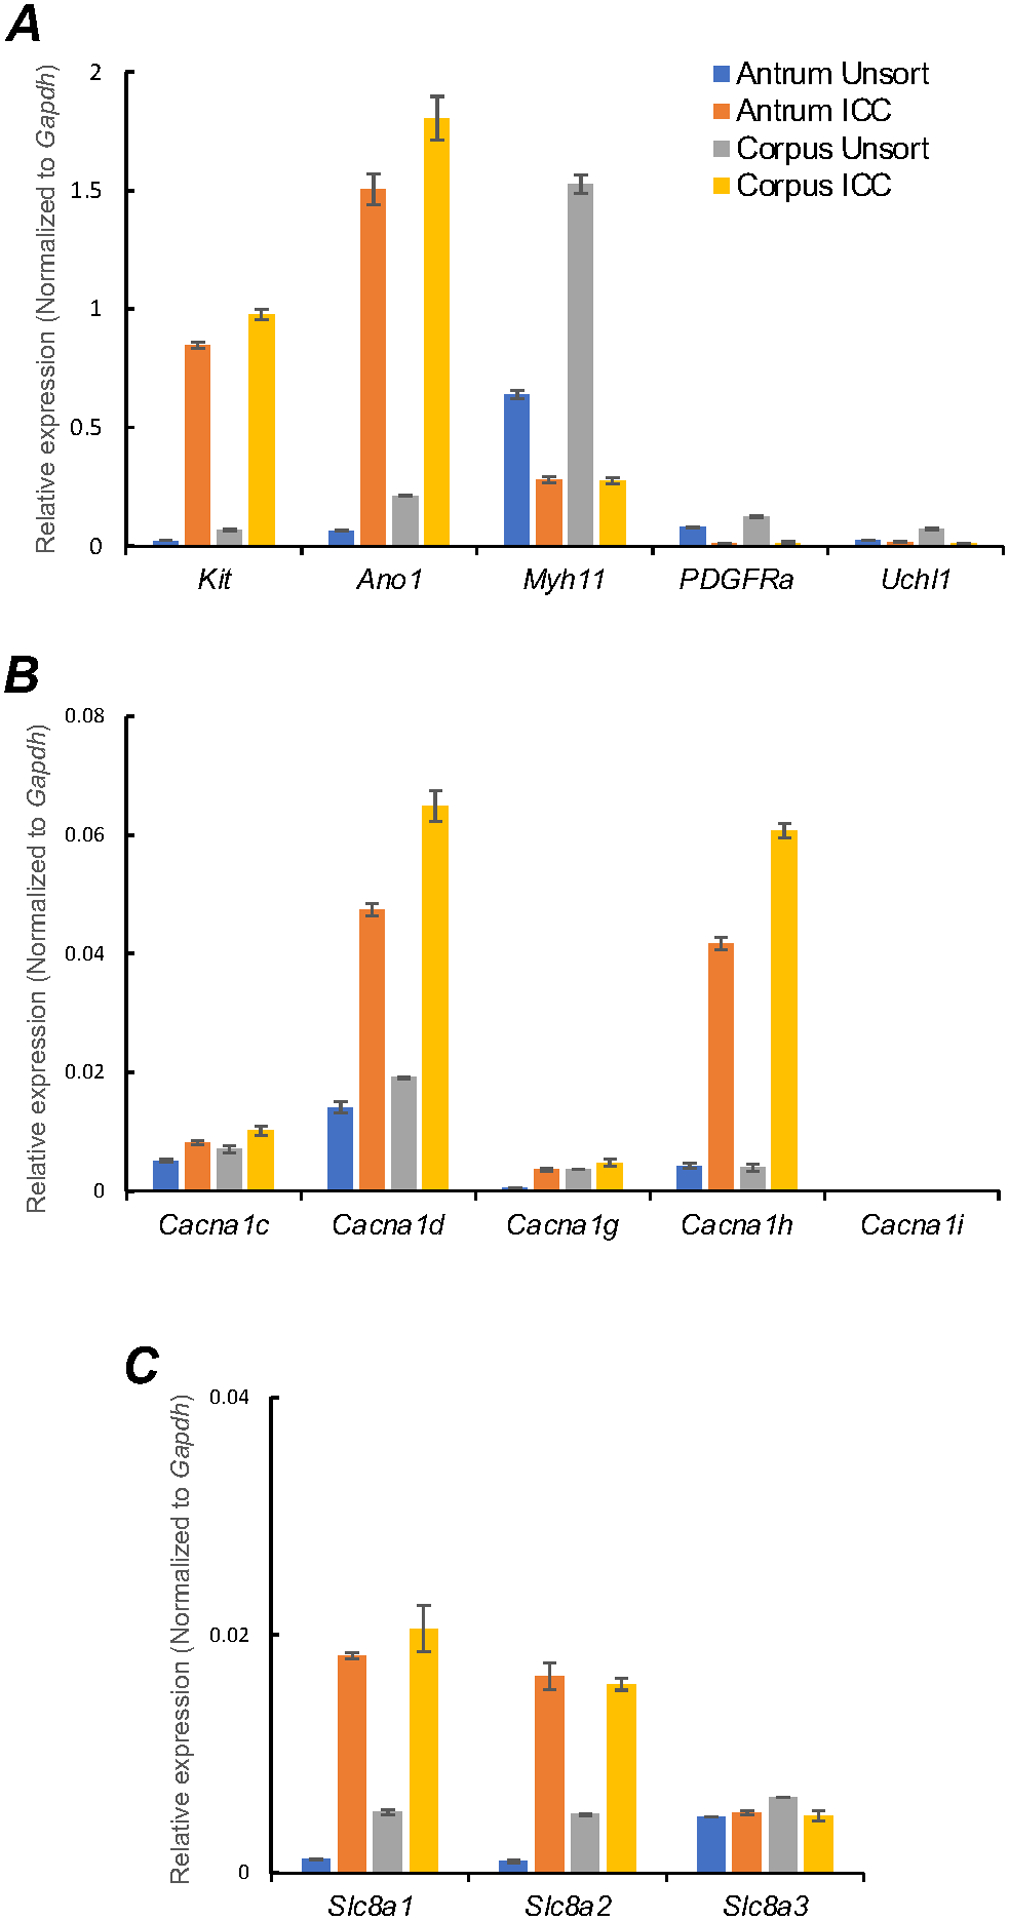
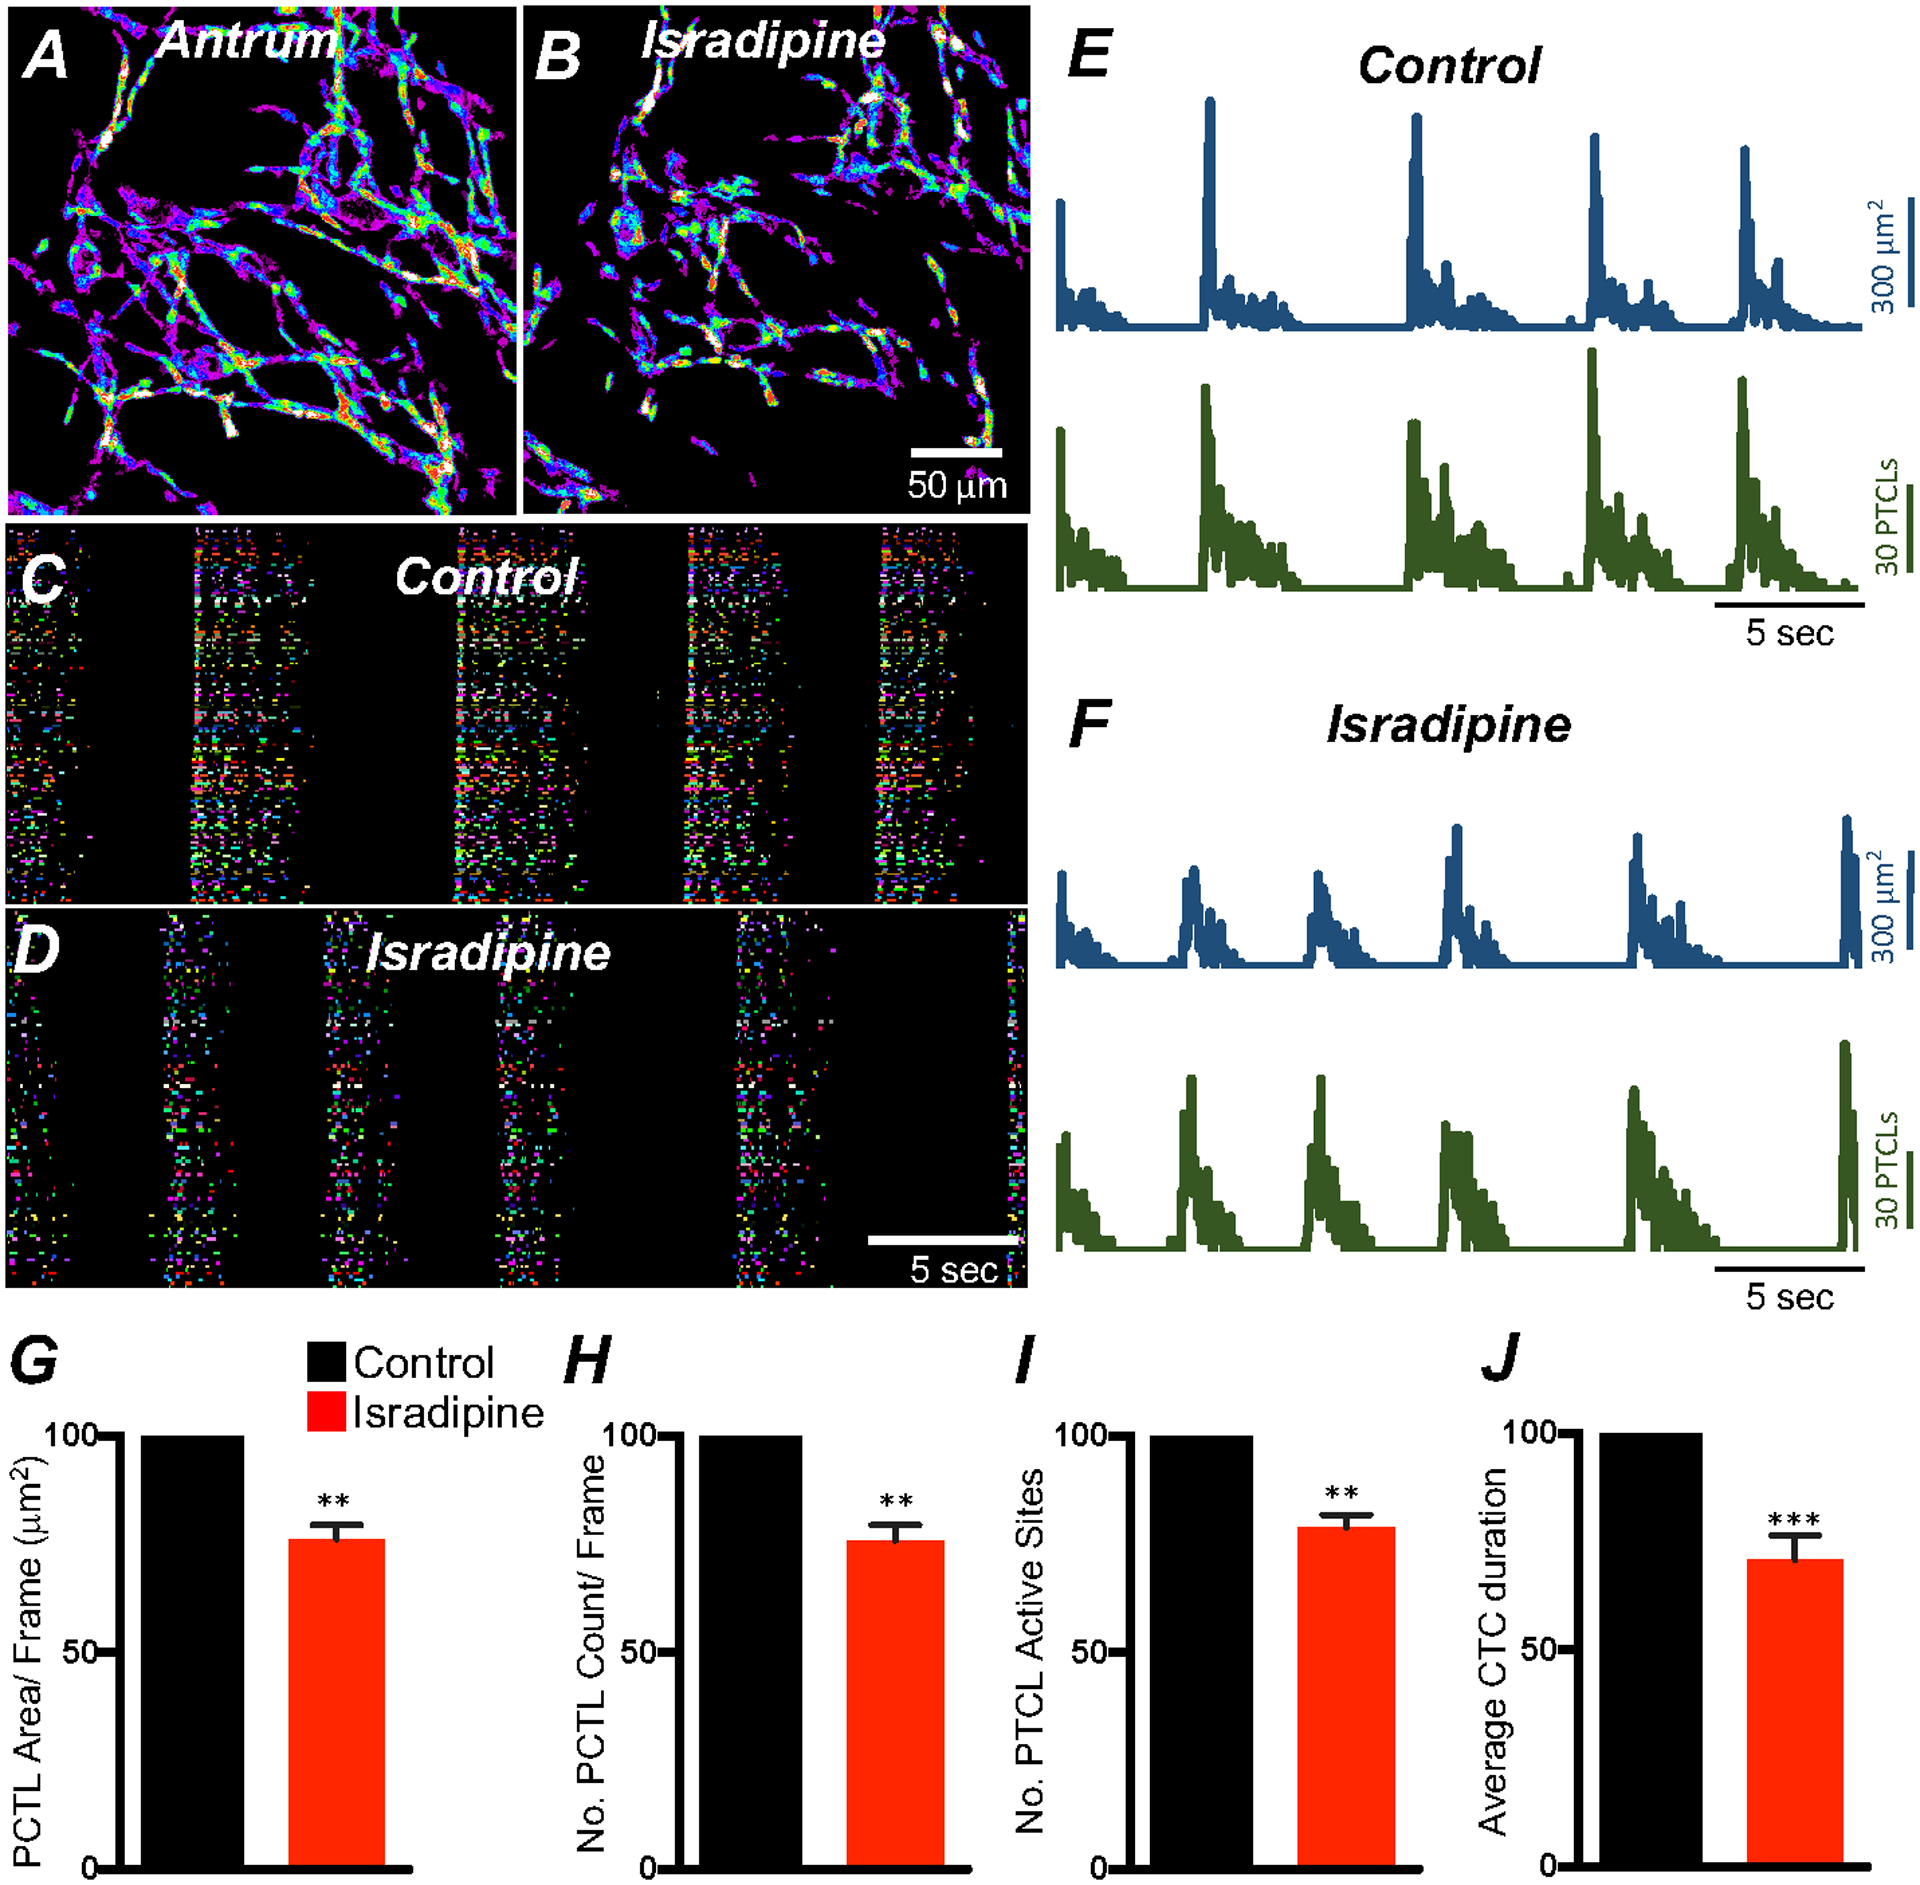
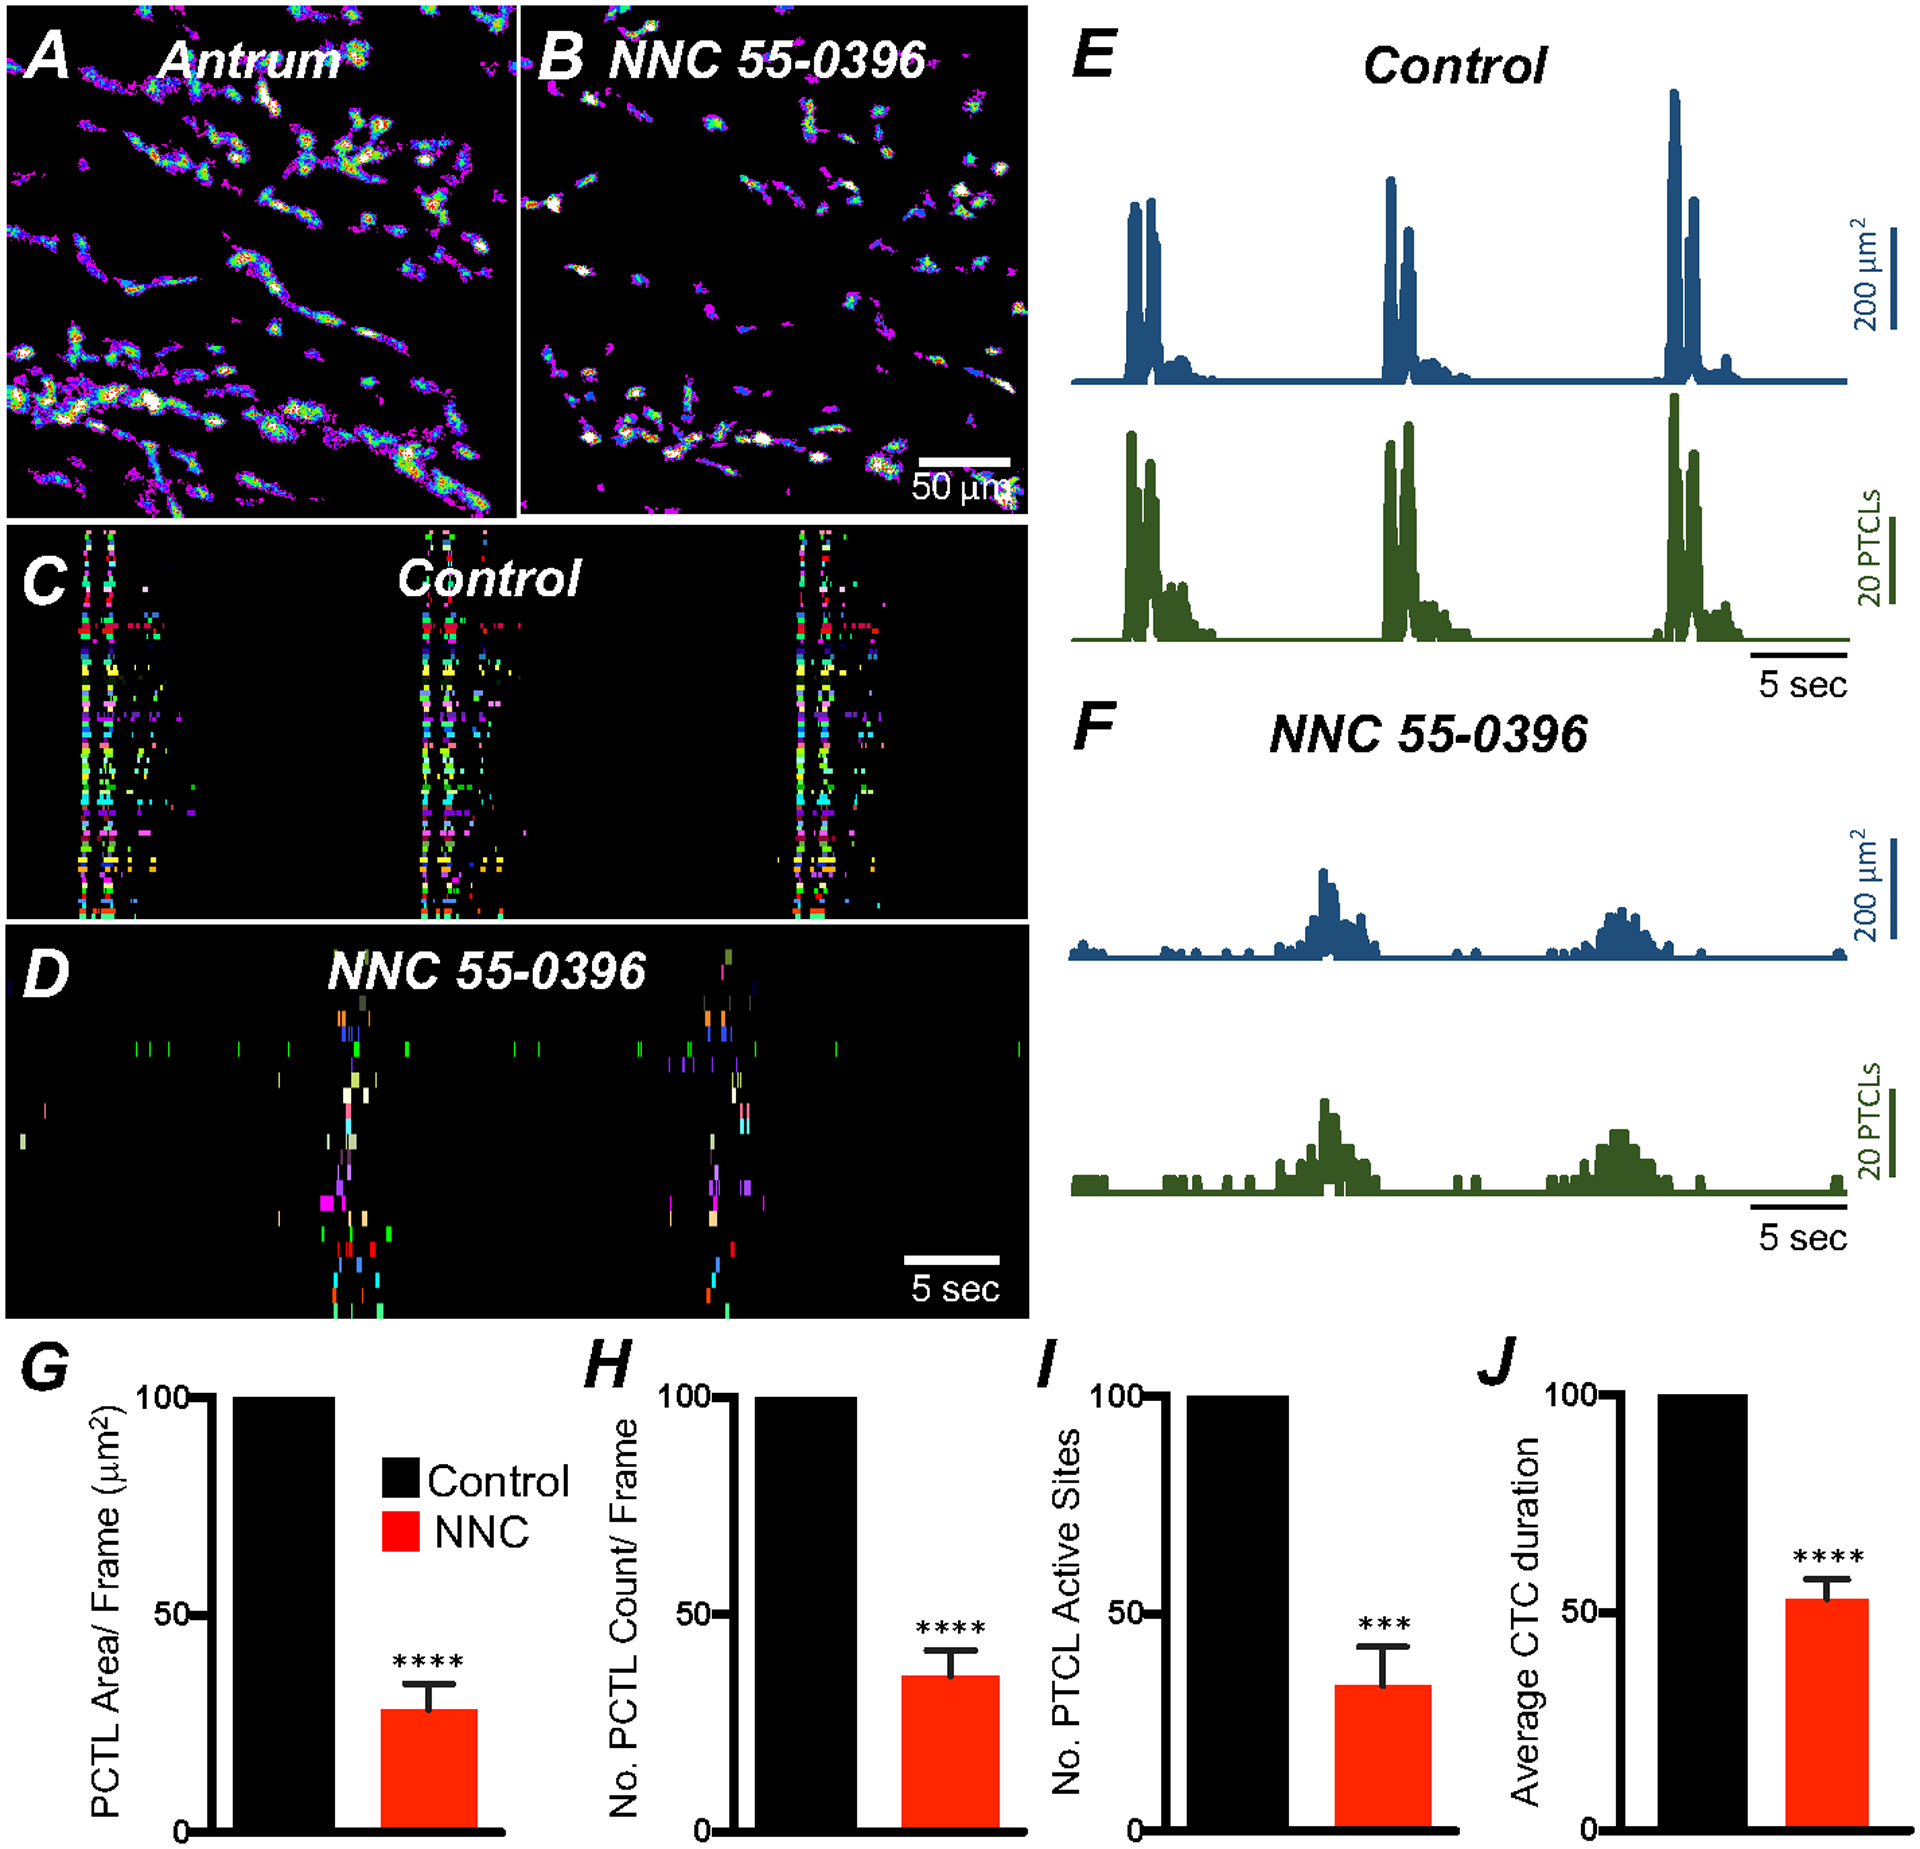
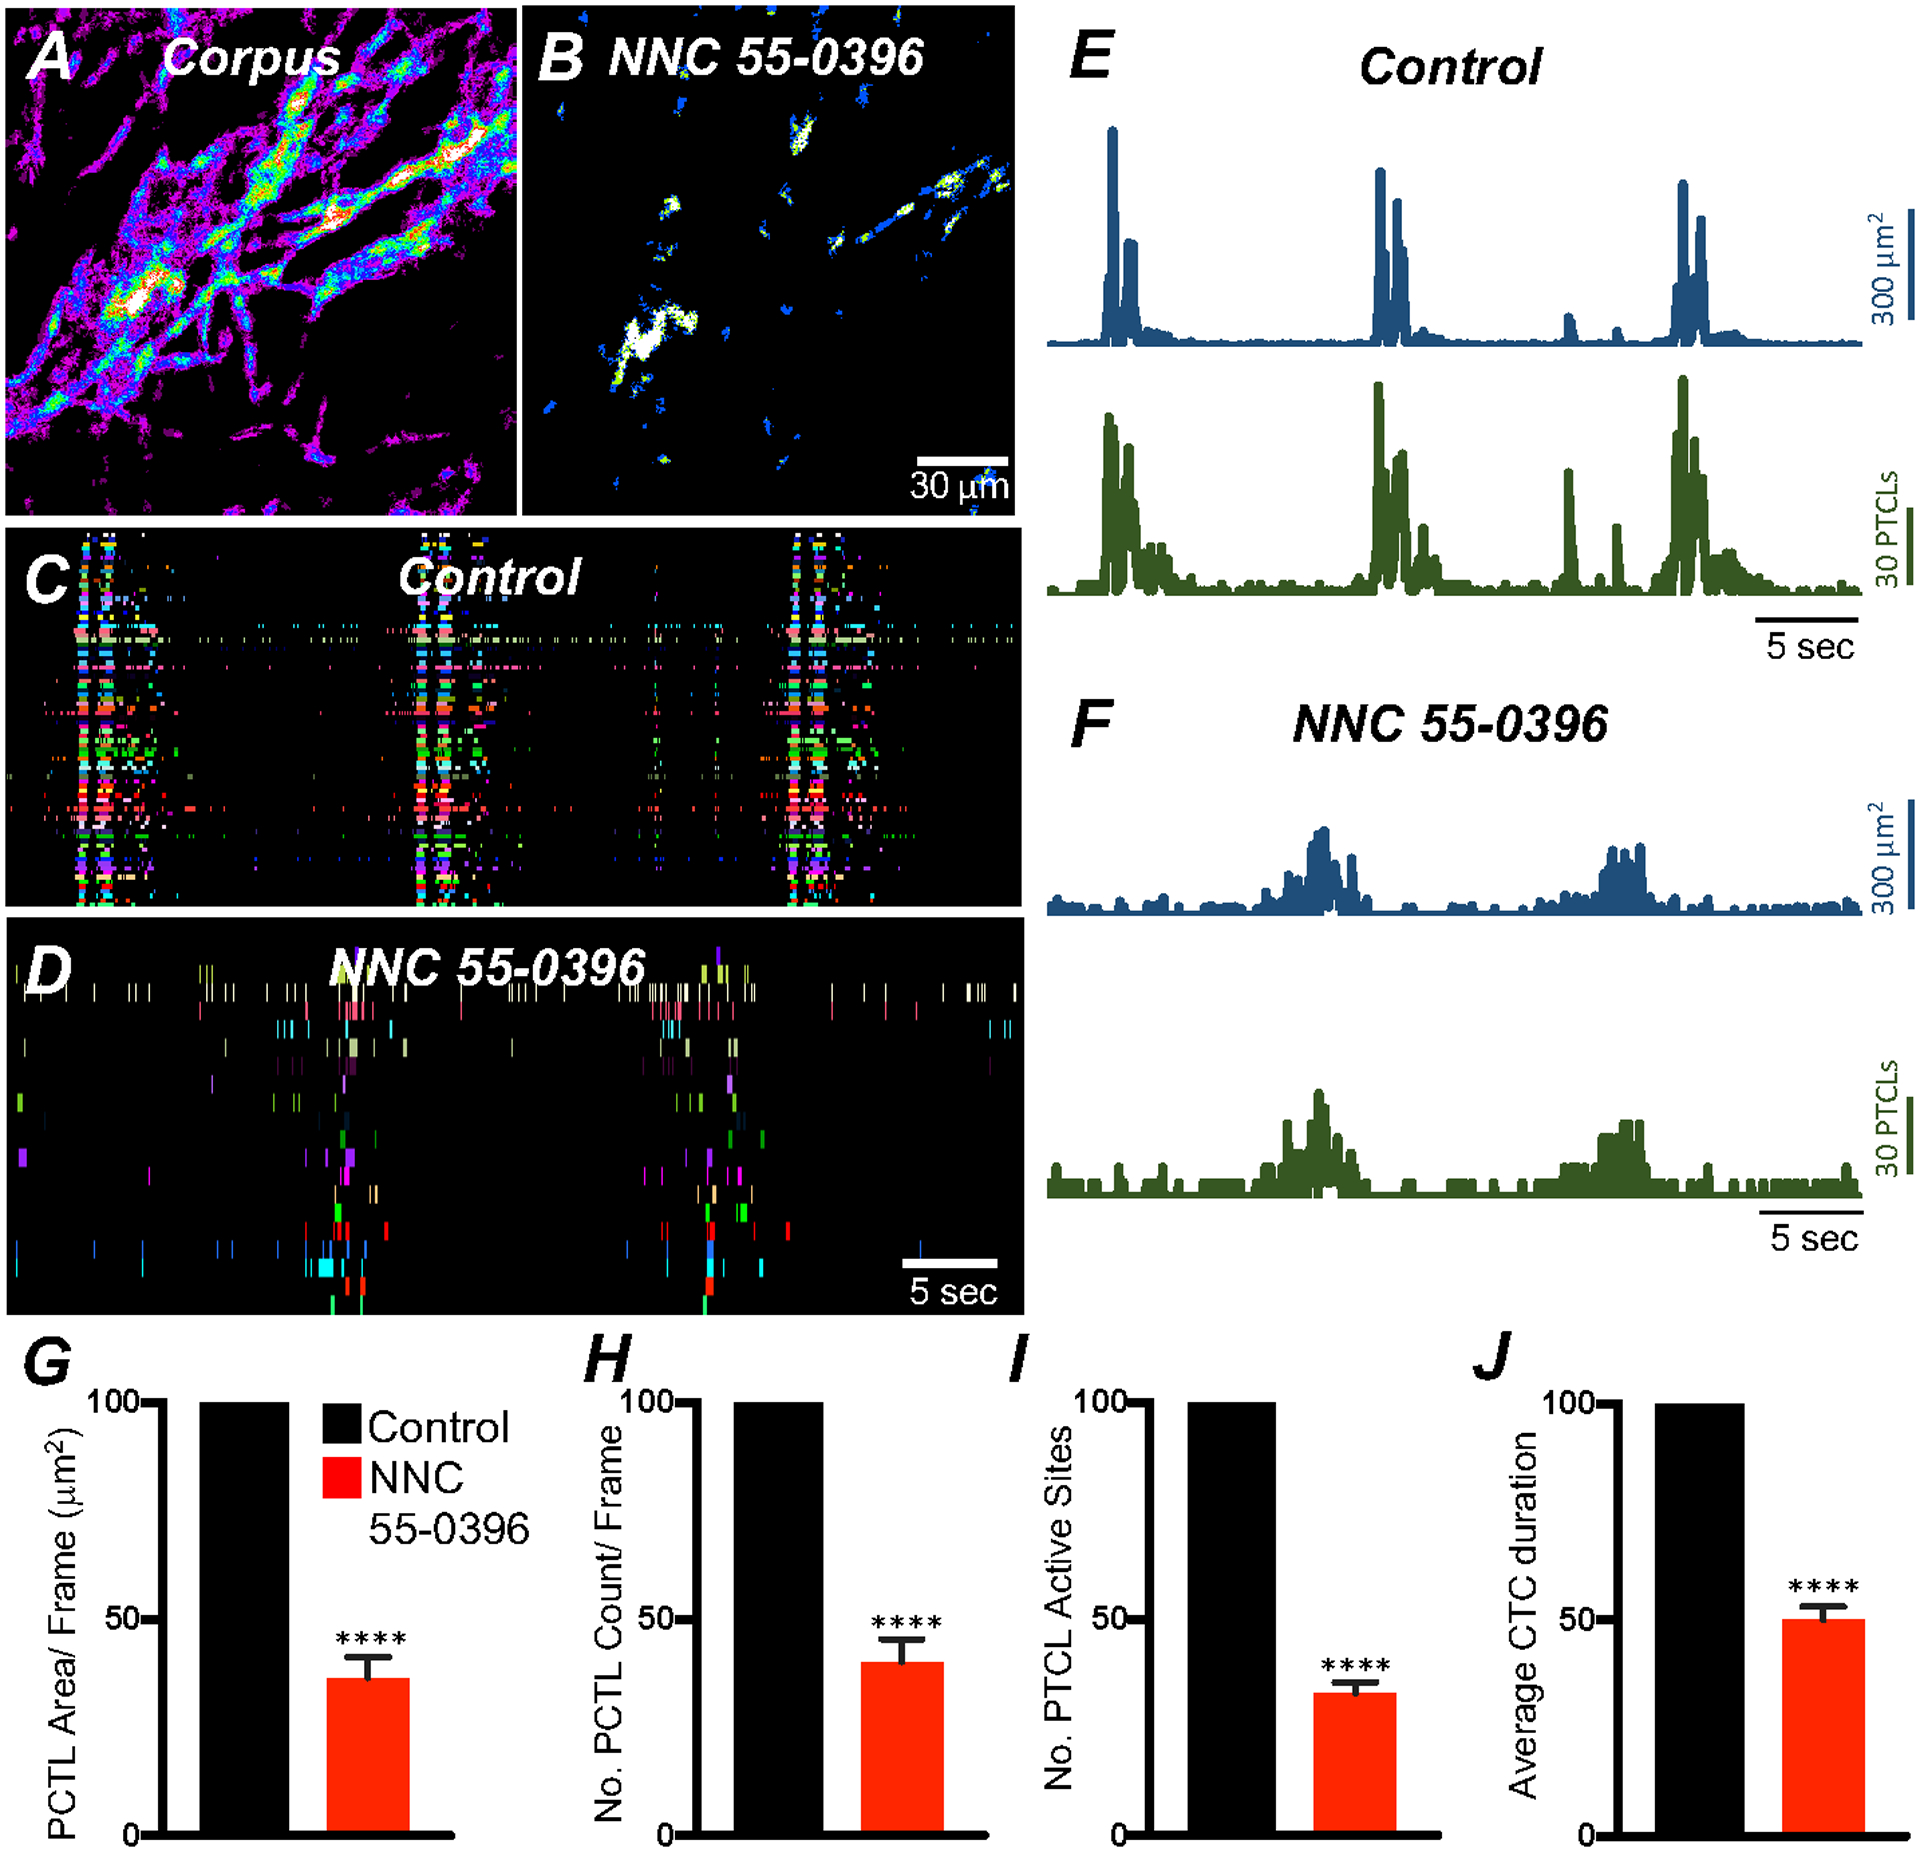
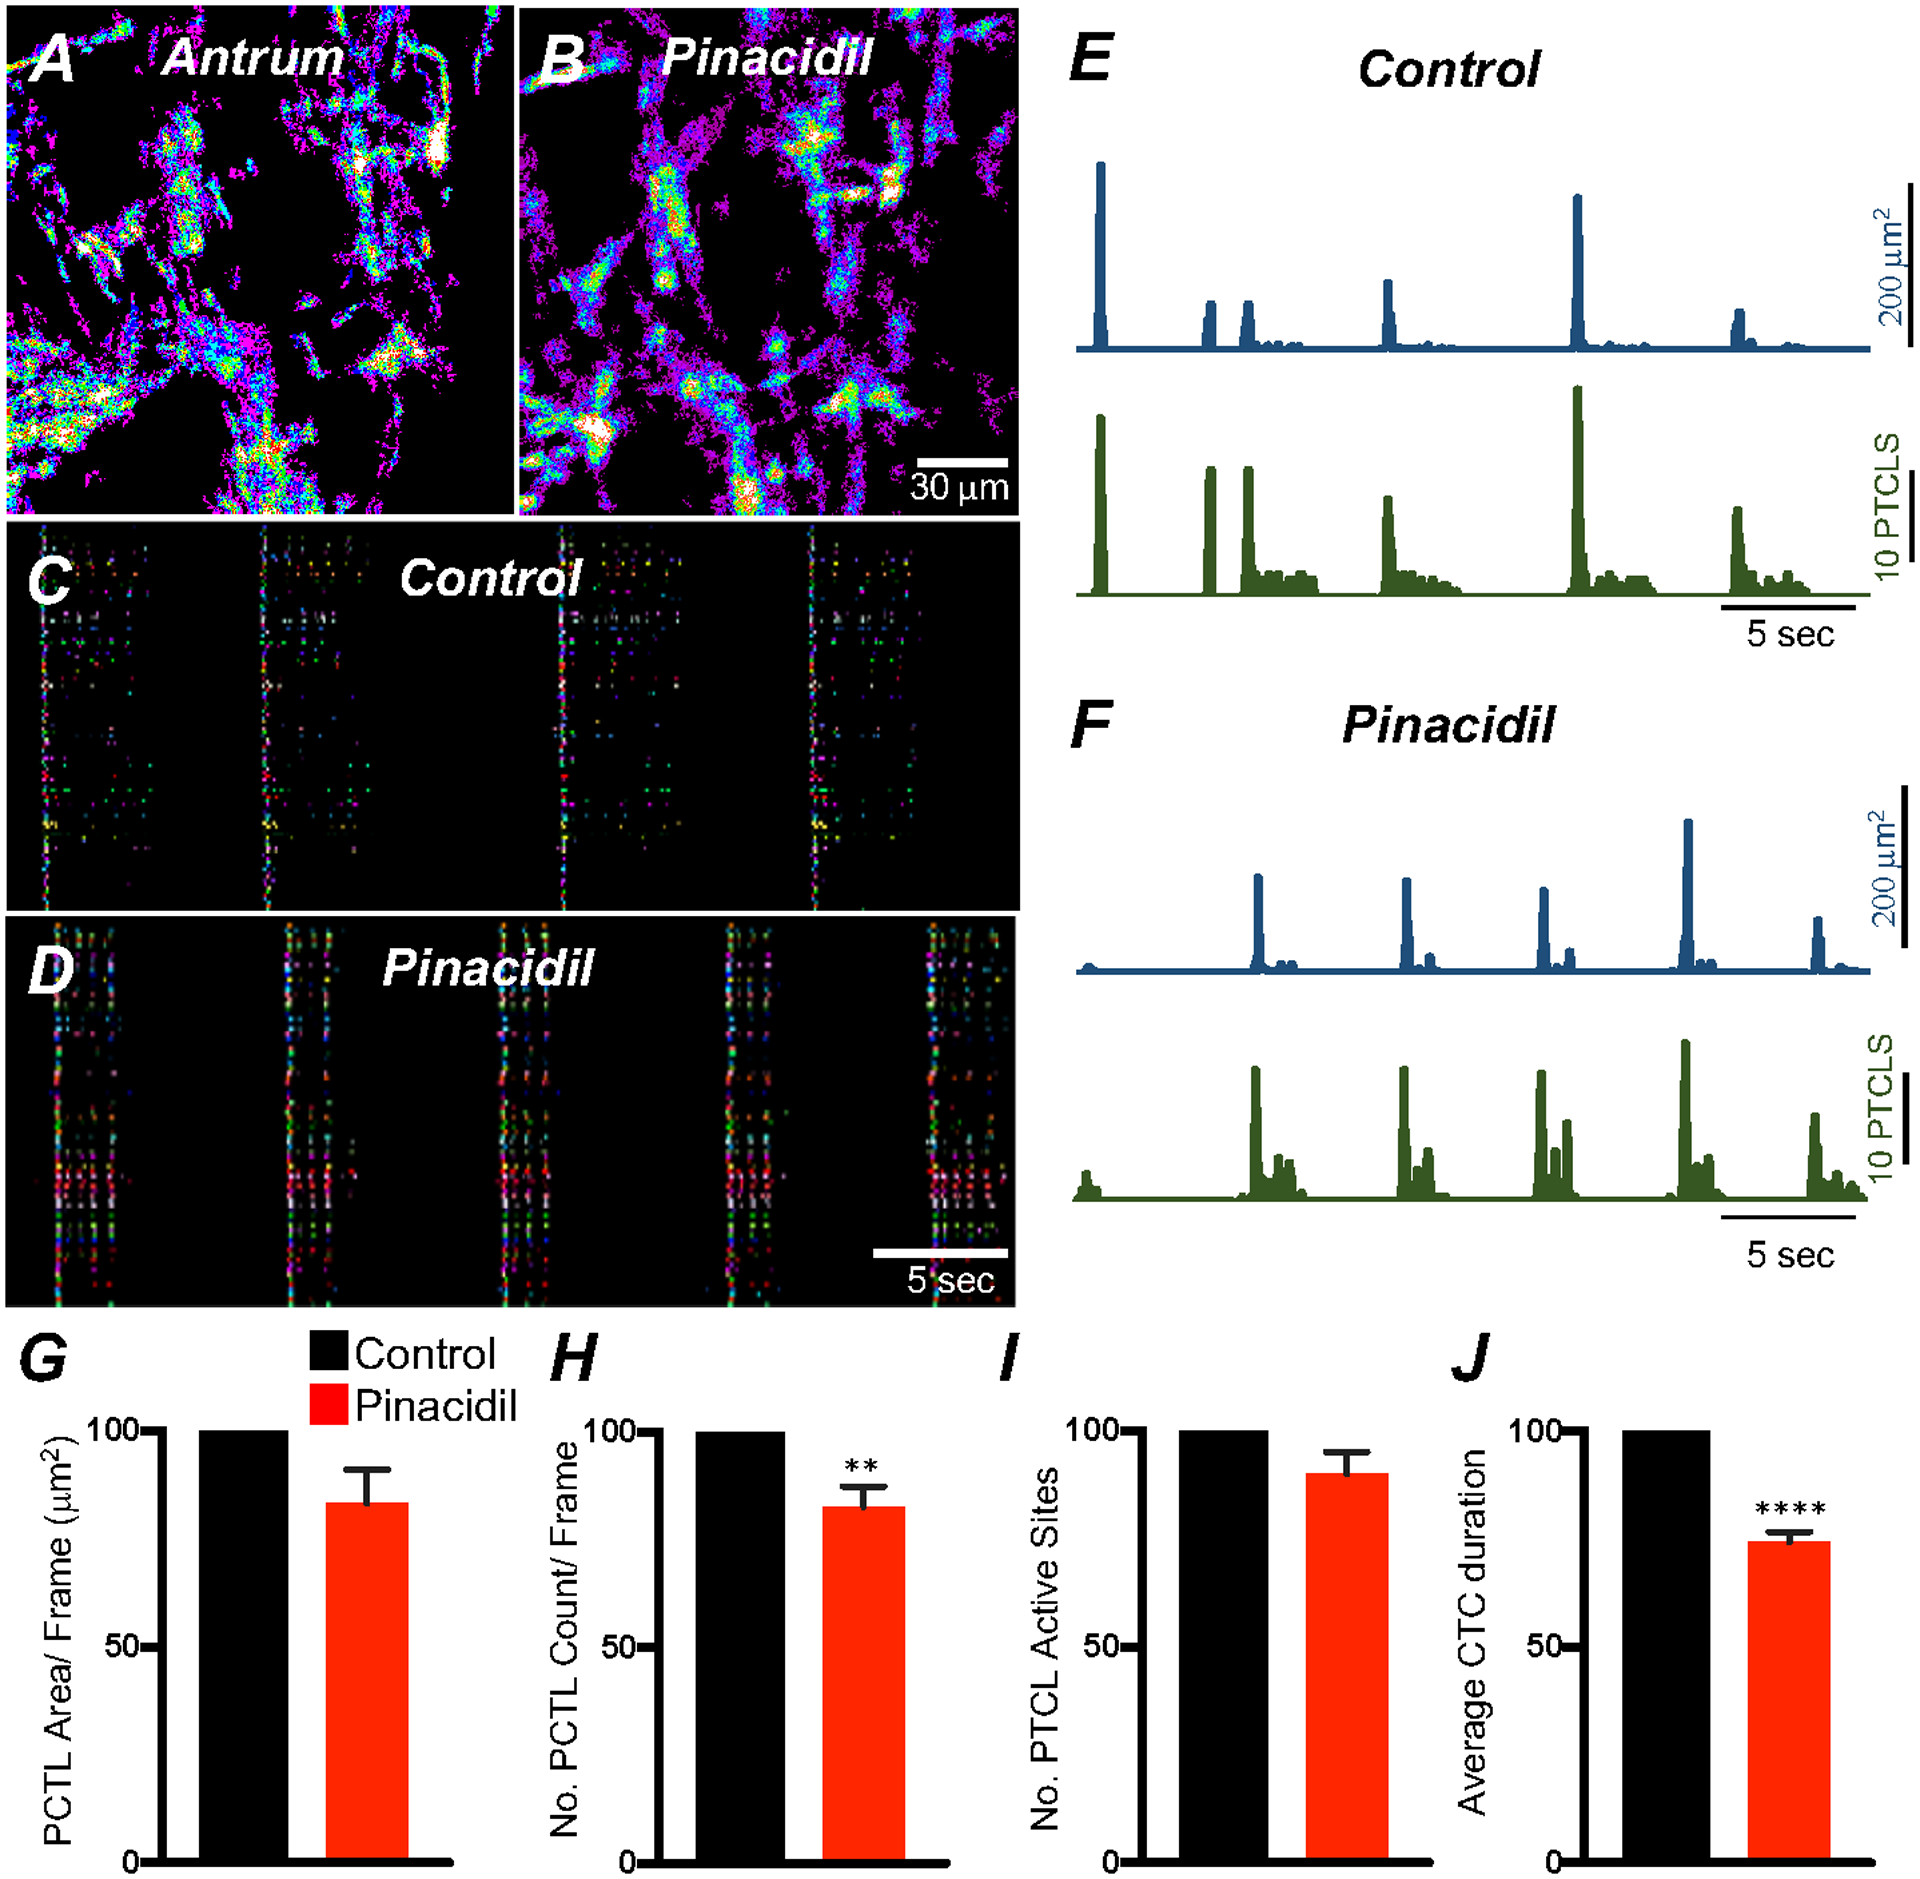
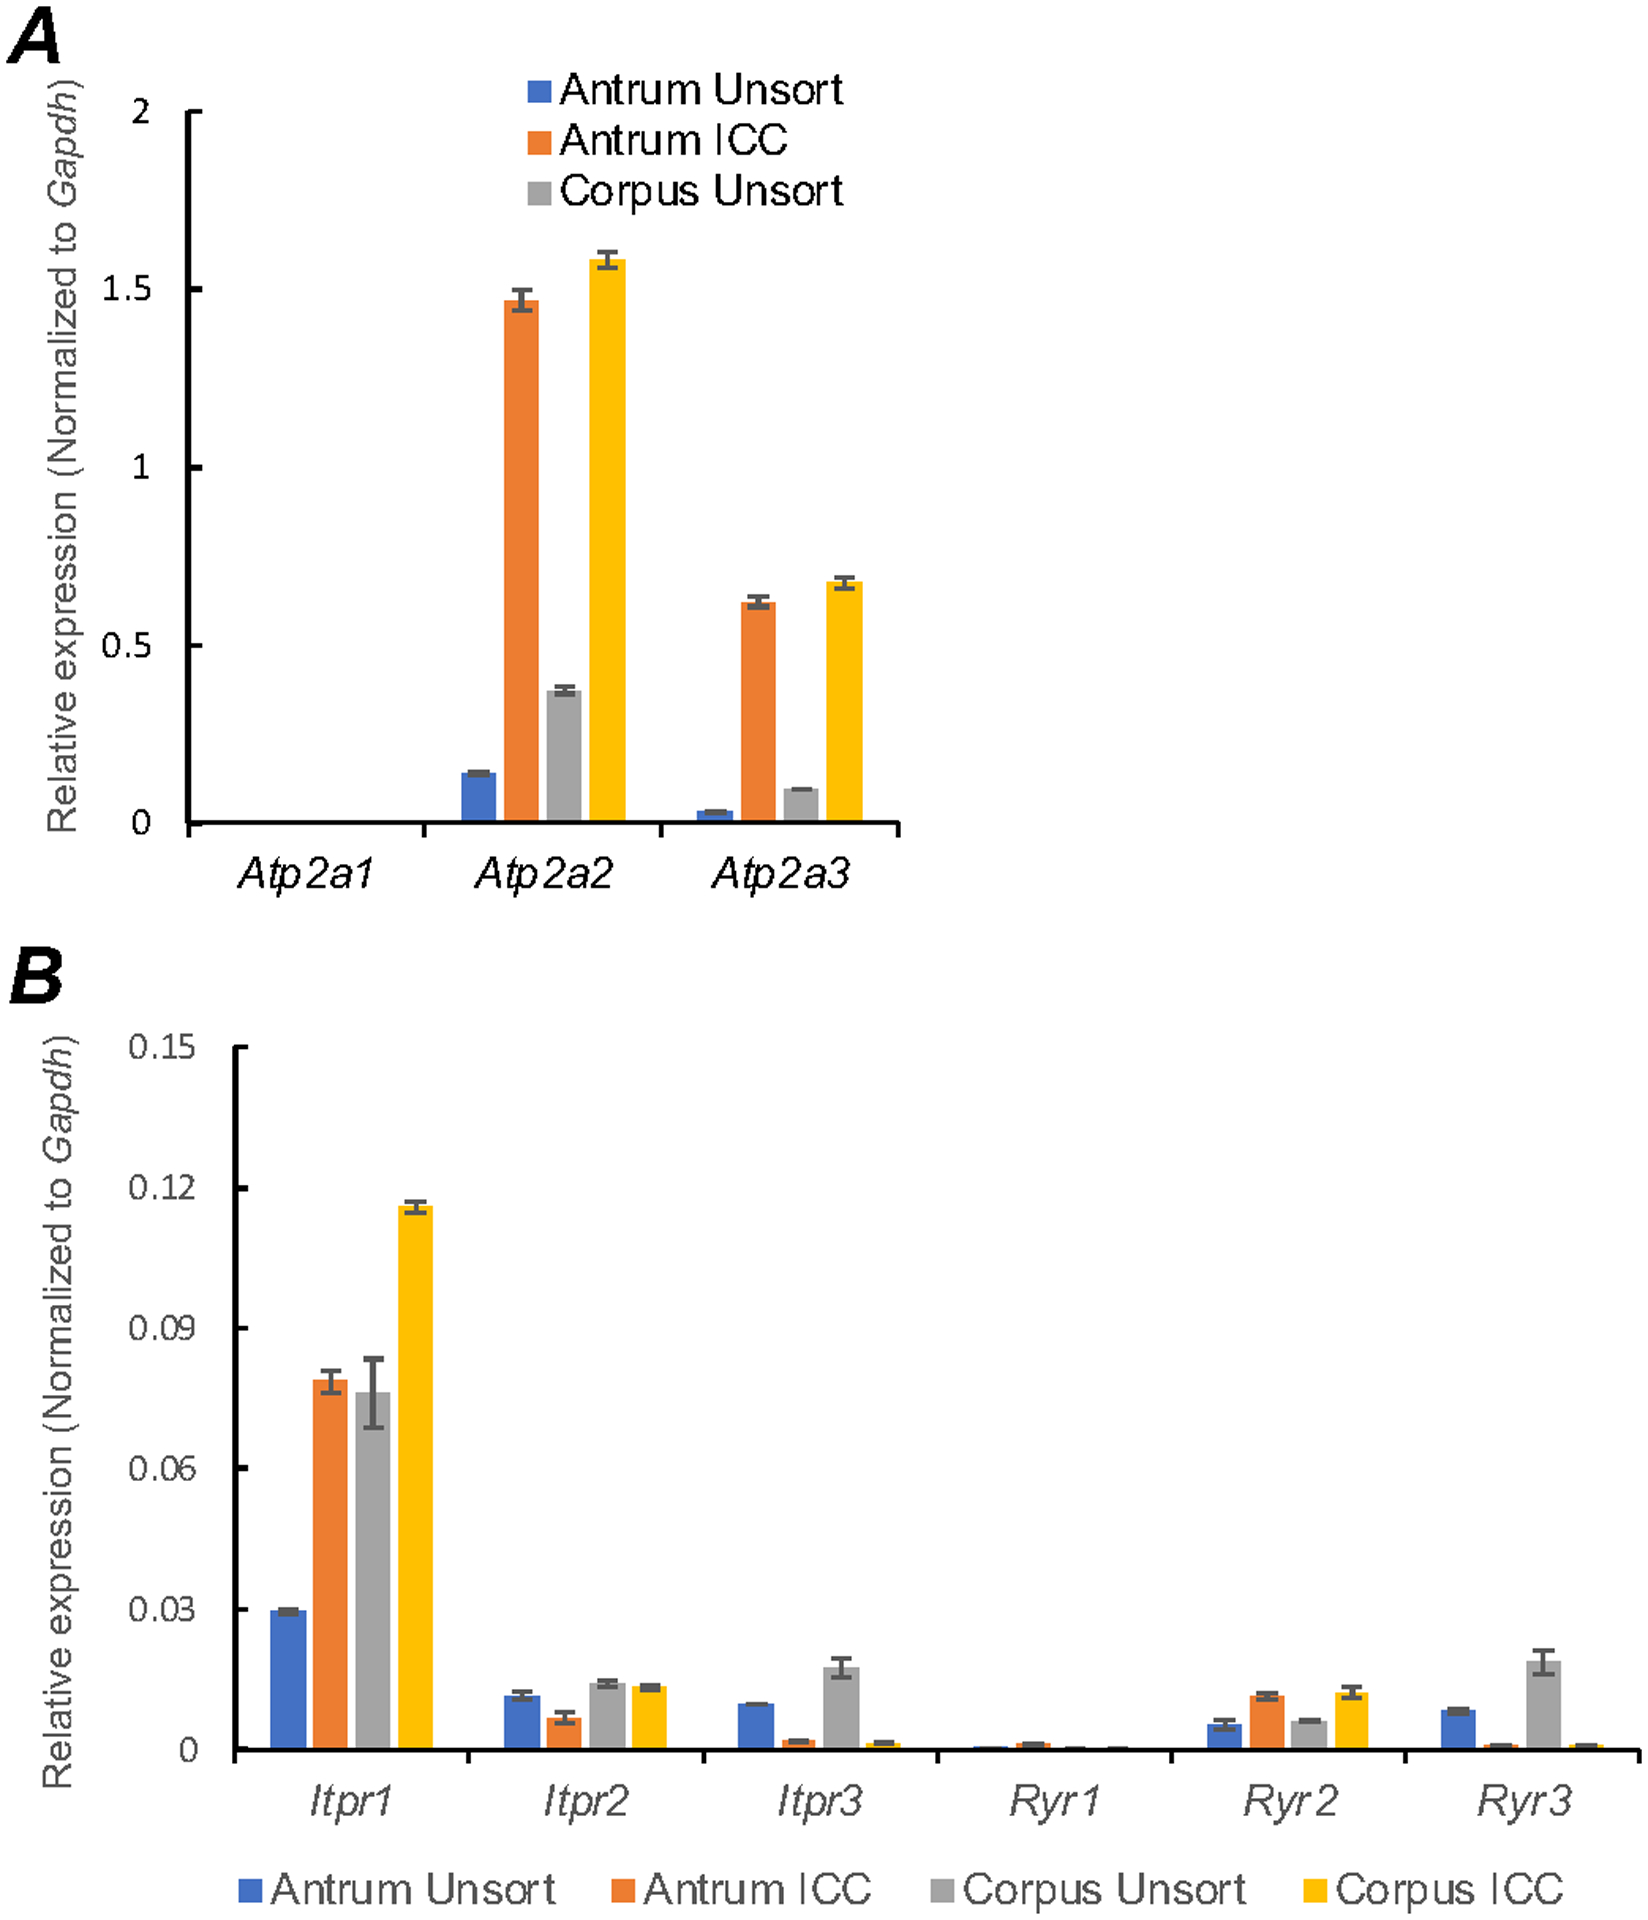
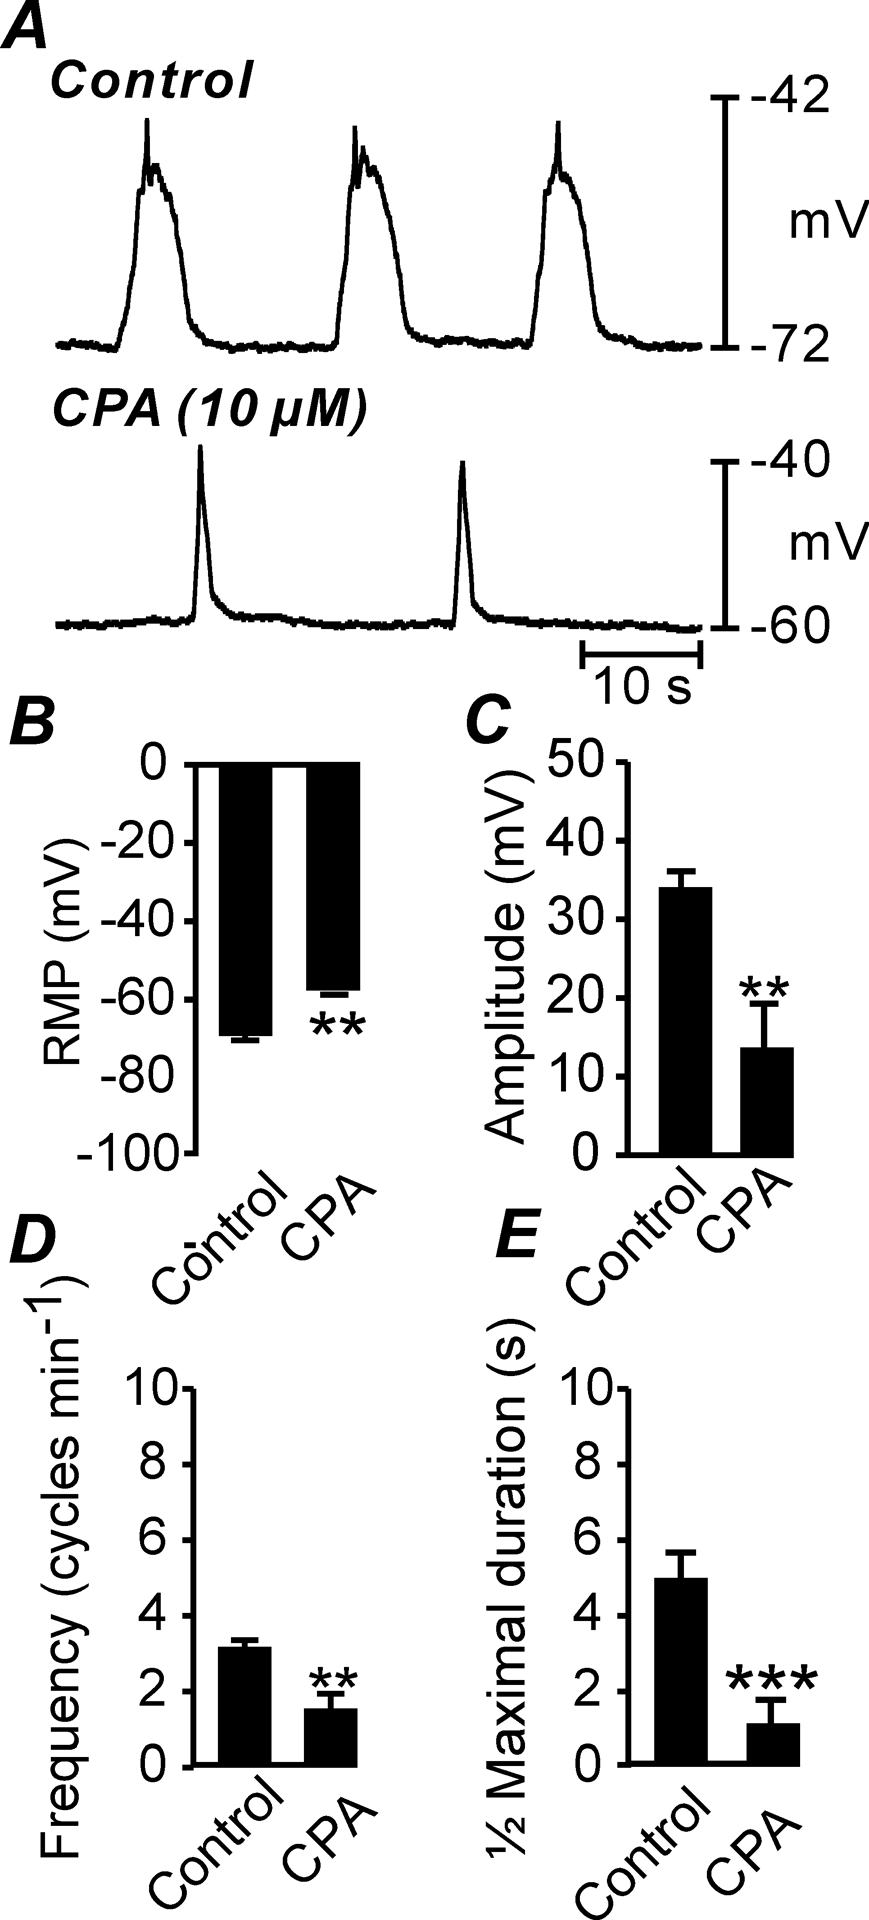
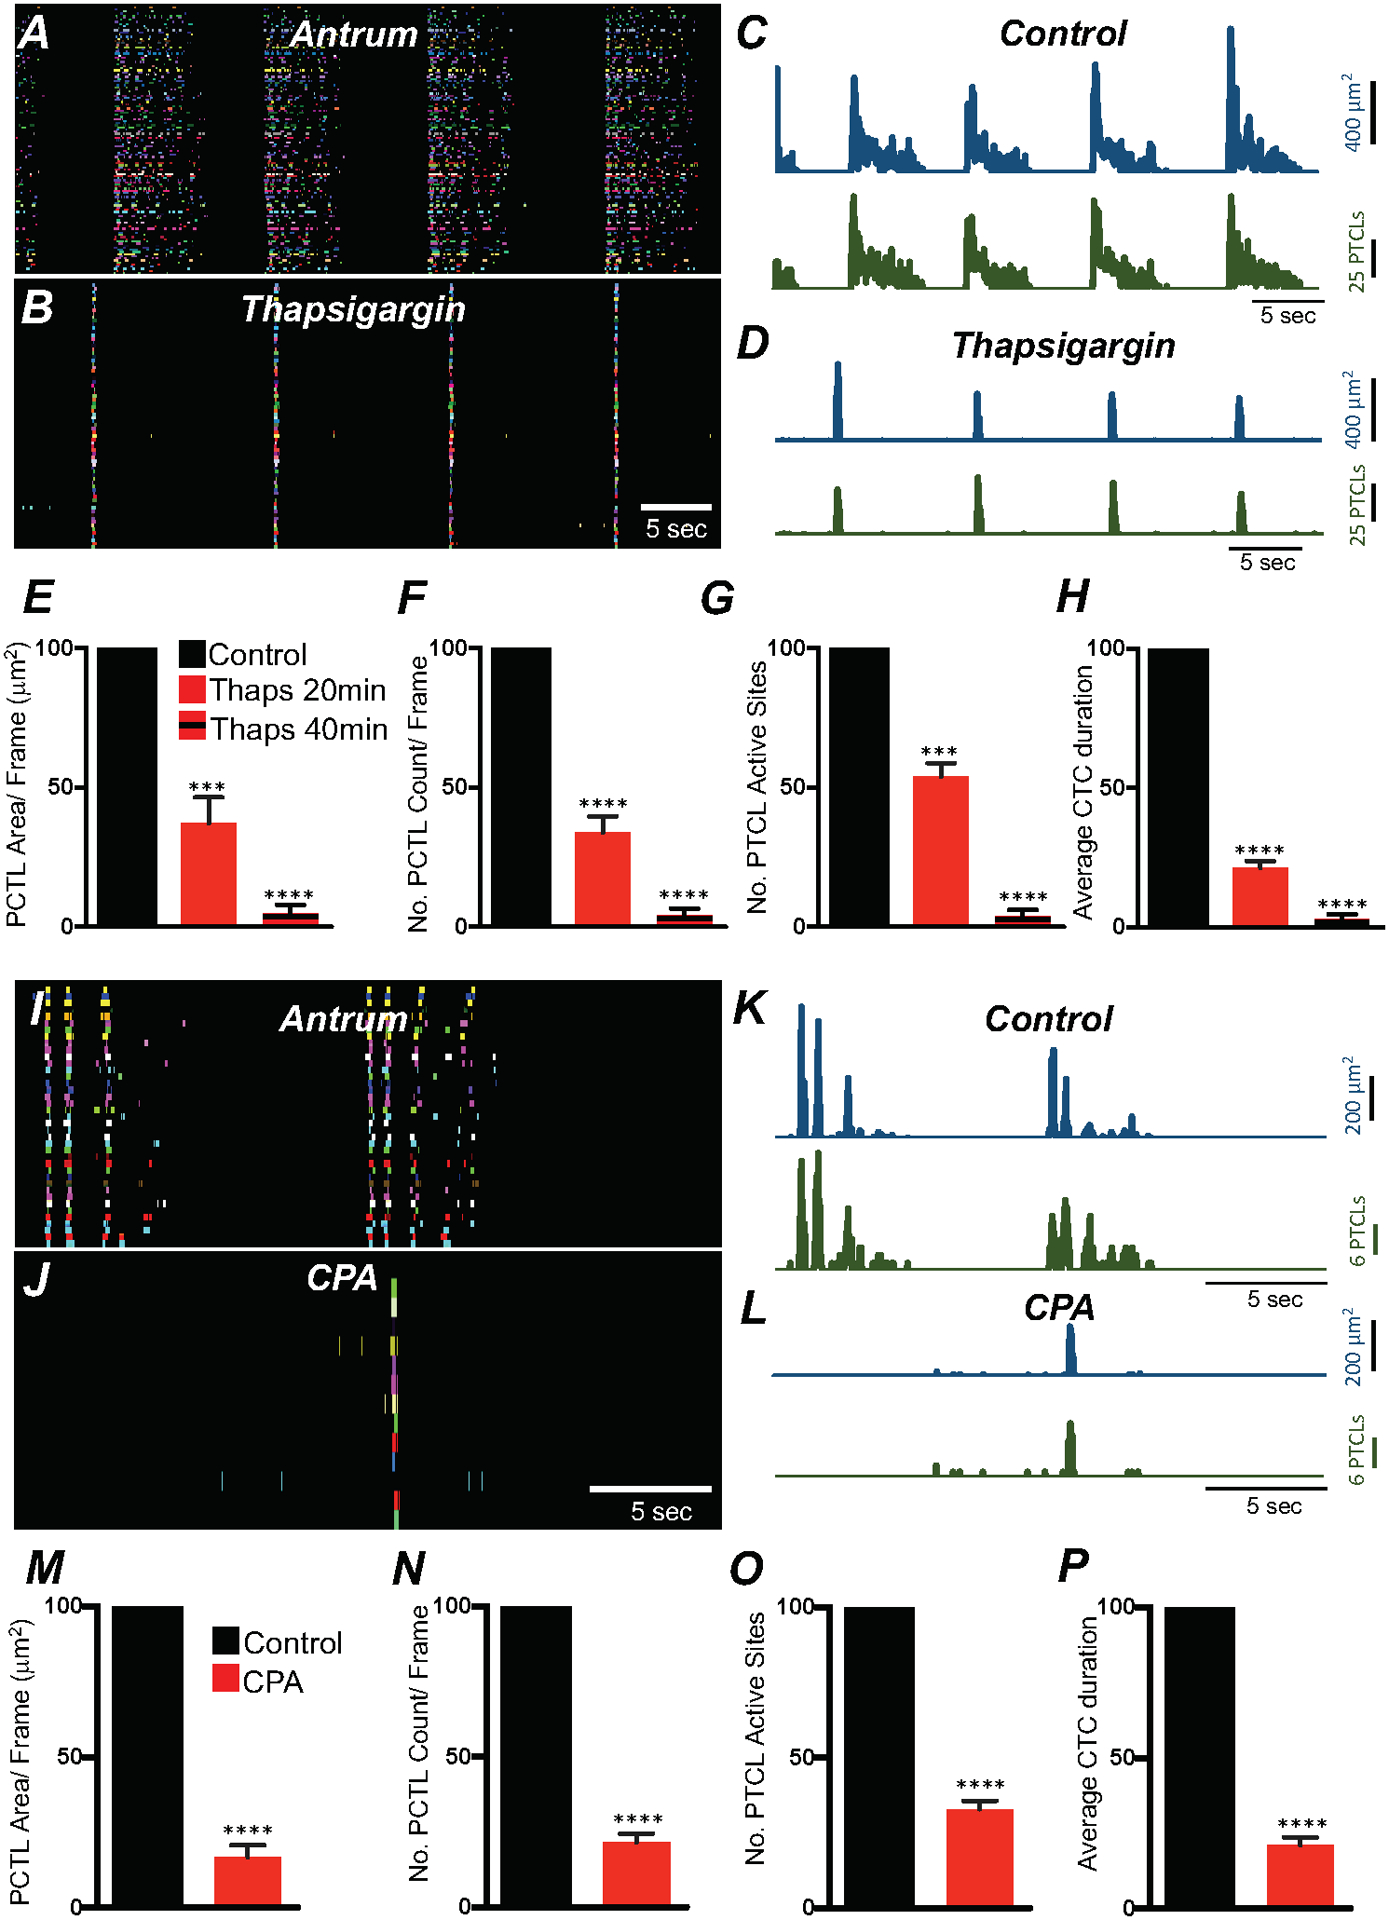
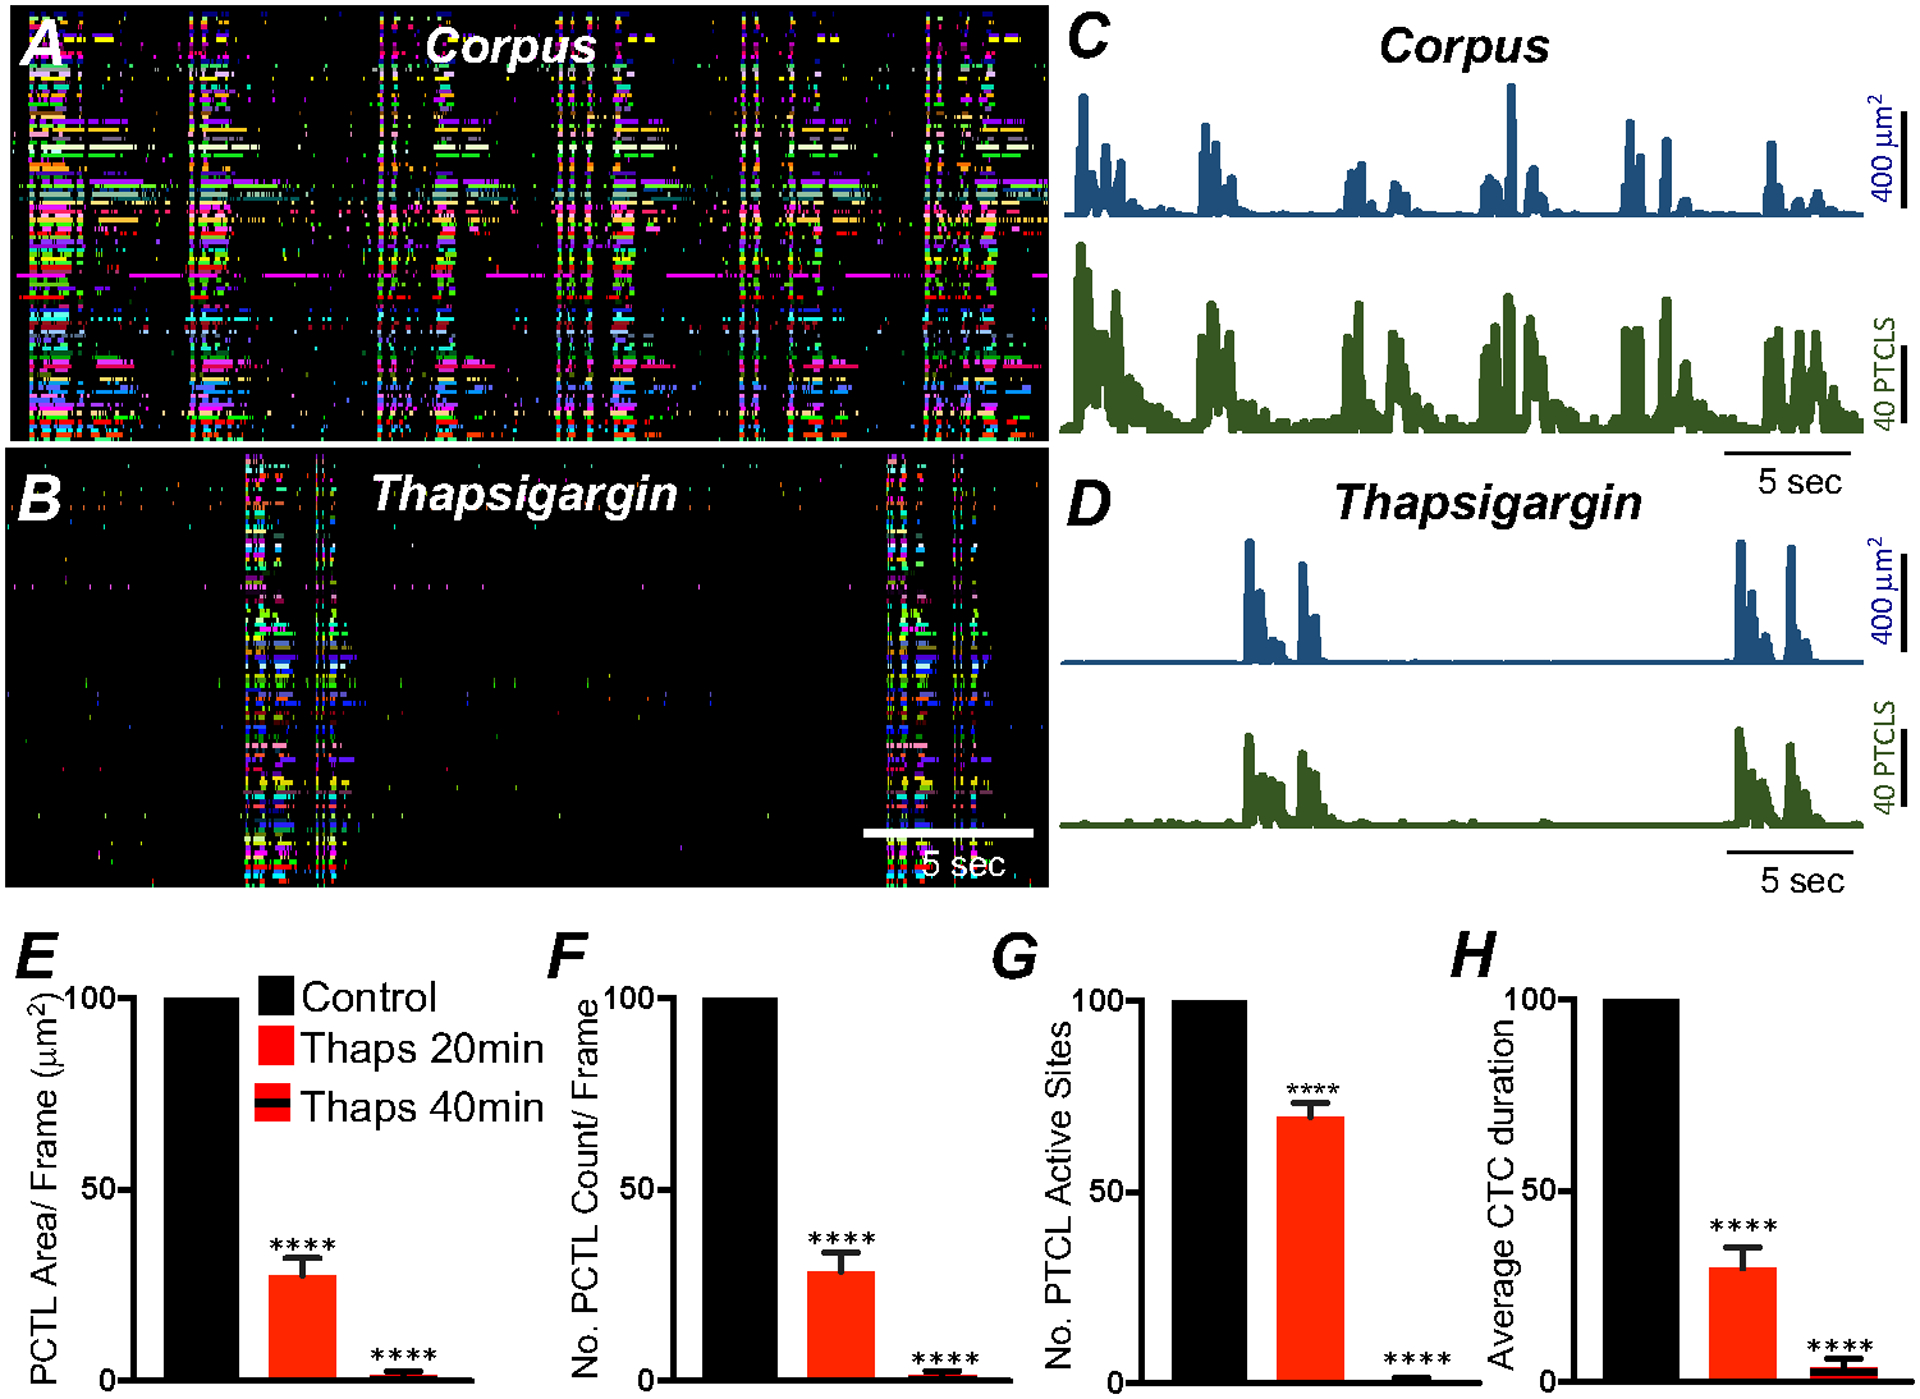
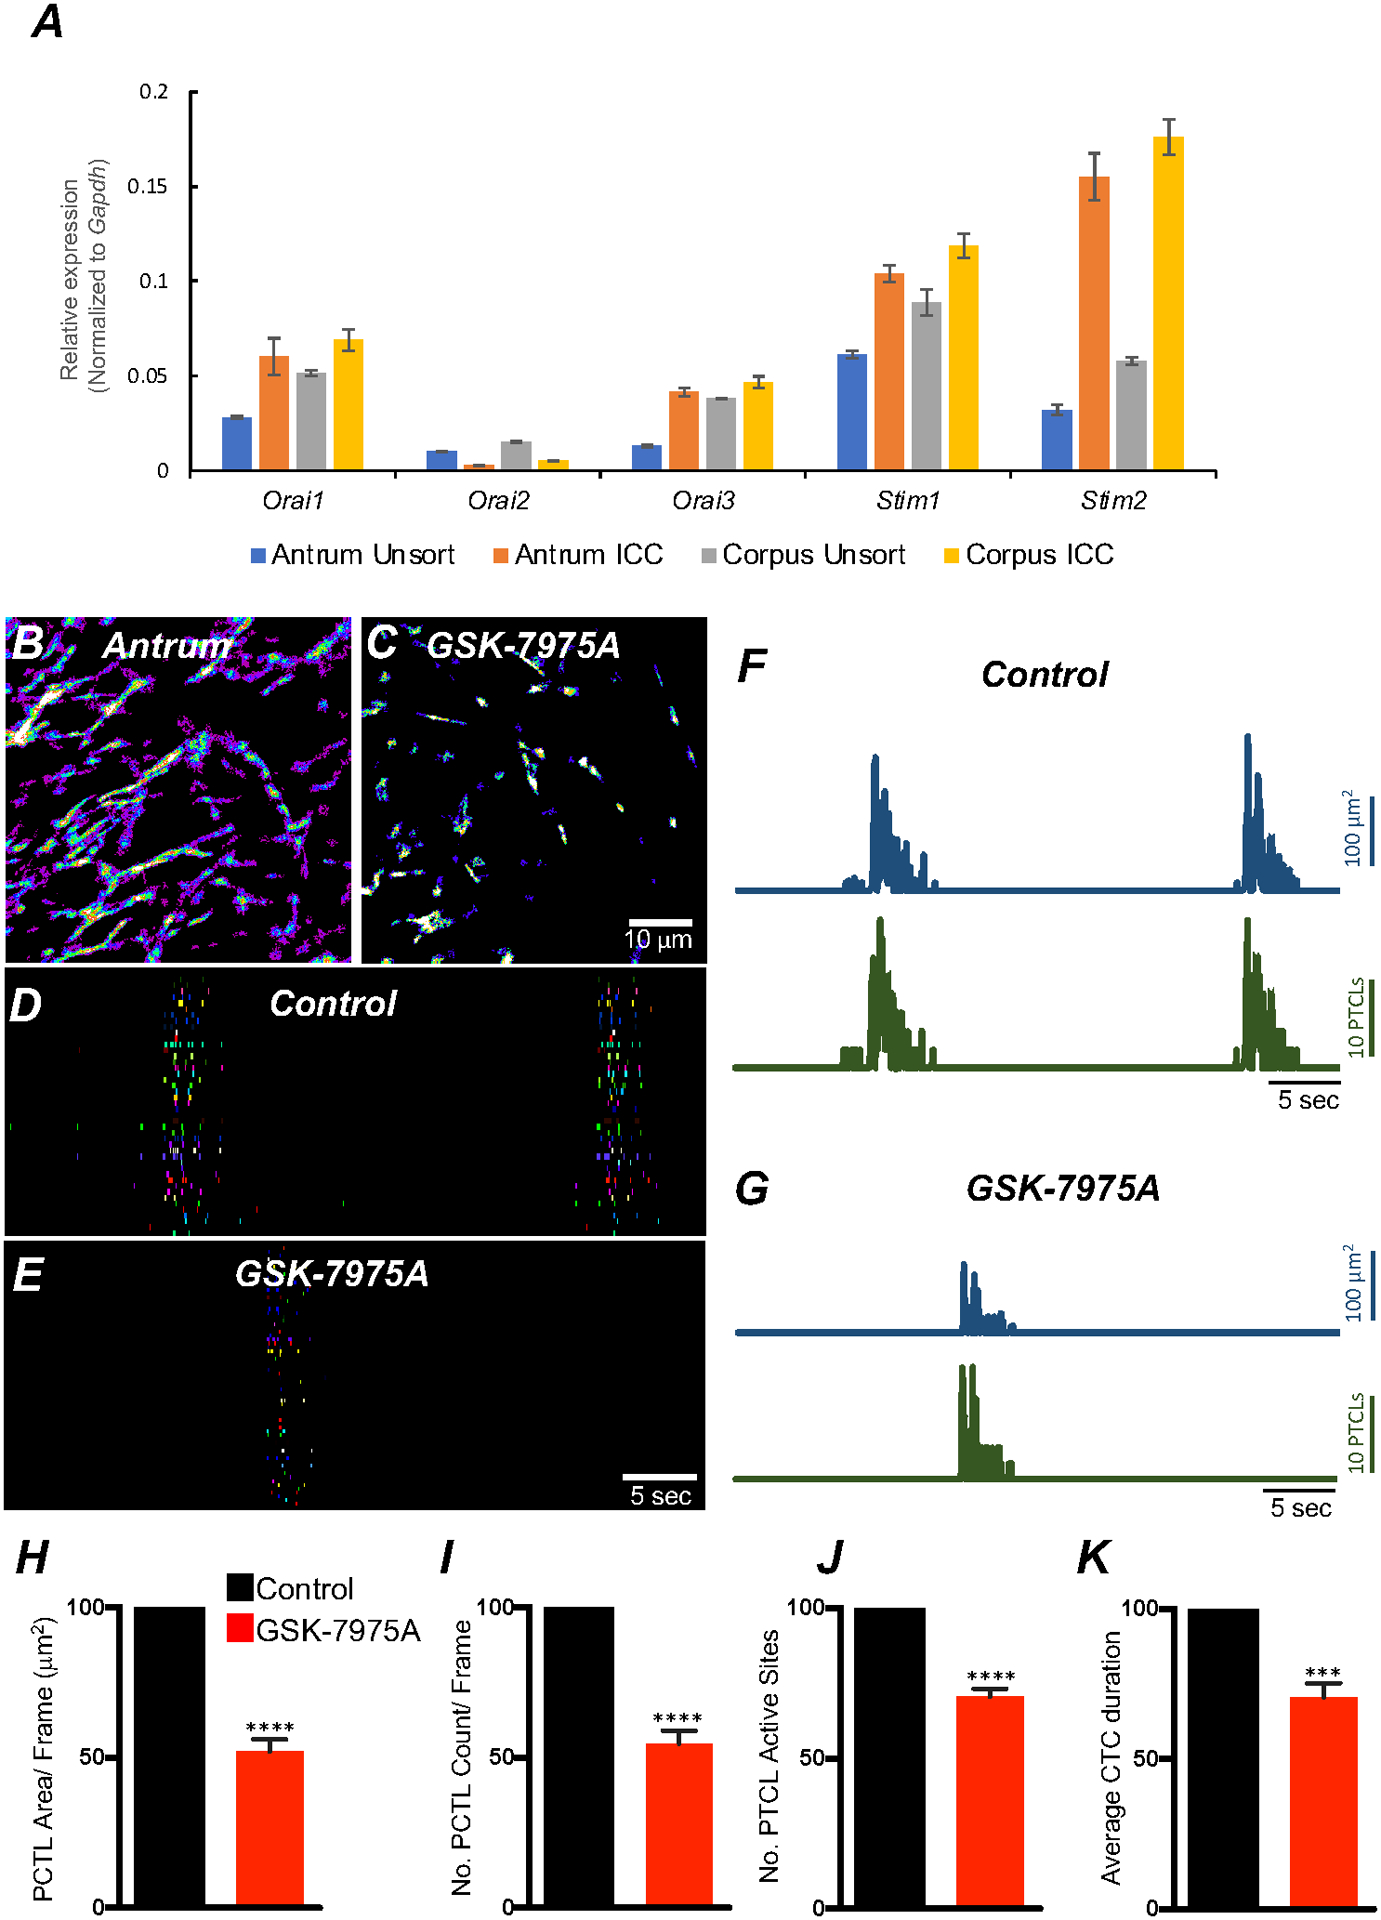
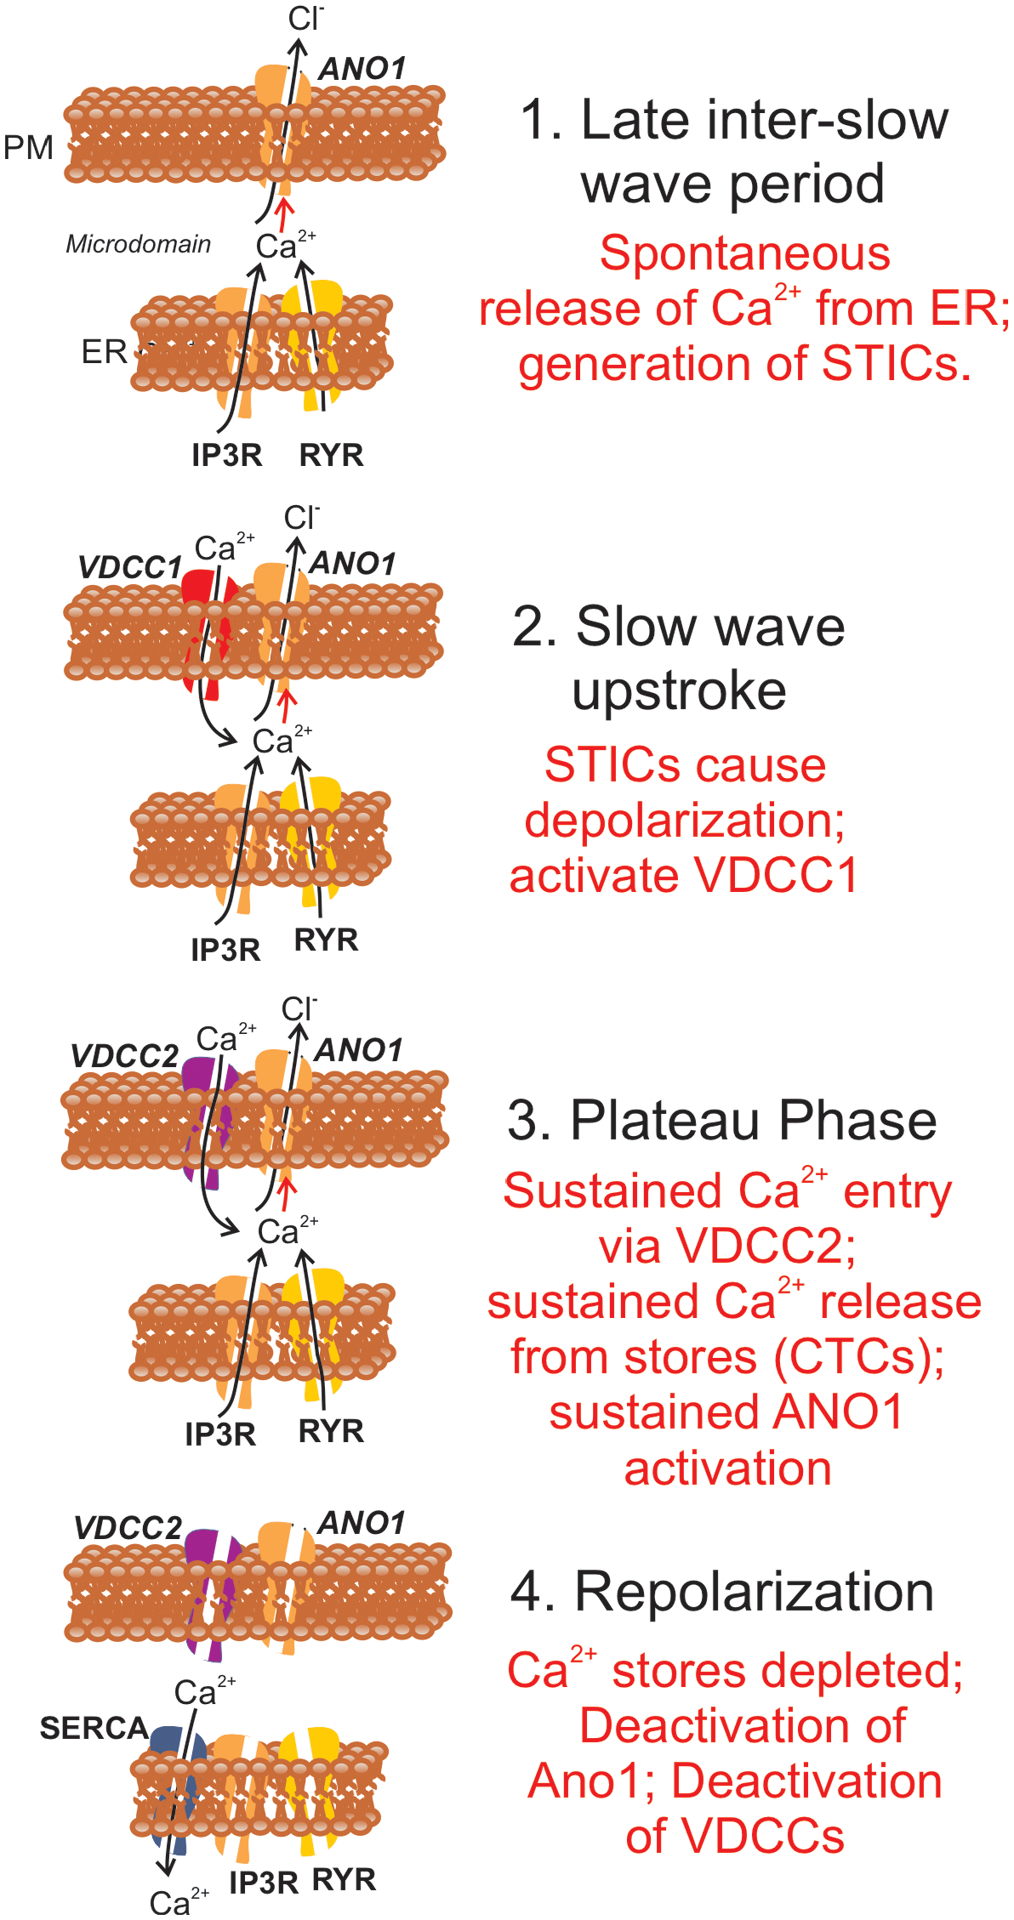
Myenteric interstitial cells of Cajal (ICC-MY) generate and actively propagate electrical slow waves in the stomach. Slow wave generation and propagation are altered in gastric motor disorders, such as gastroparesis, and the mechanism for the gradient in slow wave frequency that facilitates proximal to distal propagation of slow waves and normal gastric peristalsis is poorly understood. Slow waves depend upon Ca2+-activated Cl- channels (encoded by Ano1). We characterized Ca2+ signaling in ICC-MY in situ using mice engineered to have cell-specific expression of GCaMP6f in ICC. Ca2+ signaling differed in ICC-MY in corpus and antrum. Localized Ca2+ transients were generated from multiple firing sites and were organized into Ca2+ transient clusters (CTCs). Ca2+ transient refractory periods occurred upon cessation of CTCs, but a relatively higher frequency of Ca2+ transients persisted during the inter-CTC interval in corpus than in antrum ICC-MY. The onset of Ca2+ transients after the refractory period was associated with initiation of the next CTC. Thus, CTCs were initiated at higher frequencies in corpus than in antrum ICC-MY. Initiation and propagation of CTCs (and electrical slow waves) depends upon T-type Ca2+ channels, and durations of CTCs relied upon L-type Ca2+ channels. The durations of CTCs mirrored the durations of slow waves. CTCs and Ca2+ transients between CTCs resulted from release of Ca2+ from intracellular stores and were maintained, in part, by store-operated Ca2+ entry. Our data suggest that Ca2+ release and activation of Ano1 channels both initiate and contribute to the plateau phase of slow waves.

Keywords: Gastric motility; Interstitial cells; Pacemaker activity; Slow waves.


Conflict of interest statement

Declaration Competing Interest

Authors declare that they have no competing interests

Figures

Fig. 1.
Fig. 1.. Electrical and mechanical activities of gastric corpus and antrum.
A&B show simultaneous intracellular electrical and isometric force recordings from the gastric corpus. C&D show similar recordings of electrical and mechanical activity from the gastric antrum. The gastric corpus is more depolarized and slow waves are at a greater frequency than antrum. Corpus slow waves are also smaller in amplitude and do not produce as forceful contraction as antrum. E shows gastric corpus slow waves at a faster sweep speed. Corpus slow waves consisted of an initial slow depolarization with spontaneous transient depolarizations (STDs; *) followed by a sinusoidal wave that also had superimposed STDs. F shows gastric antrum slow waves at a faster sweep speed. Antrum slow waves consisted of an upstroke depolarization, partial repolarization, and a plateau phase that was sustained for several seconds before repolarization to a diastolic RMP. An inflection (arrows and inset) often separated the upstroke phase into two discrete components. GJ Summarized bar graphs illustrating the differences in RMP and electrical slow wave parameters between corpus and antrum. **** P < 0.0001. All data graphed as mean ± SEM. n = 11.
Fig. 2.
Fig. 2.. Effect of l-type Ca2+ channel inhibition on antrum slow waves.
A&B Electrical slow waves of the gastric antrum under control conditions (i.e. no drugs; A) and after the addition of nifedipine (1μM; B). Note the slight membrane depolarization and reduced ½ maximal duration. C Summarized data of changes in RMP Ca, slow wave amplitude Cb, ½ maximal duration of slow waves Cc and slow wave frequency Cd. Only RMP and ½ maximal duration of slow waves was significantly affected by nifedipine. All data graphed as mean ± SEM. n = 10, * P < 0.05; ** P < 0.01.
Fig. 3.
Fig. 3.. Differences in Ca2+ transients firing in ICC-MY between the corpus and antrum.
A Image of an ICC-MY network from gastric corpus of a Kit-GCaMP6 mouse at 60 × magnification. B Image showing individually color-coded Ca2+ firing sites in the FOV shown in A. C Plot of total Ca2+ transients PTCLs activity from all ICC-MY Ca2+ firing sites within the FOV in the corpus. D The temporal characteristics of each individual, color-coded firing site is displayed as an occurrence map, with each “lane” representing the occurrence of firing PTCLs within each firing site. Note that multiple corpus ICC-MY Ca2+ sites fires during the intra-wave period. E Representative image of an ICC-MY network from gastric Antrum at 60 × magnification. F Image showing individually color-coded Ca2+ firing sites in the FOV shown in E (see Supplemental Movie 1). G Total Ca2+ transients activity plot from all ICC-MY Ca2+ firing sites within the FOV in the antrum. H an occurrence map, with each “lane” representing the occurrence of firing PTCLs within each firing site. Note that limited number of Ca2+ sites firing during the intra-wave period in antrum ICC-MY. I Distribution plot showing averages of firing sites number during a Ca2+ wave in ICC-MY corpus and antrum. Values are calculated for 5 s and plotted in 297 ms bins (n = 10). J Summary graph show average number of PTCL Ca2+ firing sites in ICC-MY during the intra-wave period. K & L Summary graphs show average PTCL areas and counts for Ca2+ firing sites in ICC-MY. ** = P < 0.01, n = 6. All data graphed as mean ± SEM.
Fig. 4.
Fig. 4.. Effects of extracellular Ca2+ on ICC-MY Ca2+ transients.
A Colored heat-map image of total Ca2+ transients of antrum ICC-MY under control conditions with [Ca2+]o = 2.5 mM and B after Ca2+ removal from the extracellular solution ([Ca2+]o = 0 mM and 0.5 mM EGTA). Ca2+ activity is color-coded with warm areas (white, red) representing bright areas of Ca2+ fluorescence and cold colors (purple, black) representing dim areas of Ca2+ fluorescence. Scale bar is 50 mm in both A & B. C Ca2+ transients of firing sites in ICC-MY were color-coded and plotted as an occurrence map under control conditions with [Ca2+]o = 2.5 mM. D showing the effects of reducing [Ca2+]o to 0.5 mM Ca2+. E showing the effects of removal of [Ca2+]o (final solution contain 0 mM Ca2+ and buffered with 0.5 mM EGTA). FH Traces of Ca2+ PTCL activity in ICC-MY (PTCL area, blue and PTCL count, green) under control conditions F, in presence of 0.5 mM Ca2+ G and after removal of [Ca2+]o as shown in H. Summary graphs of Ca2+ PTCLs in ICC-MY under control conditions and with reduced [Ca2+]o to 1 mM, 0.5 mM and removal of [Ca2+]o is plotted in I (PTCL area); J (PTCL count) and K (CTC frequency). Data were normalized to controls and expressed as percentages (%). Significance was determined using one-way ANOVA, **** = P < 0.0001, n = 6. All data graphed as mean ± SEM.
Fig. 5.
Fig. 5.. Molecular expression of Ca2+ influx channels in ICC.
A Relative expression of cellular-specific biomarker genes in ICC (sorted to purity by FACS) and compared with unsorted cells dispersed from gastric antrum and corpus tissues obtained from Kit+/copGFP mice. Relative expression was determined by qPCR and normalized to Gapdh expression. Kit (tyrosine kinase receptor, found in ICC), Ano1 (Ca2+-activated Cl channel), Myh11 (smooth muscle myosin). PDGFRa (platelet-derived growth factor receptor α cell marker) and Uch11 (neural marker encoding PGP 9.5) B Relative expression of major voltage dependent Ca2+ entry channels, l-Type Ca2+ channels (Cacna1c and Cacna1d) and T-type Ca2+ channels (Cacna1g, Cacna1h and Cacna1i). C Relative expression of the Na+/Ca2+ exchanger (NCX) isoforms (Slc8a1, Slc8a2 and Slc8a3) in gastric antrum and corpus ICC. All data graphed as mean ± SEM (n = 4).
Fig. 6.
Fig. 6.. L-type Ca2+ channel antagonist, isradipine effects on ICC-MY Ca2+ transients.
A&B Representative heat-map images of an antrum ICC-MY network showing active Ca2+ PTCLs under control conditions and in the presence of isradipine (1mM). Ca2+ activity is color-coded with warm areas (white, red) representing bright areas of Ca2+ fluorescence and cold colors (purple, black) representing dim areas of Ca2+ fluorescence. Scale bar is 50 mm in both A & B. C & D Ca2+ activity in ICC-MY showing color-coded Firing sites plotted as an occurrence map under control conditions C and in the presence of isradipine (1mM) D. Traces of firing sites showing PTCL area (E; blue) and PTCL count (E; green) under control conditions and in the presence of isradipine; PTCL area (F; blue) and PTCL count (F; green). Summary graphs of Ca2+ PTCL activity in ICC-MY before and in the presence of isradipine are shown in G (PTCL area/frame), H (PTCL count/frame), I the number of PTCL active sites. J Summary graph of Ca2+ transient clusters (CTCs) duration. Data were normalized to controls and expressed as percentages (%). Significance determined using unpaired t-test, ** = P < 0.01, *** = P < 0.001, n = 6. All data graphed as mean ± SEM.
Fig. 7.
Fig. 7.. Effects of T-type Ca2+ channel antagonist, NNC 55–0396 on antrum ICC-MY Ca2+ transients.
A&B Ca2+ transient particles heat-map images in ICC-MY under control conditions A and in the presence of NNC 55–0396 (10 μM) B. Active firing sites were color-coded and plotted as an occurrence maps in the ICC-MY network under control C and in the presence of NNC 55–0396 D. Trace plots of Ca2+ transient PTCLs activity of ICC-MY in control conditions showing PTCL area (blue) and PTCL count (green) E and in the presence of NNC 55–0396 F. Summary graphs of average percentage changes in PTCL area G, PTCL count H, the number of PTCL active sites I. J Average percentage changes of Ca2+ transient clusters (CTCs) duration. Data were normalized to controls and expressed as percentages (%). Significance determined using unpaired t-test, *** = P < 0.001, **** = P < 0.0001, n = 6. All data graphed as mean ± SEM.
Fig. 8.
Fig. 8.. Effects of T-type Ca2+ channel antagonist, NNC 55–0396 on corpus ICC-MY Ca2+ transients.
A&B Ca2+ transient particles heat-map images in ICC-MY under control conditions A and in the presence of NNC 55–0396 (10 μM) B. Ca2+ activity is color-coded with warm areas (white, red) representing bright areas of Ca2+ fluorescence and cold colors (purple, black) representing dim areas of Ca2+ fluorescence. Scale bar is 30 mm in both A & B. Active firing sites were color-coded and plotted as an occurrence maps in the ICC-MY network under control C and in the presence of NNC 55–0396 D. Trace plots of Ca2+ transient PTCL activity of ICC-MY in control conditions showing PTCL area (blue) and PTCL count (green) E and in the presence of NNC 55–0396 F. Summary graphs of average percentage changes in Ca2+ PTCL area G, PTCL count H, the number of PTCL active sites I. J Average percentage changes of Ca2+ transient clusters (CTCs) duration. Data were normalized to controls and expressed as percentages (%). Significance determined using unpaired t-test, **** = P < 0.0001, n = 5. All data graphed as mean ± SEM.
Fig. 9.
Fig. 9.. membrane hyperpolarization effects on ICC-MY Ca2+ transients.
A Ca2+ Firing sites in ICC-MY are color-coded and plotted in a heat map under control conditions and in the presence of pinacidil (10 μM) B. Occurrence maps showing active firing sites under control conditions C and in the presence of pinacidil D. Trace activity of firing sites PTCL area (blue) and PTCL count (green) under each condition are shown in E&F. Summary graphs of Ca2+ PTCL activity in ICC-MY in the presence of v pinacidil are shown in G (PTCL area) and H (PTCL count). I The number of active Ca2+ PTCL and total Ca2+ transient cluster (CTC) duration in J. Data were normalized to controls and expressed as percentages (%). Significance determined using unpaired t-test, ** = P < 0.01, **** = P < 0.0001, n = 5. All data graphed as mean ± SEM.
Fig. 10.
Fig. 10.. Molecular expression of SERCA, RyR and InsP3R transcripts.
A Relative expression of the SERCA pump isoforms (Atp2a1, Atp2a2 and Atp2a3) in gastric ICC and compared with unsorted cells dispersed from gastric antrum and corpus tissues obtained from Kit+/copGFP mice. B Relative expression of ER Ca2+ channels (RyR and InsP3R) in antrum and corpus ICC. InsP3Rs encoded by (Iptr1, Iptr2 and Iptr3) and RyRs isoforms (Ryr1, Ryr2 and Ryr3). Expression was determined by qPCR and the relative expression of each gene was normalized to the house-keeping gene, Gapdh. All data graphed as mean ± SEM (n = 4).
Fig. 11.
Fig. 11.. Effect of cyclopiazonic acid on gastric antrum slow waves.
A Slow waves recorded under control conditions (in the presence of nifedipine (1μM) and after the addition of cyclopiazonic acid (CPA; 10 μM). BE Summarized data of the effects of CPA (10 μM) on RMP (B), slow wave amplitude (C), slow wave frequency (D) and ½ maximal duration (E). ** P = <0.01; *** P = <0.001.
Fig. 12.
Fig. 12.. Ca2+ stores contributions to Ca2+ transients in antrum ICC-MY.
A ICC-MY Ca2+ firing site activity in antrum ICC-MY are color-coded and plotted in occurrence maps under control conditions and in the presence of thapsigargin (1 μM) B. Plot traces of firing sites PTCL area (C; blue) and PTCL count (C; green) under control conditions and in the presence of thapsigargin PTCL area (D; blue) and PTCL count (D; green). Summary graphs of Ca2+ PTCL activity in ICC-MY in the presence of thapsigargin after 20 min and 40 min incubation periods are shown in E (PTCL area), F (PTCL count), G the number of PTCL active sites and H Average percentage changes of Ca2+ transient clusters (CTCs) duration (n = 6). CPA (SERCA pump inhibitor; 10 μM) reduced transients compared to control as shown in occurrence maps of firing sites I&J and Ca2+ activity traces K&L. Summary graphs of Ca2+ PTCL activity in ICC-MY in the presence of CPA are shown in M (PTCL area), N (PTCL count), O the number of PTCL active sites. P Total CTC duration (n = 5). Data were normalized to controls and expressed as percentages (%). Significance determined using unpaired t-test, **** = P < 0.0001. All data graphed as mean ± SEM.
Fig. 13.
Fig. 13.. Ca2+ stores contributions to Ca2+ transients in corpus ICC-MY.
A ICC-MY Ca2+ firing site activity are color-coded and plotted in occurrence maps under control conditions and in the presence of thapsigargin (1 μM) B. Plot traces of firing sites PTCL area (C; blue) and PTCL count (C; green) under control conditions and in the presence of thapsigargin PTCL area (D; blue) and PTCL count (D; green). Summary graphs of Ca2+ PTCL activity in ICC-MY in the presence of thapsigargin after 20 min and 40 min incubation periods are shown in E (PTCL area), F (PTCL count), G the number of PTCL active sites and H Average percentage changes of Ca2+ transient clusters (CTCs) duration (n = 5). Data were normalized to controls and expressed as percentages (%). Significance determined using unpaired t-test, **** = P < 0.0001. All data graphed as mean ± SEM.
Fig. 14.
Fig. 14.. Role of SOCE in maintaining ICC-MY Ca2+ transients.
A Relative expression of store-operated Ca2+ entry (SOCE) channels (Orai1, Orai2 and Orai3) and stromal interaction molecules STIM1 and STIM2 in gastric ICC and compared with unsorted cells dispersed from gastric antrum and corpus tissues obtained from Kit+/copGFP mice. B Heat-map images of an antrum ICC-MY networks showing total active Ca2+ PTCLs under control conditions and in the presence of GSK-7975A (C, 10 μM, for 20 min). D & E occurrence maps of color-coded Ca2+ firing sites showing the effect of the SOCE channel antagonist, GSK-7975A (10 μM) on ICC-MY Ca2+ transients. Traces of PTCL area (F; blue) and PTCL count (F; green) under control conditions and in the presence of GSK-7975A, PTCL area (G; blue) and PTCL count (G; green). Summary graphs of Ca2+ PTCL activity in ICC-MY in the presence of GSK-7975A are shown in H (PTCL area), I (PTCL count), J the number of PTCL active sites and K Average percentage changes of Ca2+ transient clusters (CTCs) duration (n = 6). Significance determined using unpaired t-test, **** = P < 0.0001. All data graphed as mean ± SEM.
Fig. 15.
Fig. 15.. Ca2+ signaling drives pacemaker activity in gastric ICC-MY.
Steps in Ca2+ signaling in relation to generation of slow waves in gastric muscles are shown. For clarity the various proteins functioning during the slow wave cycle appear in panels at the stages where they become functional. 1. During the inter-slow wave interval, Ca2+ release from ER causes Ca2+ transients that activate Ano1 channels in the plasma membrane (PM). Activation of Ano1 causes development of spontaneous transient inward currents (STICs) which have depolarizing influence and generate spontaneous transient depolarizations (STDs). 2. Slow wave upstroke. The depolarization from STDs activates T-type Ca2+ current (VDCC1) that rapidly depolarize ICC-MY close to 0 mV. Influx of Ca2+ contributes to activation of Ano1 channels. 3. Plateau phase. Depolarization caused by the slow wave upstroke activates L-type Ca2+ current (VDCC2). Ca2+ entry causes localized Ca2+ induced Ca2+ release, and a multitude of Ca2+ release sites leads to development of CTCs. Ca2+ transient during CTCs activate Ano1 channels and maintain the depolarized state during the plateau phase. 4. Repolarization. When stores are depleted, Ca2+ transients cease and the open probability of Ano1 channels decreases to low levels causing repolarization. Repolarization also causes deactivation of VDCCs. SOCE (not shown) and SERCA pumps restore store Ca2+ to reset the mechanism for the next slow wave cycle. Corpus and antrum ICC-MY both manifest intrinsic pacemaker activity, however the frequency of pacemaking in the corpus is higher than in antrum. The present study suggests that the major difference between the pacemakers in the corpus and antrum is that the probability of Ca2+ transient firing is higher in corpus ICC-MY than in antrum. It should also be noted that scheme illustrated in the figure is relevant only to Ca2+ transients and activation of conductances in ICC. In intact muscles ICC are electrically coupled to SMCs. Electrical activity is recorded typically from SMCs, so additional conductances contribute to the shaping of the waveforms of slow waves. For example, the rapid repolarization following the initial upstroke (see Fig. 1C) is due to activation of an A-type current in SMCs [86, 87].

References

    1. Tack J, Gastric motor and sensory function, Curr Opin Gastroenterol 21 (2005) 665–672. - PubMed
    1. van den Elzen BD, Boeckxstaens GE, Review article: a critical view on impaired accommodation as therapeutic target for functional dyspepsia, Aliment Pharmacol Ther 23 (2006) 1499–1510. - PubMed
    1. Kelly KA, Code CF, Elveback LR, Patterns of canine gastric electrical activity, Am J Physiol 217 (1969) 461–470. - PubMed
    1. Szurszewski JH, Electrical basis for gastrointestinal motility, in: Johnson LR (Ed.), Physiology of the Gastrointestinal Tract, Raven Press, New York, 1987, pp. 383–422.
    1. Ozaki H, Stevens RJ, Blondfield DP, Publicover NG, Sanders KM, Simultaneous measurement of membrane potential, cytosolic Ca2+, and tension in intact smooth muscles, Am J Physiol 260 (1991) C917–C925. - PubMed

Publication types