. 2021 Sep 18;11(1):483.
doi: 10.1038/s41398-021-01602-5.

Staging tau pathology with tau PET in Alzheimer's disease: a longitudinal study

Collaborators, Affiliations

Staging tau pathology with tau PET in Alzheimer's disease: a longitudinal study

Shi-Dong Chen et al. Transl Psychiatry. .

Abstract

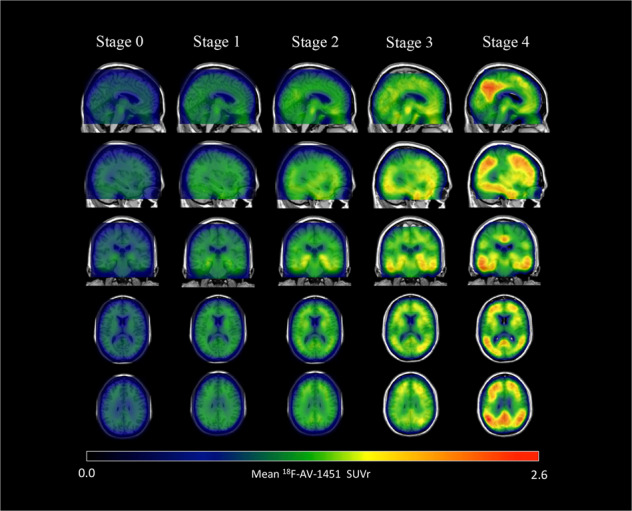
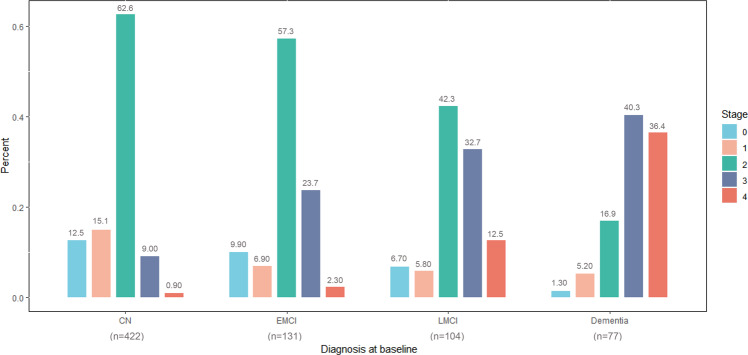
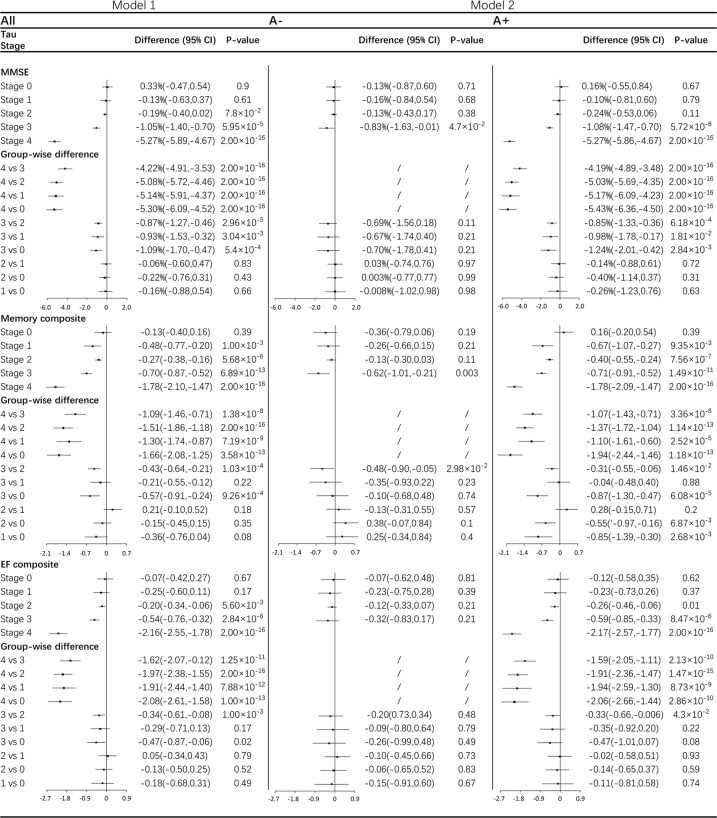
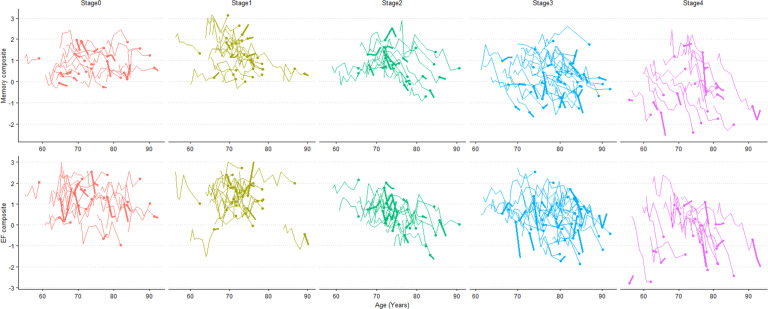
A biological research framework to define Alzheimer' disease with dichotomized biomarker measurement was proposed by National Institute on Aging-Alzheimer's Association (NIA-AA). However, it cannot characterize the hierarchy spreading pattern of tau pathology. To reflect in vivo tau progression using biomarker, we constructed a refined topographic 18F-AV-1451 tau PET staging scheme with longitudinal clinical validation. Seven hundred and thirty-four participants with baseline 18F-AV-1451 tau PET (baseline age 73.9 ± 7.7 years, 375 female) were stratified into five stages by a topographic PET staging scheme. Cognitive trajectories and clinical progression were compared across stages with or without further dichotomy of amyloid status, using linear mixed-effect models and Cox proportional hazard models. Significant cognitive decline was first observed in stage 1 when tau levels only increased in transentorhinal regions. Rates of cognitive decline and clinical progression accelerated from stage 2 to stage 3 and stage 4. Higher stages were also associated with greater CSF phosphorylated tau and total tau concentrations from stage 1. Abnormal tau accumulation did not appear with normal β-amyloid in neocortical regions but prompt cognitive decline by interacting with β-amyloid in temporal regions. Highly accumulated tau in temporal regions independently led to cognitive deterioration. Topographic PET staging scheme have potentials in early diagnosis, predicting disease progression, and studying disease mechanism. Characteristic tau spreading pattern in Alzheimer's disease could be illustrated with biomarker measurement under NIA-AA framework. Clinical-neuroimaging-neuropathological studies in other cohorts are needed to validate these findings.


Conflict of interest statement

The authors declare no competing interests.

Figures

Fig. 1
Fig. 1. Parametric 18F-AV-1451 images across stages.
In general, 18F-AV-1451 SUVr increased throughout the cortex and subcortex from stage 0 to stage 4 (numerical values shown in Table 1). Participants in stage 0 had tau levels corresponding to those of normal young adults. A dominating tau elevation in medial temporal regions (Braak I/II ROIs) was shown in stage 1. While stage 2 presented increased SUVrs in extra-medial temporal regions, stage 3 showed greater SUVrs increase in Braak III/IV ROIs including inferior and lateral temporal lobes. Stage 4 had significantly elevated 18F-AV-1451 SUVr extending into the neocortex. ROI region of interest, SUVr standard uptake value ratio.
Fig. 2
Fig. 2. Distribution of different tau stages across clinical diagnostic groups.
Under the horizontal axis are numbers of included participants in four diagnostic groups. Proportions of low stages and intermediate stages (stage 0, 1, 2) decreased with clinical deterioration, while proportions of high stages (stage 3, 4) increased. CN cognitively normal, EMCI early mild cognitive impairment, LMCI late mild cognitive impairment.
Fig. 3
Fig. 3. Baseline CSF biomarkers and plasma NFL profiles across tau stages.
A CSF p-tau across stages. B CSF t-tau across stages: CSF p-tau/t-tau levels were significantly higher for stage 3 and stage 4 respectively compared with stages 0, 1, or 2. Stage 2 significantly differed from stage 1. C CSF Aβ levels across stages: CSF Aβ levels were significantly lower for stage 3 and stage 4 respectively compared with stage 0, 1, or 2. Stage 4 marginally differed from stage 3 (P = 0.057). D Plasma NFL levels across stages: No significant difference was detected among stages for plasma NFL(P = 0.095). Under the horizontal axes are numbers of included participants in comparison. CN cognitively normal, MCI mild cognitive impairment, NFL neurofilament light chain, p-tau phosphorylated tau, t-tau total tau. *P < 0.1; **P < 0.05; ***P < 0.005.
Fig. 4
Fig. 4. Cognitive changes and comparisons across stages based on linear mixed-effects models.
Analyses of cognitive change were adjusted for age, gender, education years and ApoE ε4 counts. In both models, rates of cognitive changes with group-wise comparisons are expressed as % per year for MMSE and 10−1 per year for Memory or EF composite with 95%CI. The numbers of participants included and comparisons between the A+ and A− within the same stage are shown in Supplementary Table 3 and Supplementary Table 4 for each analysis. A+ abnormal β-amyloid, A− normal β-amyloid, CI confidence interval, EF executive function, MMSE mini-mental state examination.
Fig. 5
Fig. 5. Trajectories of memory and executive function versus age by tau stage.
Each line represents one participant’s trajectory, with the dot indicating the baseline, the thinner part of the line indicating the measures before the baseline, and the thicker part of the line indicating measures after the baseline. Participants showed a perceivable decline in stage 1, 2, 3, or 4 for memory composite and in stage 2, 3, or 4 for EF composite. The differences in rates of cognitive decline between stages were characterized using linear mixed-effects models (results shown in Fig. 4). For the panel of stage 2, a random subset of 20% of the data is shown to reduce overlap in the lines. EF executive function.
Fig. 6
Fig. 6. Kaplan–Meier curves showing the cumulative probability of clinical progression.
Clinical progression was shown for each tau stage in CN (A) and MCI (B) group. Progressive cognitive deterioration defined as (1) diagnosis of dementia or (2) MMSE ≤24 at last visit or (3) difference of MMSE ≥4 between the first visit and the last visit. Results of the log-rank test showed a significant difference between stages. Stage 0 and stage 1 were not included in analyses for no events occurred in follow-up. CN cognitively normal, MCI mild cognitive impairment, CDR clinical dementia rating.

References

    1. Thal DR, Rub U, Orantes M, Braak H. Phases of A beta-deposition in the human brain and its relevance for the development of AD. Neurology. 2002;58:1791–1800. doi: 10.1212/WNL.58.12.1791. - DOI - PubMed
    1. Braak H, Braak E. Neuropathological stageing of Alzheimer-related changes. Acta Neuropathol. 1991;82:239–59. doi: 10.1007/BF00308809. - DOI - PubMed
    1. Braak H, Alafuzoff I, Arzberger T, Kretzschmar H, Del Tredici K. Staging of Alzheimer disease-associated neurofibrillary pathology using paraffin sections and immunocytochemistry. Acta Neuropathol. 2006;112:389–404. doi: 10.1007/s00401-006-0127-z. - DOI - PMC - PubMed
    1. Braak H, Thal DR, Ghebremedhin E, Del Tredici K. Stages of the pathologic process in Alzheimer disease: age categories from 1 to 100 years. J Neuropathol Exp Neurol. 2011;70:960–9. doi: 10.1097/NEN.0b013e318232a379. - DOI - PubMed
    1. Hyman BT, Phelps CH, Beach TG, Bigio EH, Cairns NJ, Carrillo MC, et al. National Institute on Aging-Alzheimer’s Association guidelines for the neuropathologic assessment of Alzheimer’s disease. Alzheimers Dement. 2012;8:1–13. doi: 10.1016/j.jalz.2011.10.007. - DOI - PMC - PubMed

Publication types