. 2021 Sep 19;14(1):363.
doi: 10.1186/s13104-021-05763-w.

Anesthesia can alter the levels of corticosterone and the phosphorylation of signaling molecules

Affiliations

Anesthesia can alter the levels of corticosterone and the phosphorylation of signaling molecules

Gabriela Cruz Pereira et al. BMC Res Notes. .

Abstract

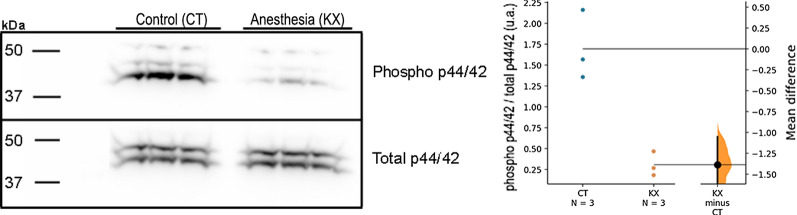
Objective: Neuroscience research using laboratory animals has increased over the years for a number of reasons. Some of these studies require the use of anesthetics for surgical procedures. However, the use of anesthetics promotes several physiological changes that may interfere with experimental results. Although the anesthetics and methods of delivery used to vary, one of the most common is ketamine associated with another compound such as xylazine. We aimed to evaluate the effect of ketamine and xylazine (KX) on corticosterone levels and on the degree of phosphorylation of p44/42 (ERK1/2), Src kinases and calcium/calmodulin-dependent kinase II (CAMKII). We also compared the effects of KX on sleep deprivation, which is known to affect the hormonal profile including corticosterone.

Results: We found that the use of KX can increase corticosterone levels and alter the degree of phosphorylation of signaling proteins.

Keywords: Corticosterone; Ketamine; Signaling molecules; Sleep deprivation; Xylazine.


Conflict of interest statement

The authors declare that there is no conflict of interest.

Figures

Fig. 1
Fig. 1
Corticosterone levels. A Corticosterone levels (ng/mL) measured in serum from the three experimental groups: the control group that received intraperitoneal 0.9% saline before euthanasia (CT), the anesthesia group that received intraperitoneal xylazine/ketamine before euthanasia (KX), and the sleep deprived animals (SD). Each dot plotted on the graph represents an individual rat. B The mean difference between the designated groups in corticosterone levels was plotted as a bootstrap sampling distribution and is depicted as a black dot. Vertical error bar represents 95CI. The unpaired mean difference between the CT and KX groups was 33.0 [95CI 29.2, 36.2] and between the CT and SD groups was 23.9 [95CI 20.7, 27.4]
Fig. 2
Fig. 2
Signaling molecules expression. A, D, G Representative image of western blots for phosphorylated and total SRC family kinases, p44/42 MAPK and CAMKII. B, E, H Relative ratio of phosphorylated proteins to total proteins. Each dot represents an individual rat (n = 4 for CT, KX and SD groups). C The mean difference between designated groups in the degree of phosphorylation of SRC was plotted as a bootstrap sampling distribution and is depicted as a black dot. Vertical error bar represents 95CI. The unpaired mean difference between the CT and KX groups was − 0.445 [95CI − 0.56, − 0.282] and between the CT and SD groups was 0.345 [95CI 0.115, 0.562]. F The mean difference between designated groups in the degree of phosphorylation of p44/42 MAPK was plotted as a bootstrap sampling distribution and is depicted as a black dot. Vertical error bar represents 95CI. The unpaired mean difference between the CT and KX groups was − 0.86 [95CI − 1.18, − 0.325] and between the CT and SD groups was 0.065 [95CI − 0.173, 0.263]. G The mean difference between designated groups in the degree of phosphorylation of CAMKII was plotted as a bootstrap sampling distribution and is depicted as a black dot. Vertical error bar represents 95CI. The unpaired mean difference between the CT and KX groups was 0.108 [95CI − 0.143, 0.305] and between the CT and SD groups was − 0.0075 [95CI − 0.165, 0.155]
Fig. 3
Fig. 3
p44/42 MAP kinase expression in similar batch of animals. A Representative image of western blot for phosphorylated and total p44/42 MAP kinase. Each dot plotted on graph represents an individual rat. B Relative ratio of phosphorylated p44/42 MAP kinase to total p44/42 MAP kinase. Each dot represents an individual rat (n = 3). The mean difference between designated groups in the degree of phosphorylation of p44/42 MAP kinase was plotted as a bootstrap sampling distribution and is depicted as a black dot. Vertical error bar represents 95CI. The unpaired mean difference between the CT and KX groups was − 1.39 [95CI − 1.92, − 1.06]

References

    1. Keifer J, Summers CH. Putting the “biology” back into “neurobiology”: the strength of diversity in animal model systems for neuroscience research. Front Syst Neurosci. 2016;10:69. doi: 10.3389/fnsys.2016.00069. - DOI - PMC - PubMed
    1. Bovenkerk B, Kaldewaij F. The use of animal models in behavioural neuroscience research. Curr Top Behav Neurosci. 2015;19:17–46. doi: 10.1007/7854_2014_329. - DOI - PubMed
    1. Ellenbroek B, Youn J. Rodent models in neuroscience research: is it a rat race? Dis Model Mech. 2016;9(10):1079–1087. doi: 10.1242/dmm.026120. - DOI - PMC - PubMed
    1. Fornari RV, Wichmann R, Atsak P, Atucha E, Barsegyan A, Beldjoud H, et al. Rodent stereotaxic surgery and animal welfare outcome improvements for behavioral neuroscience. J Vis Exp. 2012;59:e3528. - PMC - PubMed
    1. Flecknell P. Replacement, reduction and refinement. Altex. 2002;19(2):73–78. - PubMed