. 2021 Oct:139:103907.
doi: 10.1016/j.euroecorev.2021.103907. Epub 2021 Sep 11.

Tracking GDP in real-time using electricity market data: Insights from the first wave of COVID-19 across Europe

Affiliations

Tracking GDP in real-time using electricity market data: Insights from the first wave of COVID-19 across Europe

Carlo Fezzi et al. Eur Econ Rev. 2021 Oct.

Abstract

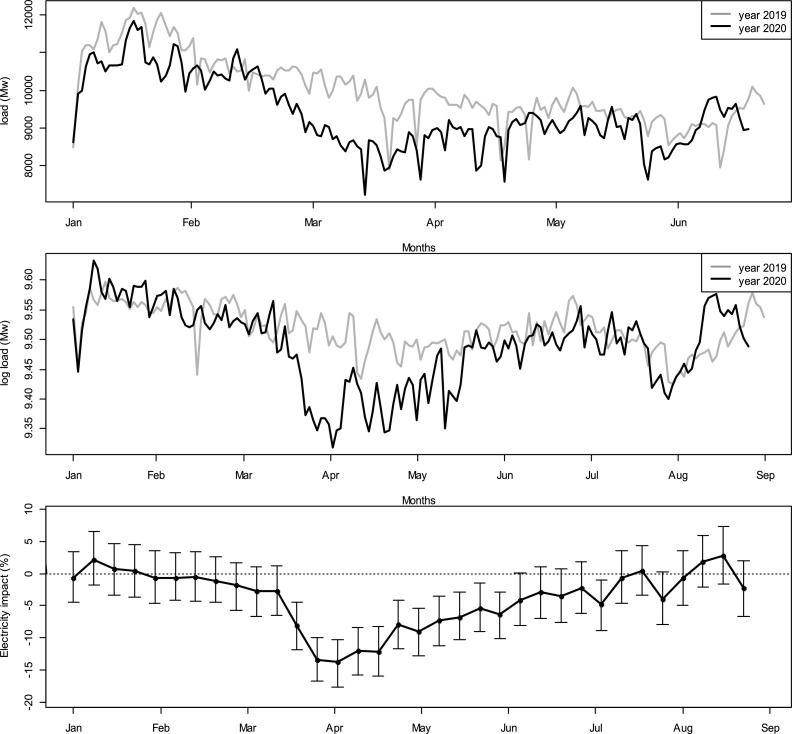
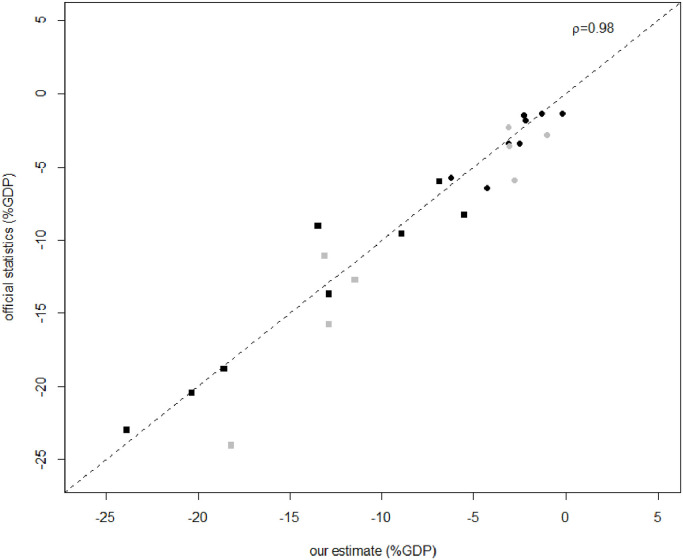
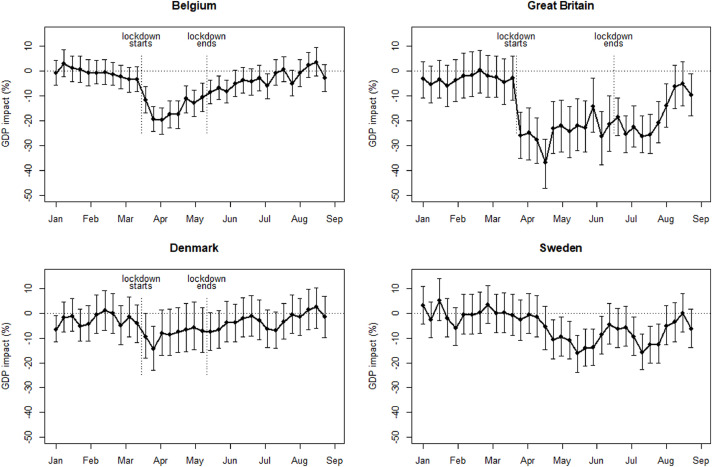
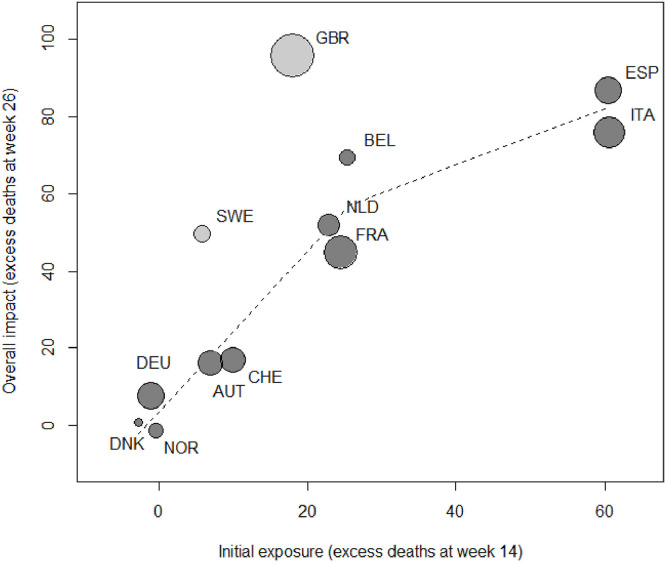
This paper develops a methodology for tracking in real-time the impact of shocks (such as natural disasters, financial crises or pandemics) on gross domestic product (GDP) by analyzing high-frequency electricity market data. As an illustration, we estimate the GDP loss caused by COVID-19 in twelve European countries during the first wave of the pandemic. Our results are almost indistinguishable from the official statistics during the first two quarters of 2020 (the correlation coefficient is 0.98) and are validated by several robustness tests. We provide estimates that are more chronologically disaggregated and up-to-date than standard macroeconomic indicators and, therefore, can provide timely information for policy evaluation in time of crisis. Our results show that pursuing "herd immunity" did not shelter from the harmful economic impacts of the first wave of the pandemic. They also suggest that coordinating policies internationally is fundamental for minimizing spillover effects from non-pharmaceutical interventions across countries.

Keywords: COVID-19; Economic impact; Electricity demand; Mortality; Real-time indicators.


Figures

Fig. 1.
Fig. 1.
Electricity time series and COVID-19 impact for Belgium Notes: plot A presents the original electricity consumption time-series, plot B presents the same time-series after prefiltering and plot C presents the estimated impacts of electricity consumption, with the vertical lines indicating 95% confidence intervals.
Fig. 2.
Fig. 2.
Relationship between our estimates and official statistics Notes: The dots represent estimates for the 2020 Q1 and the squares for 2020 Q2. In gray we plot estimates that are indicated as “provisional” in the OECD database. The correlation coefficient ρ is calculated excluding these provisional data. Including such provisional data, it decreases to 0.96.
Fig. 3.
Fig. 3.
Estimated impact of COVID-19 on GDP Notes: The plots present weekly GDP impacts, with the vertical lines indicating the 95% confidence intervals. In different countries lockdowns were implemented and then gradually lifted following different strategies. To allow comparisons, here we indicate as “lockdown ends” the date in which all retail shops are reopened (dates for all countries are in Appendix A4).
Fig. 4.
Fig. 4.
Public health and economic impacts of COVID-19 Notes: Excess deaths calculated as the difference between the cumulated total deaths per 100,000 residents during each week of 2020 and the average cumulated deaths for the same week in the years 2015-2019. Week 14 corresponds to cumulated excess deaths until the first week of April, and week 26 corresponds to comulated excess deaths until the last week of June. The size of the balloons represents the overall GDP reduction estimated by our model until the end of our sample (26-08-2020). Dashed line represents the best fitting local linear regression via non-parametric estimation.

References

    1. Acemoglu D., Chernozhukov V., Werning I., Whinston M.D. National Bureau of Economic Research; 2020. Optimal Targeted Lockdowns in a Multi-Group SIR Model. NBER Working Papers 27102.
    1. Agdas D., Barooah P. Impact of the COVID-19 pandemic on the U.S. electricity demand and supply: an early view from data. IEEE Access. 2020;8:151523–151534. - PMC - PubMed
    1. Allcott H., Boxell L., Conway J., Gentzkow M., Thaler M., Yang D.Y. Polarization and public health: partisan differences in social distancing during the Coronavirus pandemic. J. Public Econ. 2020;191 - PMC - PubMed
    1. Altig D., Baker S., Barrero J.M., Bloom N., Bunn P., Chen S., Mizen P. Economic uncertainty before and during the COVID-19 pandemic. J. Public Econ. 2020;191 - PMC - PubMed
    1. Andreou E., Ghysels E., Kourtellos A. Should macroeconomic forecasters use daily financial data and how? J. Bus. Econom. Stat. 2013;31(2):240–251.