. 2021 Sep 1:15:709775.
doi: 10.3389/fnbeh.2021.709775. eCollection 2021.

Lifetime Observation of Cognition and Physiological Parameters in Male Mice

Affiliations

Lifetime Observation of Cognition and Physiological Parameters in Male Mice

Pia Kahnau et al. Front Behav Neurosci. .

Abstract

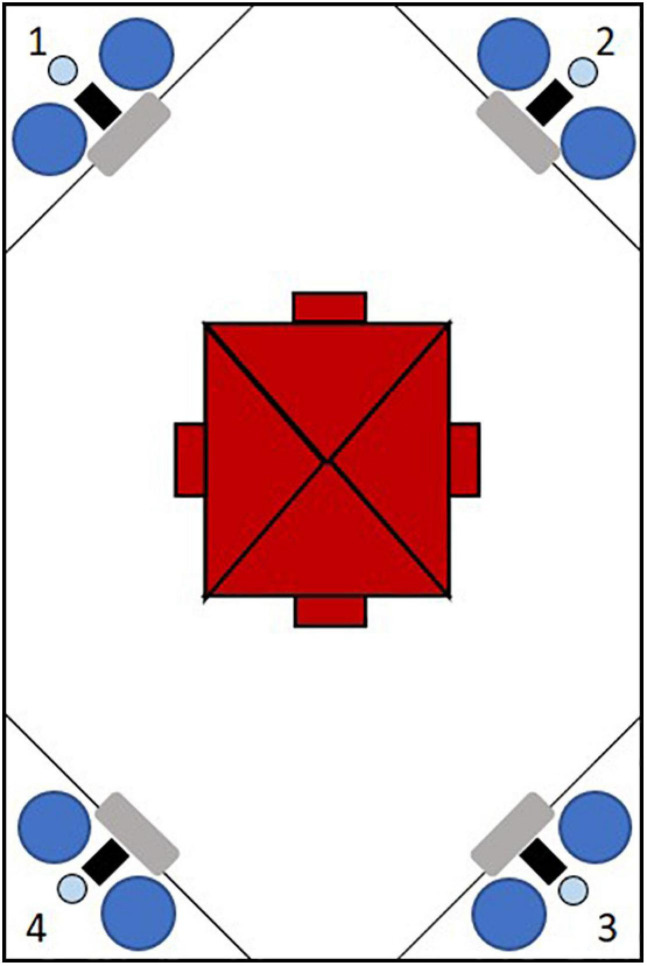
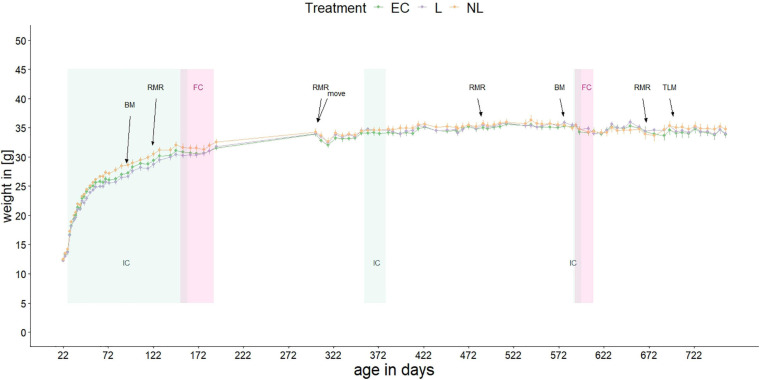
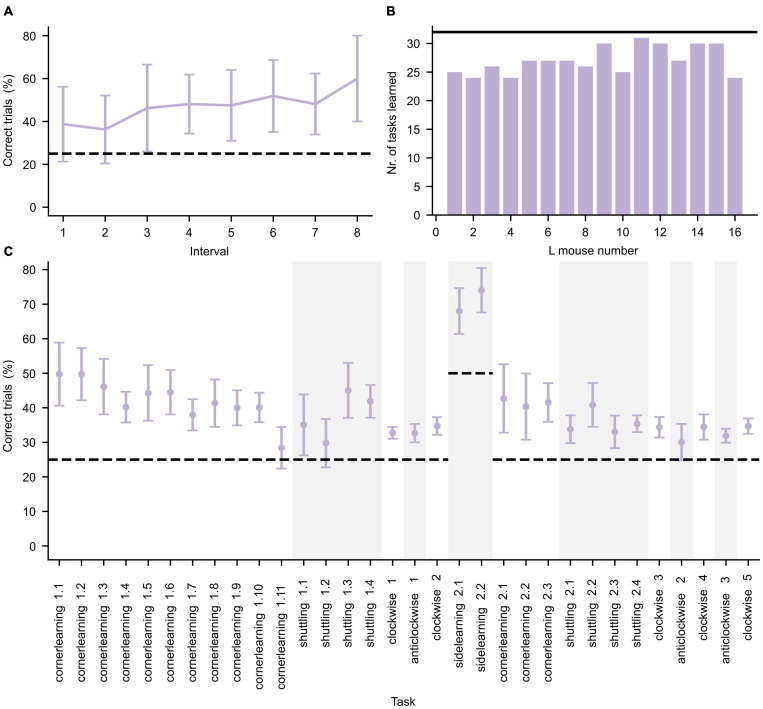
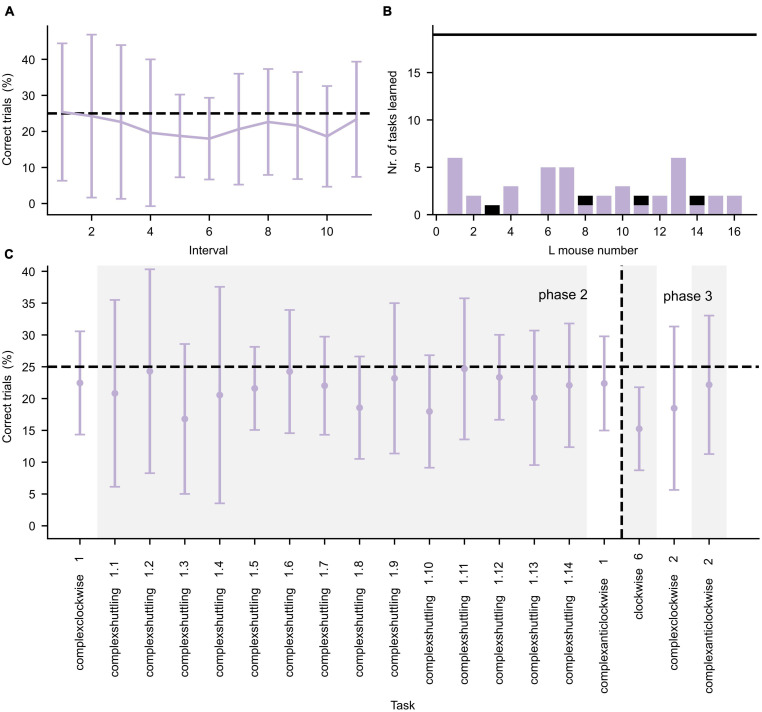
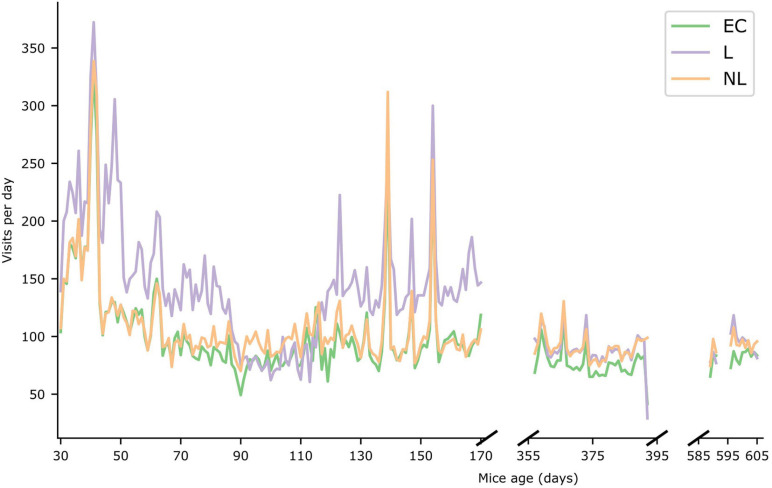
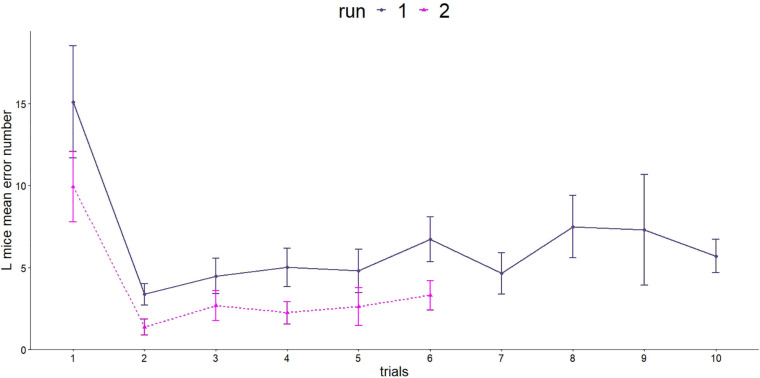
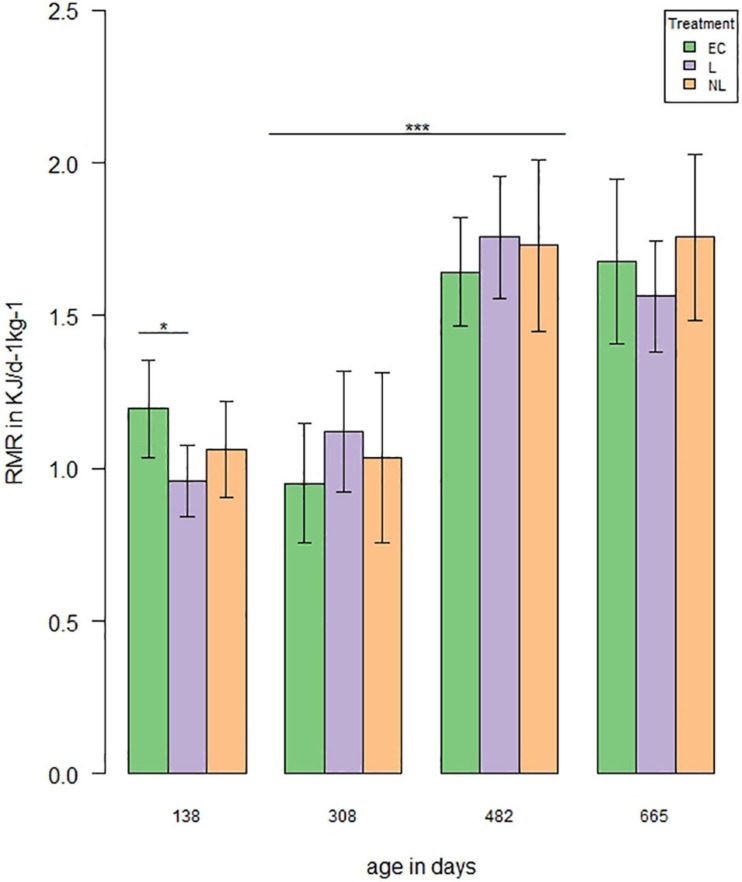
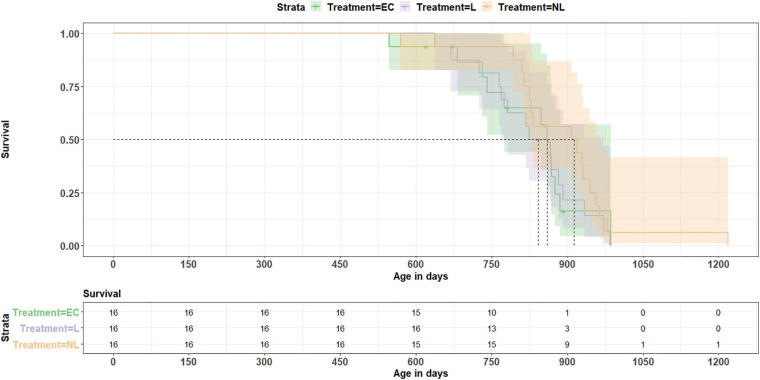
Laboratory mice are predominantly used for one experiment only, i.e., new mice are ordered or bred for every new experiment. Moreover, most experiments use relatively young mice in the range of late adolescence to early adulthood. As a consequence, little is known about the day-to-day life of adult and aged laboratory mice. Here we present a long-term data set with three consecutive phases conducted with the same male mice over their lifetime in order to shed light on possible long-term effects of repeated cognitive stimulation. One third of the animals was trained by a variety of learning tasks conducted up to an age of 606 days. The mice were housed in four cages with 12 animals per cage; only four mice per cage had to repeatedly solve cognitive tasks for getting access to water using the IntelliCage system. In addition, these learner mice were tested in standard cognitive tests outside their home-cage. The other eight mice served as two control groups living in the same environment but without having to solve tasks for getting access to water. One control group was additionally placed on the test set-ups without having to learn the tasks. Next to the cognitive tasks, we took physiological measures (body mass, resting metabolic rate) and tested for dominance behavior, and attractivity in a female choice experiment. Overall, the mice were under surveillance until they died a natural death, providing a unique data set over the course of virtually their entire lives. Our data showed treatment differences during the first phase of our lifetime data set. Young learner mice showed a higher activity, less growth and resting metabolic rate, and were less attractive for female mice. These effects, however, were not preserved over the long-term. We also did not find differences in dominance or effects on longevity. However, we generated a unique and valuable set of long-term behavioral and physiological data from a single group of male mice and note that our long-term data contribute to a better understanding of the behavioral and physiological processes in male C57Bl/6J mice.

Keywords: IntelliCage; cognition; laboratory mice; lifetime observation; resting metabolic rate.


Conflict of interest statement

The authors declare that the research was conducted in the absence of any commercial or financial relationships that could be construed as a potential conflict of interest.

Figures

FIGURE 1
FIGURE 1
Schematic figure of an IntelliCage from the top with four conditional corners marked by numbers. Each corner contains a radio frequency identification antenna (gray), a presence-sensor (black), an airpuff valve (light blue) and two water dispensers (dark blue). In the cage center four shelters (red) are arranged under the food rack.
FIGURE 2
FIGURE 2
Body mass of mice over their lifetime. Shown are the mean body masses of the three treatment groups. At 305 days of age, the mice moved to another animal facility. Repeated experiments were conducted: IC, IntelliCage; FC, female choice test; BM, Barnes maze test; RMR, resting metabolic rate; TLM, telomere length measurement. When not in the ICs, the mice were kept in standard home-cages within their social groups.
FIGURE 3
FIGURE 3
Performance during the first IntelliCage phase. (A) Average performance (±standard deviation, n = 16) of all L mice for the first day of the cornerlearning task, divided in intervals of 10 trials per interval. Since the least active mouse performed less than 90 trials, only the first eight intervals are shown. The increase of performance over time reflects learning in the mice. (B) Number of tasks for which the L mice successfully achieved the learning criterion. The black horizontal line represents the total number of tasks. (C) Average performance (±standard deviation, n = 16) per learning task. Changes in task type are separated by alternating white and gray background color. The learning tasks are represented in chronological order. The dashed lines in panels (A,C) represent the chance level of correct performance in each task.
FIGURE 4
FIGURE 4
Performance during the second and third IntelliCage phase. (A) Average performance (±standard deviation, n = 16) of all L mice for the first 550 trials of the Complexclockwise 1 learning task, divided in intervals of 50 trials per interval. (B) Number of tasks for which the L mice successfully achieved the learning criterion. The black horizontal line represents the total number of tasks. The purple and black bars represent successful tasks during phase 2 and 3, respectively. (C) Average performance (±standard deviation, n = 16) is given by the error bar data points. Changes in task are separated by alternating white and gray background color. The learning tasks are represented in chronological order. The horizontal dashed lines in both panels (A,C) represent the chance level of correct performance in each task. The vertical dashed line in panel (C) represents the separation between IC phase 2 and 3.
FIGURE 5
FIGURE 5
Foraging behavior. Number of visits per day during the three IntelliCage phases. The X-axis represents the age of the mice (in days). The average value of the three different treatment groups are shown for the three IntelliCage phases.
FIGURE 6
FIGURE 6
Number of errors made in the Barnes maze test. Since the two runs were carried out differently (number of trials and length of trials), a separate statistical evaluation was carried out. First run, dark purple line: n = 16; age = 92 days; second run, purple line: n = 16, age = 573 days.
FIGURE 7
FIGURE 7
Resting metabolic rate (RMR) over time. RMR was measured four times (138, 308, and 482 days of age n = 48, 665 days of age n = 44). The analysis showed a treatment effect on RMR with an age of 138 days between EC and L mice (t = 2.58, p = 0.04). RMR increased significantly between the second and third measurement (|t| > 7.0, p < 0.001; *p < 0.05, ***p < 0.001).
FIGURE 8
FIGURE 8
Relative telomere length of male mice at the age of 699 days (n = 44 mice, 15 = L, 14 = NL, 15 = EC).
FIGURE 9
FIGURE 9
Survival analysis. The data show no treatment effect (EC = equipment control group, L = learner, NL = non-learner) on survival (p = 0.43). Dashed lines indicate median length of survival for each treatment group.

References

    1. Bates D., Machler M., Bolker B., Walker S. (2015). Fitting linear mixed-effects models using lme4. J. Stat. Softw. 67 1–48.
    1. Benetos A., Gardner J. P., Zureik M., Labat C., Xiaobin L., Adamopoulos C., et al. (2004). Short telomeres are associated with increased carotid atherosclerosis in hypertensive subjects. Hypertension 43 182–185. 10.1161/01.HYP.0000113081.42868.f4 - DOI - PubMed
    1. Bischoff R. J., Gould J. L., Rubenstein D. I. (1985). Tail size and female choice in the guppy (Poecilia reticulata). 17 253–255.
    1. Blasco M. A., Lee H. W., Hande M. P., Samper E., Lansdorp P. M., DePinho R. A., et al. (1997). Telomere shortening and tumor formation by mouse cells lacking telomerase RNA. Cell 91 25–34. 10.1016/S0092-8674(01)80006-4 - DOI - PubMed
    1. Boogert N. J., Fawcett T. W., Lefebvre L. (2011). Mate choice for cognitive traits: a review of the evidence in nonhuman vertebrates. Behav. Ecol. 22 447–459. 10.1093/beheco/arq173 - DOI