

Assessing Fatty Infiltration of Paraspinal Muscles in Patients With Lumbar Spinal Stenosis: Goutallier Classification and Quantitative MRI Measurements
- PMID: 34539538
- PMCID: PMC8446197
- DOI: 10.3389/fneur.2021.656487
Assessing Fatty Infiltration of Paraspinal Muscles in Patients With Lumbar Spinal Stenosis: Goutallier Classification and Quantitative MRI Measurements
Abstract
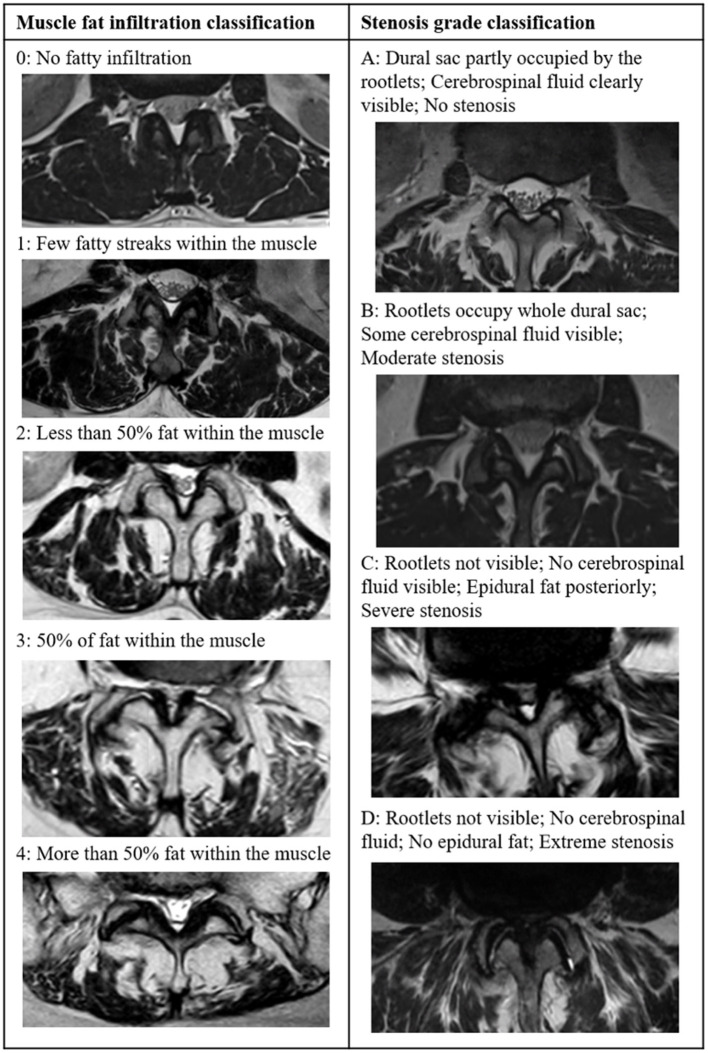
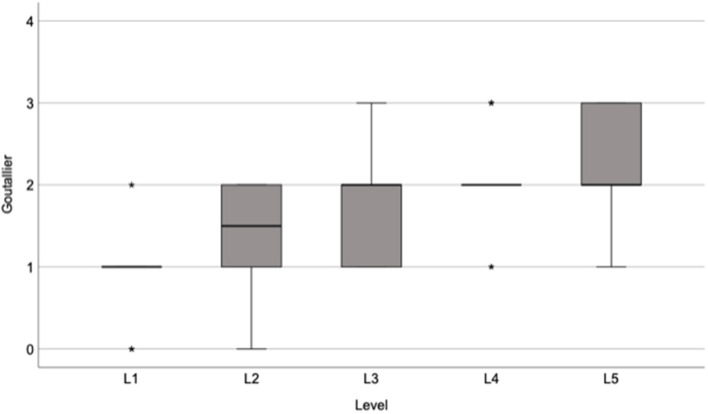
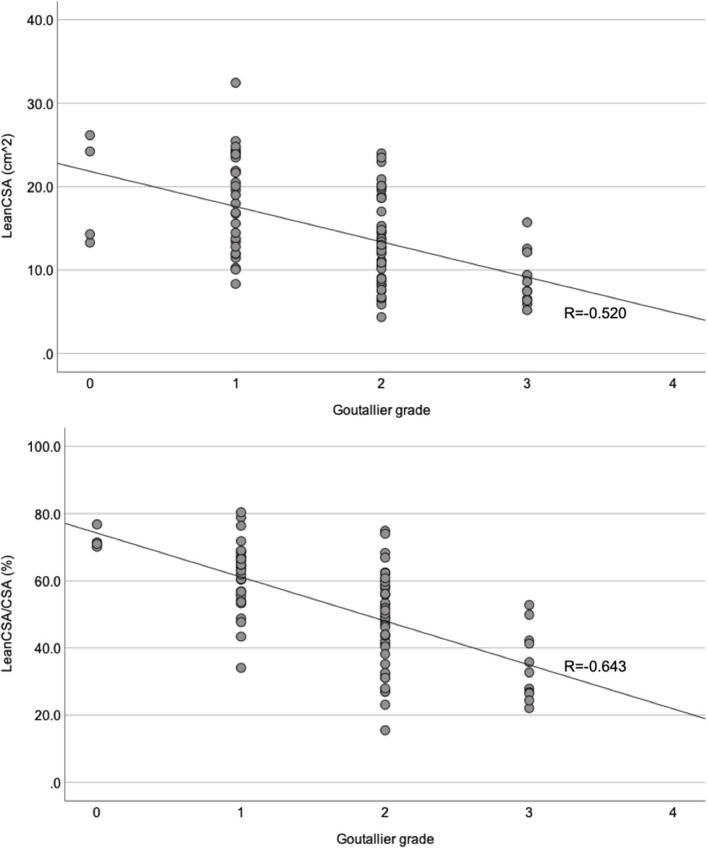
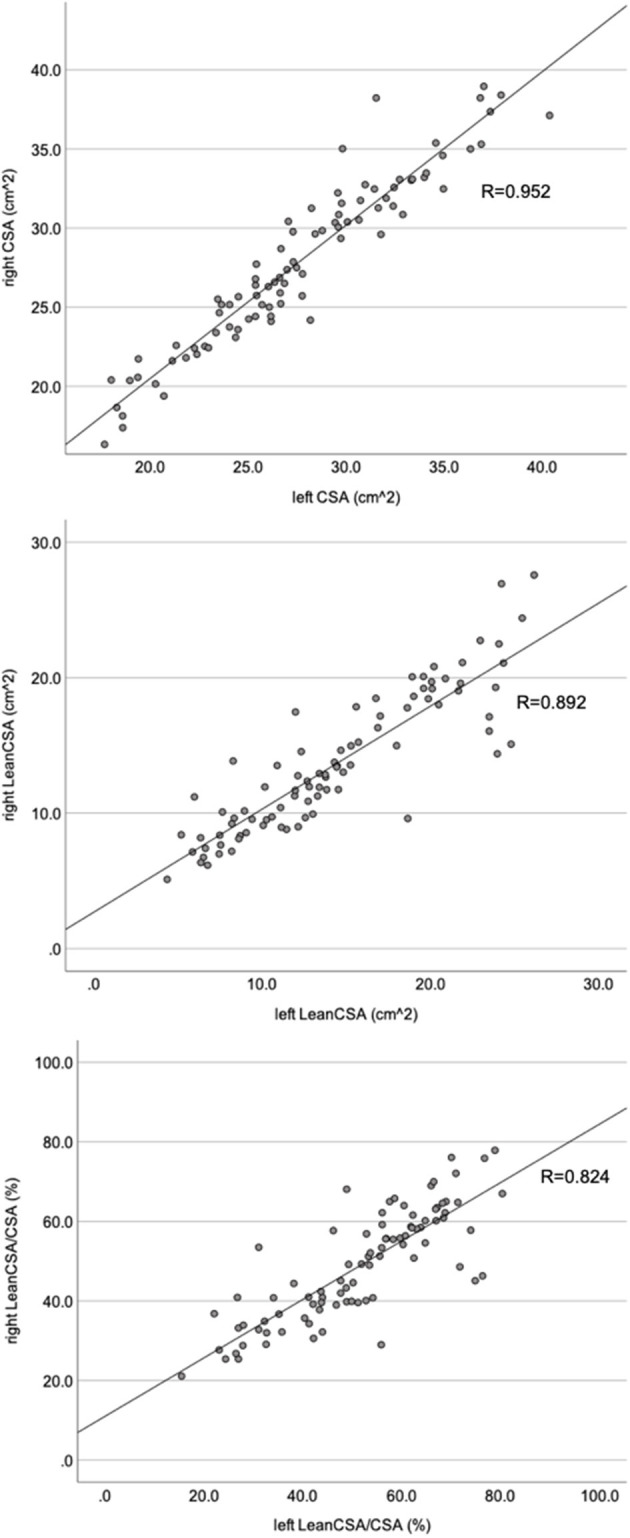
Objective: Fatty infiltration of paraspinal muscle is associated with spinal disorders. It can be assessed qualitatively (i.e., Goutallier classification) and quantitatively using image processing software. The aims of this study were to compare paraspinal muscle fatty infiltration as assessed using the Goutallier classification vs. quantitative magnetic resonance images (MRI) measurements and to investigate the association between anthropometric parameters and paraspinal muscle morphology and fatty infiltration in patients with symptomatic lumbar spinal stenosis (LSS). Methods: Patients affected by symptomatic LSS scheduled for surgery with available MRI of the lumbar spine were included in this retrospective cross-sectional study. Fatty infiltration at each lumbar level was rated qualitatively according to the Goutallier classification and quantified based on the cross-sectional area (CSA) of the paraspinal muscle, of its lean fraction (LeanCSA), and the ratio between LeanCSA and CSA and the CSA relative to the CSA of vertebral body (RCSA). Considering the muscle as a single unit, overall fatty infiltration according to Goutallier, overall CSA, LeanCSA, LeanCSA/CSA, and RCSA were computed as averages (aGoutallier, aCSA, aLeanCSA, aLeanCSA/aCSA, and aRCSA). Associations among parameters were assessed using Spearman's respective Pearson's correlation coefficients. Results: Eighteen patients, with a mean age of 71.3 years, were included. aGoutallier correlated strongly with aLeanCSA and aLeanCSA/aCSA (R = -0.673 and R = -0.754, both P < 0.001). There was a very strong correlation between values of the left and right sides for CSA (R = 0.956, P < 0.001), LeanCSA (R = 0.900, P < 0.001), and LeanCSA/CSA (R = 0.827, P < 0.001) at all levels. Among all anthropometric measurements, paraspinal muscle CSA correlated the most with height (left: R = 0.737, P < 0.001; right: R = 0.700, P < 0.001), while there was a moderate correlation between vertebral body CSA and paraspinal muscle CSA (left: R = 0.448, P < 0.001; right: R = 0.454, P < 0.001). Paraspinal muscle CSA correlated moderately with body mass index (BMI; left: R = 0.423, P < 0.001; right: R = 0.436, P < 0.001), and there was no significant correlation between aLeanCSA or aLeanCSA/CSA and BMI. Conclusions: The Goutallier classification is a reliable yet efficient tool for assessing fatty infiltration of paraspinal muscles in patients with symptomatic LSS. We suggest taking body height as a reference for normalization in future studies assessing paraspinal muscle atrophy and fatty infiltration.
Keywords: Goutallier; muscle fatty infiltration; paraspinal cross-sectional area; paraspinal muscles fatty infiltration; paraspinal muscles morphology.
Copyright © 2021 Mandelli, Nüesch, Zhang, Halbeisen, Schären, Mündermann and Netzer.
Conflict of interest statement
The authors declare that the research was conducted in the absence of any commercial or financial relationships that could be construed as a potential conflict of interest.
Figures


References
LinkOut - more resources
Full Text Sources