. 2021 Sep 1:12:721453.
doi: 10.3389/fimmu.2021.721453. eCollection 2021.

IL-17 and CCR9+α4β7- Th17 Cells Promote Salivary Gland Inflammation, Dysfunction, and Cell Death in Sjögren's Syndrome

Affiliations

IL-17 and CCR9+α4β7- Th17 Cells Promote Salivary Gland Inflammation, Dysfunction, and Cell Death in Sjögren's Syndrome

Sun-Hee Hwang et al. Front Immunol. .

Abstract

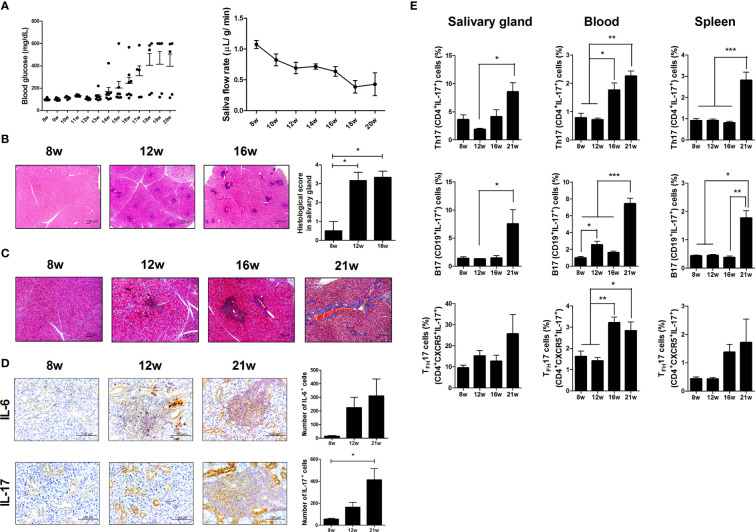
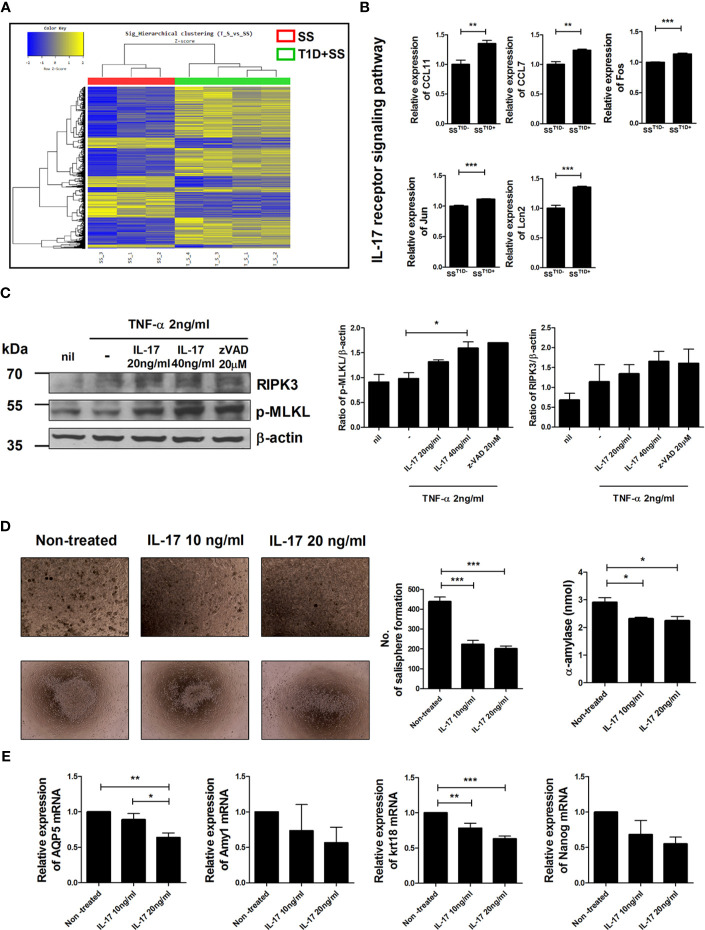
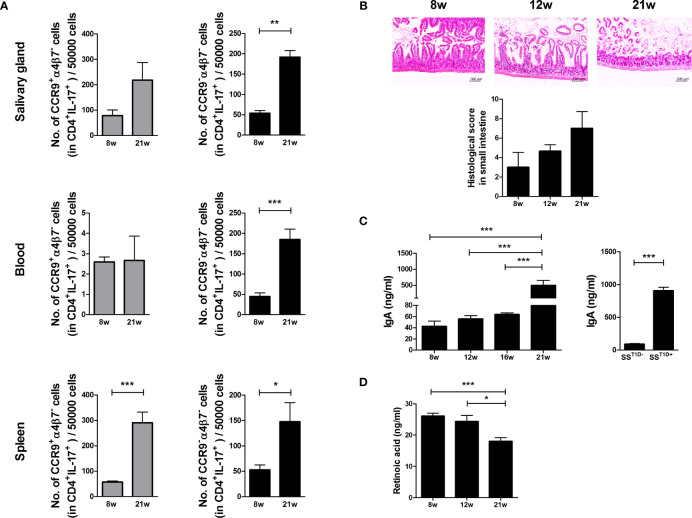
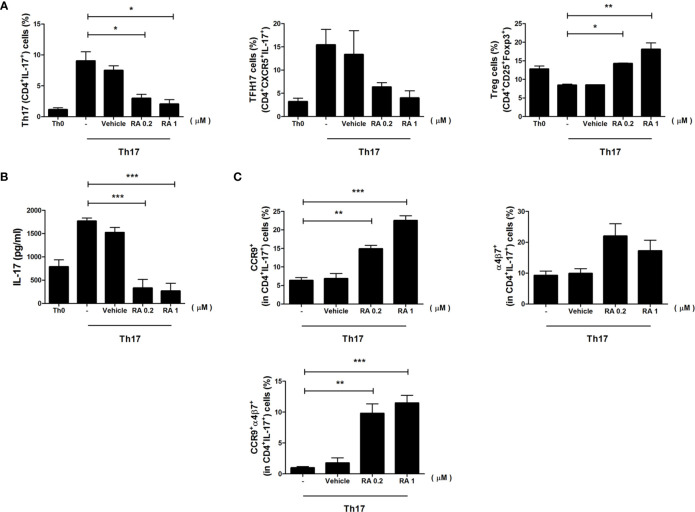
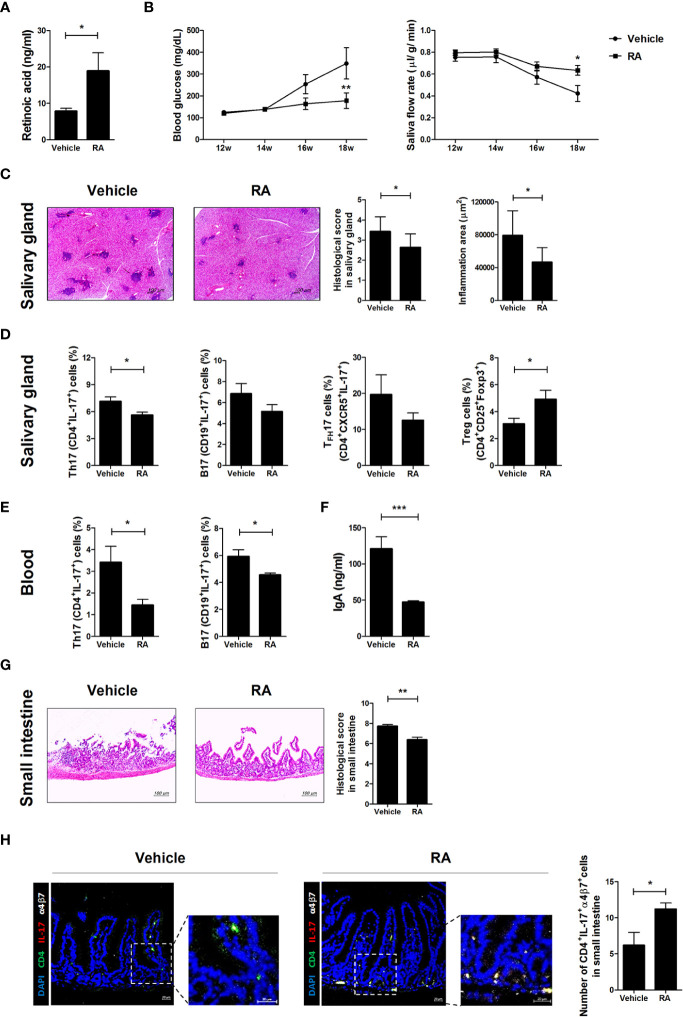
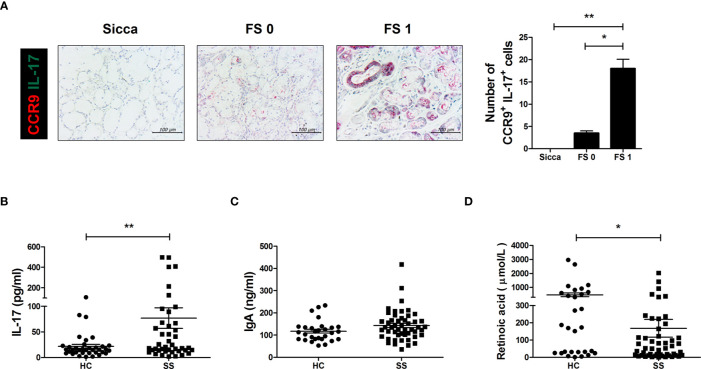
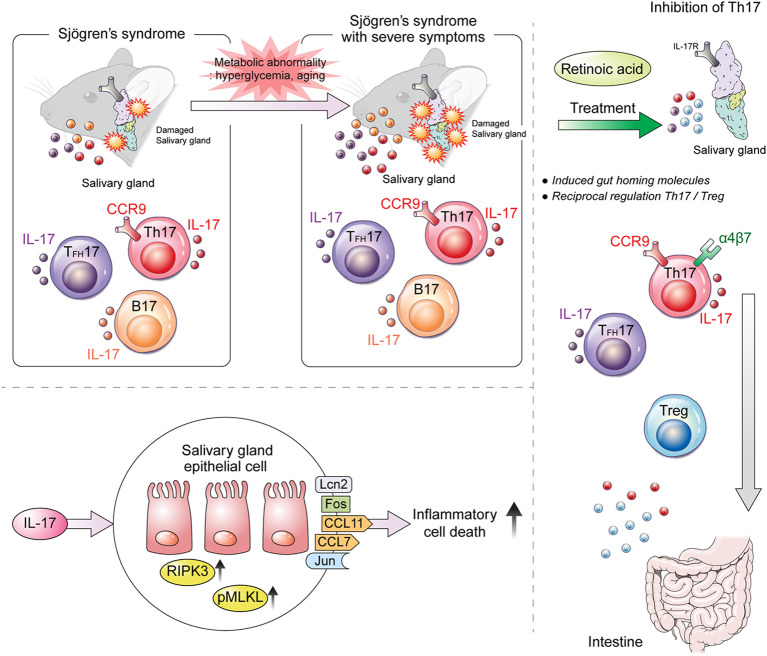
Previous studies have evaluated the roles of T and B cells in the pathogenesis of Sjögren's syndrome (SS); however, their relationships with age-dependent and metabolic abnormalities remain unclear. We examined the impacts of changes associated with aging or metabolic abnormalities on populations of T and B cells and SS disease severity. We detected increased populations of IL-17-producing T and B cells, which regulate inflammation, in the salivary glands of NOD/ShiLtJ mice. Inflammation-induced human submandibular gland cell death, determined based on p-MLKL and RIPK3 expression levels, was significantly increased by IL-17 treatment. Among IL-17-expressing cells in the salivary gland, peripheral blood, and spleen, the α4β7 (gut-homing integrin)-negative population was significantly increased in aged NOD/ShiLtJ mice. The α4β7-positive population markedly increased in the intestines of aged NOD/ShiLtJ mice following retinoic acid (RA) treatment. A significant increase in α4β7-negative IL-17-expressing cells in salivary glands may be involved in the onset and progression of SS. These results suggest the potential therapeutic utility of RA in SS treatment.

Keywords: Sjögren’s syndrome; aging; gut-homing; interleukin 17; retinoic acid.


Conflict of interest statement

The authors declare that the research was conducted in the absence of any commercial or financial relationships that could be construed as a potential conflict of interest.

Figures

Figure 1
Figure 1
Investigation of Sjögren’s syndrome (SS) and T1D symptoms in NOD/ShiLtJ mice. (A) Blood glucose levels (left) and salivary flow rates (right) were measured in NOD/ShiLtJ mice at the indicated ages (N=20 at 8 wk, 15 at 9 to12 wk, 10 at 13 to16 wk, and 5 at 17 to 20 wk). (B) Representative hematoxylin and eosin (H&E)-stained images of salivary glands from NOD/ShiLtJ mice at the indicated ages. Scale bar = 100 µm. Bar graph shows average histological scores (N=5). (C) Representative Masson’s trichrome-stained images of salivary glands from NOD/ShiLtJ mice at the indicated ages (N=5). Scale bar = 100 µm. (D) Representative IL-6- (top) and IL-17- (bottom) stained images of salivary glands of NOD/ShiLtJ mice at the indicated ages. Bar graphs show average numbers of IL-6- (top) and IL-17- (bottom) positive cells (N=5). (E) Bar graphs show average frequencies of CD4+IL-17+ (Th17), CD19+IL-17+ (B17), and CD4+CXCR5+IL-17+ (TFH17) cells among cells isolated from salivary glands (left), peripheral blood (center), and spleens (right) of NOD/ShiLtJ mice at the indicated ages (N=5). Cells were stimulated with phorbol 12-myristate 13-acetate (PMA) and ionomycin for 4 h and GolgiStop for the final 2 h, and then stained with the indicated antibodies for flow cytometry analysis. Values are means ± SEM from three independent experiments. *p < 0.05, **p < 0.01, ***p < 0.001.
Figure 2
Figure 2
Effects of IL-17 in salivary gland cells. (A) Hierarchical clustering shows gene expression in isolated salivary gland cells from NOD/ShiLtJ mice with or without T1D. Yellow and blue regions in cells indicate high and low relative expression levels, respectively. (B) Bar graphs show expression levels of indicated genes involved in the IL-17 receptor signaling pathway according to microarray analysis. (C) Human salivary gland cells were cultured with TNF-α in the absence or presence of recombinant human IL-17 or z-VAD for 48 h, and the expression levels of p-MLKL (left), RIPK3 (right), and β-actin were examined by Western blotting. Bar graphs show average expression levels of p-MLKL (left) and RIPK3 (right). (D) Micrographs show mouse salisphere sizes in cultured salivary gland stem cells (SGSCs) with IL-17. Original magnifications were 200× (top) and 40× (bottom). Bar graphs show average numbers of salispheres (left) and average secretion of α-amylase (right) under the indicated conditions. (E) Bar graphs show average transcription levels of AQP5, Amy1, Krt18, and Nanog under the indicated conditions. Values are means ± SEM from three independent experiments. *p < 0.05, **p < 0.01, ***p < 0.001.
Figure 3
Figure 3
Regulation of small intestinal inflammation and gut-homing molecules expression in Th17 cells due to retinoic acid (RA) deficiency in aged mice. (A) Bar graphs show average numbers of CCP9+α4β7 (left) and CCP9α4β7 (right) cells among cells isolated from salivary glands (top), peripheral blood (middle), and spleens (bottom) of 8- and 21-week-old NOD/ShiLtJ mice. Cells were stimulated with PMA and ionomycin for 4 h and GolgiStop for the final 2 h, and then stained with the indicated antibodies for flow cytometry analysis (N=5). (B) Representative H&E-stained images of small intestines from NOD/ShiLtJ mice at the indicated ages. Bar graph shows average histological scores (N=5). Scale bar= 100 µm. (C) Bar graphs show average IgA levels in sera from NOD/ShiLtJ mice at the indicated ages (left) and SS mice with or without T1D (right) (N=5). (D) Bar graph shows average retinoic acid levels in sera from NOD/ShiLtJ mice at the indicated ages (N=5). Values are means ± SEM from three independent experiments. *p < 0.05, **p < 0.01, ***p < 0.001.
Figure 4
Figure 4
The role of RA in the regulation of CD4+ T cells and gut-homing molecules. Splenic CD4+ T cells were isolated from NOD/ShitJ mice and then cultured under Th17 differentiation conditions with or without RA for 3 days. (A) Bar graphs show average frequencies of CD4+IL-17+ (Th17), CD4+CXCR5+ IL-17+ (TFH17), and CD4+CD25+Foxp3+ (Treg) cells under the indicated conditions. (B) Bar graph shows average levels of secretory IL-17, as determined in the culture supernatant by enzyme-linked immunosorbent assay (ELISA) under the indicated conditions. (C) Bar graphs show average frequencies of CCR9+ (top and left), α4β7+ (top and right), and CCR9+α4β7+ (bottom) in CD4+IL-17+ cells under the indicated conditions. Data are means ± SEM from three independent experiments. *p < 0.05, **p < 0.01, ***p < 0.001.
Figure 5
Figure 5
Treatment with RA ameliorated SS symptoms in NOD/ShiLtJ mice. We injected 12-week-old NOD/ShiLtJ mice intraperitoneally with 1 mg/kg RA three times per week for 6 weeks. (A) Bar graph shows average RA levels in sera from vehicle- (N=5) and RA-treated mice (N=5). (B) Blood glucose levels (left) and salivary flow rates (right) were measured in vehicle- (N=10) and RA treated-NOD/ShiLtJ mice (N=10) at the indicated ages. (C) Representative H&E-stained images of salivary glands from vehicle- (left) (N=10) and RA treated- (right) NOD/ShiLtJ mice (N=10). Bar graph shows average inflammation area of salivary glands. Scale bar= 100 µm. (D) Bar graphs show average frequencies of Th17 (CD4+IL-17+), B17 (CD19+IL-17+), TFH17 (CD4+CXCR5+IL-17+), and Treg (CD4+CD25+Foxp3+) cells among cells isolated from salivary glands of vehicle- (N=10) and RA-treated NOD/ShiLtJ mice (N=10). Cells were stimulated with PMA and ionomycin for 4 h and GolgiStop for the final 2 h, and then stained with the indicated antibodies for flow cytometry analysis. (E) Bar graphs show average frequencies of Th17 (CD4+IL-17+) and B17 (CD19+IL-17+) cells in peripheral blood mononuclear cells of vehicle- (N=10) and RA-treated NOD/ShiLtJ mice (N=10). Cells were stimulated with PMA and ionomycin for 4 h and GolgiStop for the final 2 h, and then stained with the indicated antibodies for flow cytometry analysis. (F) Bar graph shows average IgA levels in sera from vehicle- and RA-treated mice. (G) Representative H & E-stained images of small intestines from vehicle- (left) (N=10) and RA treated- (right) NOD/ShiLtJ mice (N=10). Bar graph shows average histological scores for small intestine tissues. Scale bar= 100 µm. (H) Representative immunofluorescence images for CD4 (green), IL-17 (red), α4β7 (white) and DAPI counterstaining (blue) in small intestine tissues of vehicle- (N=5) and RA-treated mice (N=5). Original magnification was 200×. Values are means ± SEM from three independent experiments. *p < 0.05, **p < 0.01, ***p < 0.001.
Figure 6
Figure 6
IL-17 cells expressing gut-homing receptors in salivary glands and RA, IgA, and IL-17 levels in SS patient sera. (A) Representative CDR9- and IL-17-stained salivary glands from the indicated patient groups. Bar graph shows average numbers of CCR9+IL-17+ cells in salivary gland tissues. (B–D) Bar graphs show average levels of IL-17 (B), IgA (C), and RA (D) in sera from healthy control (HC) and SS patients. Values are means ± SEM. *p < 0.05, **p < 0.01.
Figure 7
Figure 7
Graphical summary of the findings of the present study. Our study demonstrates that IL-17 and CCR9+α4β7 Th17 cells promote salivary gland inflammation and dysfunction in SS. RA ameliorates aging- and metabolic-abnormality-induced salivary gland inflammation by inducing gut-homing CCR9+α4β7+ Th17 and Treg cells in SS.

References

    1. Murube J. Henrik Sjogren, 1899-1986. Ocul Surf (2010) 8(1):2–7. 10.1016/S1542-0124(12)70212-4 - DOI - PubMed
    1. Brito-Zeron P, Baldini C, Bootsma H, Bowman SJ, Jonsson R, Mariette X, et al. . Sjogren Syndrome. Nat Rev Dis Primers (2016) 2:16047. 10.1038/nrdp.2016.47 - DOI - PubMed
    1. Manoussakis MN, Moutsopoulos HM. Sjogren’s Syndrome: Current Concepts. Adv Intern Med (2001) 47:191–217. - PubMed
    1. Thomas E, Hay EM, Hajeer A, Silman AJ. Sjogren’s Syndrome: A Community-Based Study of Prevalence and Impact. Br J Rheumatol (1998) 37(10):1069–76. 10.1093/rheumatology/37.10.1069 - DOI - PubMed
    1. Kassan SS, Moutsopoulos HM. Clinical Manifestations and Early Diagnosis of Sjogren Syndrome. Arch Intern Med (2004) 164(12):1275–84. 10.1001/archinte.164.12.1275 - DOI - PubMed

Publication types

MeSH terms