. 2021 Sep 1:8:690170.
doi: 10.3389/fmolb.2021.690170. eCollection 2021.

Therapeutic Effects of an Inhibitor of Thioredoxin Reductase on Liver Fibrosis by Inhibiting the Transforming Growth Factor-β1/Smads Pathway

Affiliations

Therapeutic Effects of an Inhibitor of Thioredoxin Reductase on Liver Fibrosis by Inhibiting the Transforming Growth Factor-β1/Smads Pathway

Wenxuan Jiao et al. Front Mol Biosci. .

Abstract

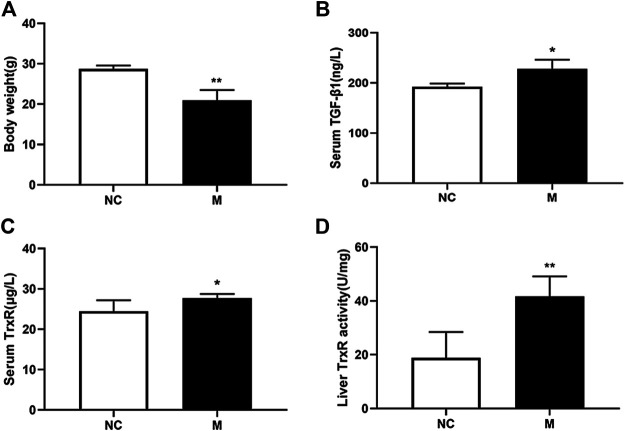
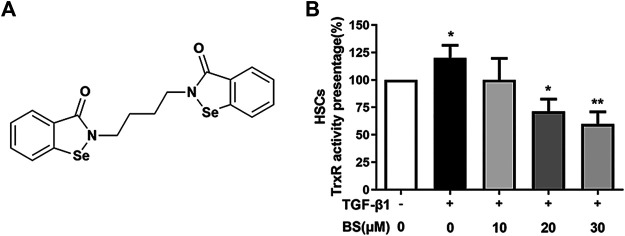
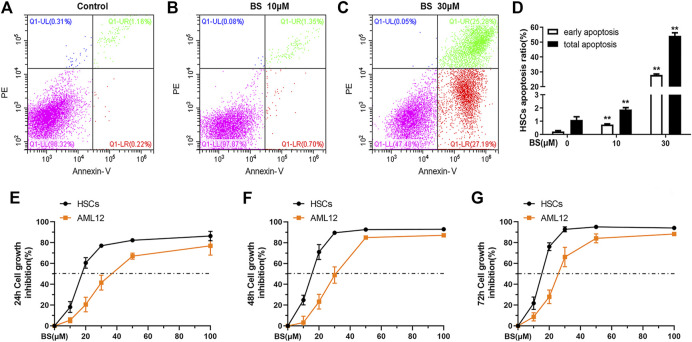
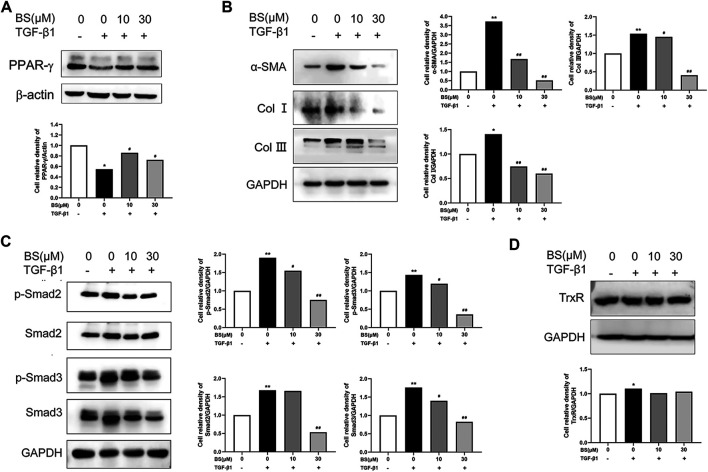
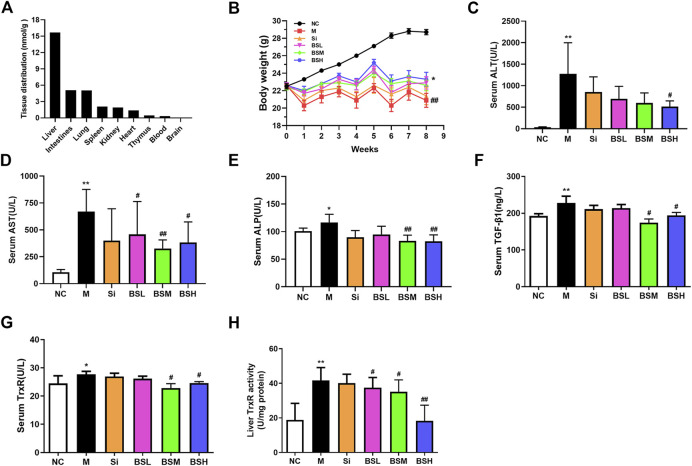
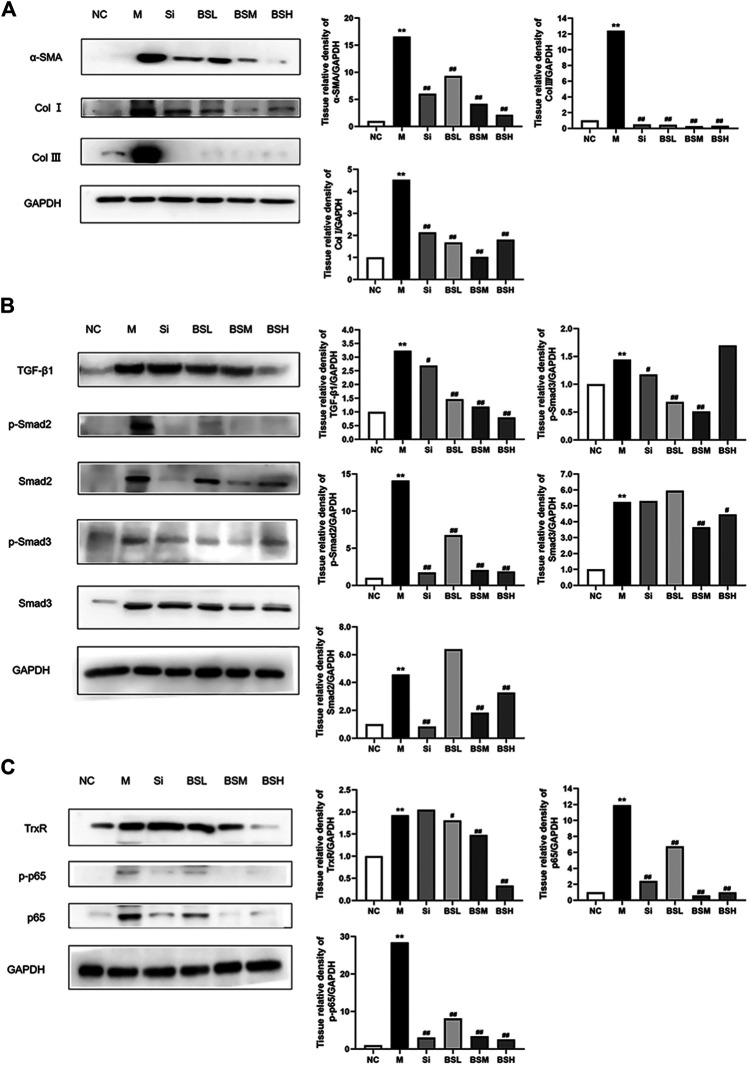
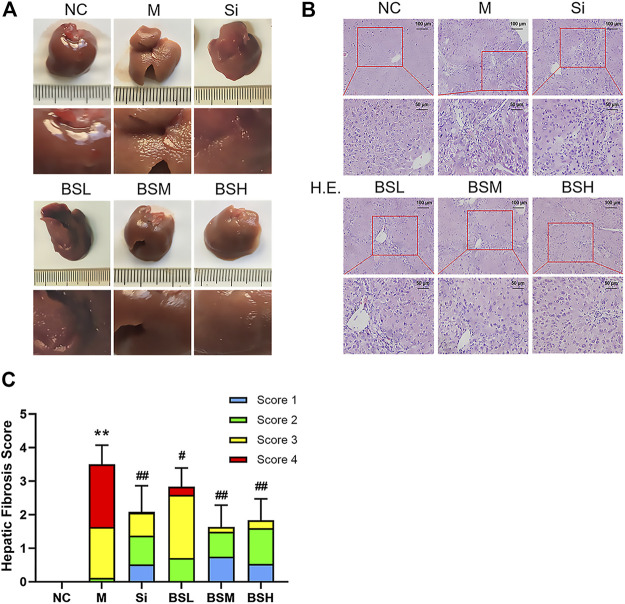
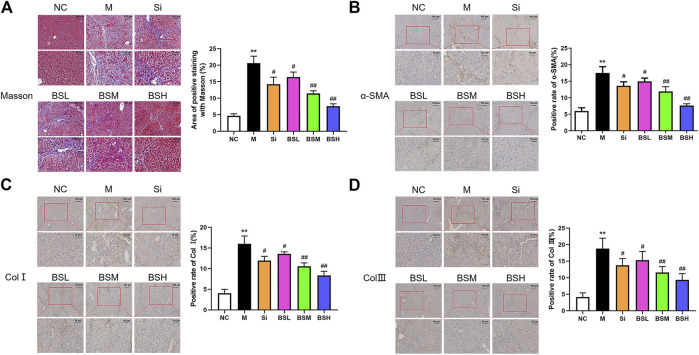
Liver fibrosis is an important stage in the progression of liver injury into cirrhosis or even liver cancer. Hepatic stellate cells (HSCs) are induced by transforming growth factor-β1 (TGF-β1) to produce α-smooth muscle actin (α-SMA) and collagens in liver fibrosis. Butaselen (BS), which was previously synthesized by our group, is an organic selenium compound that exerts antioxidant and tumor cell apoptosis-promoting effects by inhibiting the thioredoxin (Trx)/thioredoxin reductase (TrxR) system. The aim of this study was to investigate the potential effects of BS on liver fibrosis and explore the underlying molecular mechanisms of its action. Liver fibrosis models were established using male BALB/c mice through intraperitoneal injection of CCl4. BS was administered orally once daily at a dose of 36, 90, or 180 mg/kg. Silymarin (Si), which is a drug used for patients with nonalcoholic fatty liver disease and nonalcoholic steatohepatitis, was administered at a dose of 30 mg/kg per day as a control. The action mechanisms of BS against liver fibrosis progression were examined in HSCs. The study revealed that the activity and expression levels of TrxR were elevated in the mouse liver and serum after CCl4-induced liver fibrosis. Oral administration of BS relieved the pathological state of mice with liver fibrosis, showing significant therapeutic effects against liver fibrosis. Moreover, BS not only induced HSC apoptosis but also inhibited the production of α-SMA and collagens by HSCs by downregulating the TGF-β1 expression and blocking the TGF-β1/Smads pathway. The results of the study indicated that BS inhibited liver fibrosis by regulating the TGF-β1/Smads pathway.

Keywords: collagen; hepatic stellate cells; liver fibrosis; thioredoxin reductase; transforming growth factor-β1; α-SMA.


Conflict of interest statement

Author HY was employed by the company Shanghai Yuanxi Medicine Corp. The remaining authors declare that the research was conducted in the absence of any commercial or financial relationships that could be construed as a potential conflict of interest.

Figures

FIGURE 1
FIGURE 1
CCl4 affected the levels of body weights, TrxR, and TGF-β1 in mouse liver fibrosis models. (A) Body weights. (B, C) The levels of the liver and serum TrxR were analyzed by ELISA. (D) The level of serum TGF-β1 was analyzed by ELISA. Data were shown as mean ± SD, n ≥ 3 and analyzed with two-tailed Student’s t-test. *p < 0.05 and **p < 0.01 in the model group versus the control group.
FIGURE 2
FIGURE 2
BS decreased TrxR activity in activated HSCs. (A) Chemical structure of BS. (B) The TrxR activity was assessed in activated HSCs, and the cells were induced by 5 ng/ml TGF-β1. Data were shown as mean ± SD, n ≥ 3 and analyzed with the one-way ANOVA. *p < 0.05, TGF-β1 positive, and 0 μM BS group versus TGF-β1 negative, 0 μM BS group. *p < 0.05, **p < 0.01, TGF-β1 positive, 10–30 μM BS groups versus TGF-β1 positive, 0 μM BS group.
FIGURE 3
FIGURE 3
BS induced apoptosis of activated HSCs. (A–D) Annexin V-PI analysis and statistical analysis of early apoptosis and total apoptosis rates were presented after BS treatment for 24 h on HSCs. Cell inhibition curves were assessed by the SRB assay under different incubation time of BS on HSCs and AML12 (E: 24 h, F: 48 h, G: 72 h). HSCs were induced by 5 ng/ml TGF-β1. Data were shown as mean ± SD, n ≥ 3 and analyzed with the one-way ANOVA. **p < 0.01, 10–30 μM BS groups versus the 0 μM BS group.
FIGURE 4
FIGURE 4
BS inhibited the expressions of fibrosis-related proteins in vitro. HSCs were incubated with or without BS and 5 ng/ml TGF-β1. (A) The protein levels of PPAR-γ as measured by western blot analysis. (B) The protein expressions of α-SMA, Col Ⅰ, and Col III as measured by Western blot analysis. (C) The protein expressions of p-Smad2, Smad2, p-Smad3, and Smad3 as measured by Western blot analysis. (D) The protein expression of TrxR as measured by Western blot analysis. Data were shown as mean ± SD, n ≥ 3 and analyzed with the one-way ANOVA. *p < 0.05, **p < 0.01, TGF-β1 positive, 0 μM BS groups versus TGF-β1 negative, 0 μM BS groups. # p < 0.05, ## p < 0.01, TGF-β1 positive, 10–30 μM BS groups versus TGF-β1 positive, 0 μM BS groups.
FIGURE 5
FIGURE 5
BS ameliorated the biomarkers of CCl4-induced liver fibrosis in mice. (A) Tissue distributions of BS (180 mg/kg) for 21 days were analyzed. (B) Body weight changes. (C–E) Liver function was assessed by serum ALT, AST, and ALP. (F) Serum TGF-β1 levels. (G–H) The liver and serum TrxR levels were analyzed by ELISA. Data were shown as mean ± SD, n ≥ 3 and analyzed with the one-way ANOVA. *p < 0.05 and **p < 0.01 in the model group versus the control group. # p < 0.05, ## p < 0.01, Si, BSL, BSM, and BSH groups versus the model group.
FIGURE 6
FIGURE 6
BS inhibited the expressions of fibrosis-related proteins in vivo. (A) The protein levels of α-SMA, Col I, and Col III as measured by Western blot analysis. (B) The protein expressions of TGF-β1, p-Smad2, Smad2, p-Smad3, and Smad3 as measured by Western blot analysis. (C) The protein expressions of TrxR, NF-κB p-p65, and p65 as measured by Western blot analysis. Data were shown as mean ± SD, n ≥ 3 and analyzed with the one-way ANOVA. **p < 0.01 in the model group versus the control group. # p < 0.05, ## p < 0.01, Si, BSL, BSM, and BSH groups versus the model group.
FIGURE 7
FIGURE 7
BS improved the pathological characteristics in mouse liver fibrosis models. (A) The pathological changes of each group at the end of the experiment. (B) Representative liver sections of H&E staining; scale bars = 100 μm, 50 μm as indicated. (C) Hepatic fibrosis scores were counted and compared. Data were shown as mean ± SD, n ≥ 3 and analyzed with the one-way ANOVA. **p < 0.01 in the model group versus the control group. # p < 0.05, ## p < 0.01, Si, BSL, BSM, and BSH groups versus the model group.
FIGURE 8
FIGURE 8
BS ameliorated the fibrosis-related biomarkers in vivo. (A) Masson's staining was performed on the liver tissues of each group. Representative images were shown. The positive areas of Masson's staining were counted and compared. (B–D) Immunohistochemical analyses for α-SMA, Col I, or Col III were conducted on the liver tissues of each group. The positive areas of α-SMA, Col I, and Col III were counted and compared; scale bars = 100 μm, 50 μm as indicated. Data were shown as mean ± SD, n ≥ 3 and analyzed with the one-way ANOVA. **p < 0.01 in the model group versus the control group. # p < 0.05, ## p < 0.01, Si, BSL, BSM, and BSH groups versus the model group.

Similar articles

Cited by

References

    1. Bian M., Fan R., Zhao S., Liu W. (2019). Targeting the Thioredoxin System as a Strategy for Cancer Therapy. J. Med. Chem. 62 (16), 7309–7321. 10.1021/acs.jmedchem.8b01595 - DOI - PubMed
    1. Blaner W. S., O'Byrne S. M., Wongsiriroj N., Kluwe J., D'Ambrosio D. M., Jiang H., et al. (2009). Hepatic Stellate Cell Lipid Droplets: a Specialized Lipid Droplet for Retinoid Storage. Biochim. Biophys. Acta (Bba) - Mol. Cel Biol. Lipids 1791 (6), 467–473. 10.1016/j.bbalip.2008.11.001 - DOI - PMC - PubMed
    1. Brenner D. A. (2009). Molecular Pathogenesis of Liver Fibrosis. Trans. Am. Clin. Climatol Assoc. 120, 361–368. - PMC - PubMed
    1. Chasapis C. T., Makridakis M., Damdimopoulos A. E., Zoidakis J., Lygirou V., Mavroidis M., et al. (2019). Implications of the Mitochondrial Interactome of Mammalian Thioredoxin 2 for normal Cellular Function and Disease. Free Radic. Biol. Med. 137, 59–73. 10.1016/j.freeradbiomed.2019.04.018 - DOI - PubMed
    1. Chen B., Wang W., Shen T., Qi R. (2013). Thioredoxin1 Downregulates Oxidized Low-Density Lipoprotein-Induced Adhesion Molecule Expression via Smad3 Protein. PLoS One 8 (9), e76226. 10.1371/journal.pone.0076226 - DOI - PMC - PubMed

LinkOut - more resources