. 2021 Oct:40:101129.
doi: 10.1016/j.eclinm.2021.101129. Epub 2021 Sep 12.

Transmission, viral kinetics and clinical characteristics of the emergent SARS-CoV-2 Delta VOC in Guangzhou, China

Affiliations

Transmission, viral kinetics and clinical characteristics of the emergent SARS-CoV-2 Delta VOC in Guangzhou, China

Yaping Wang et al. EClinicalMedicine. 2021 Oct.

Abstract

Background: A novel variant of SARS-CoV-2, the Delta variant of concern (VOC, also known as lineage B.1.617.2), is fast becoming the dominant strain globally. We reported the epidemiological, viral, and clinical characteristics of hospitalized patients infected with the Delta VOC during the local outbreak in Guangzhou, China.

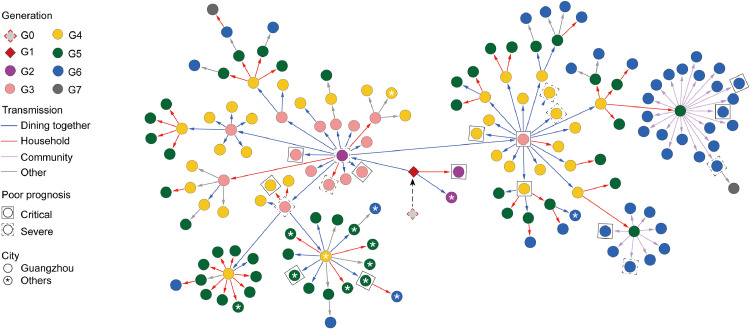
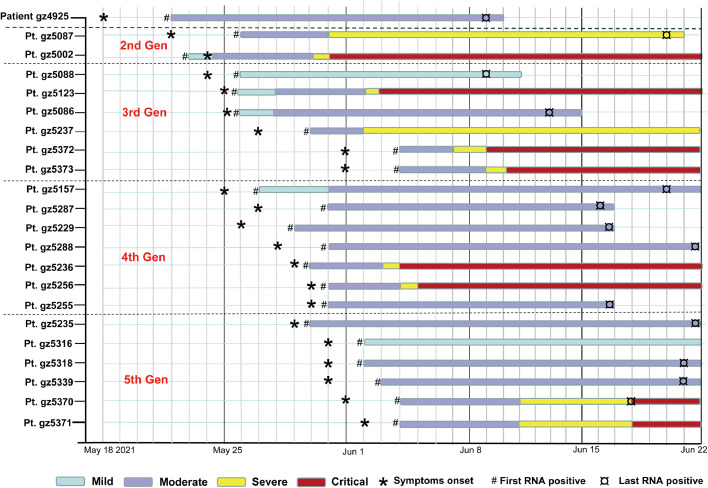
Methods: We extracted the epidemiological and clinical information pertaining to the 159 cases infected with the Delta VOC across seven transmission generations between May 21 and June 18, 2021. The whole chain of the Delta VOC transmission was described. Kinetics of viral load and clinical characteristics were compared with a cohort of wild-type infection in 2020 admitted to the Guangzhou Eighth People's Hospital.

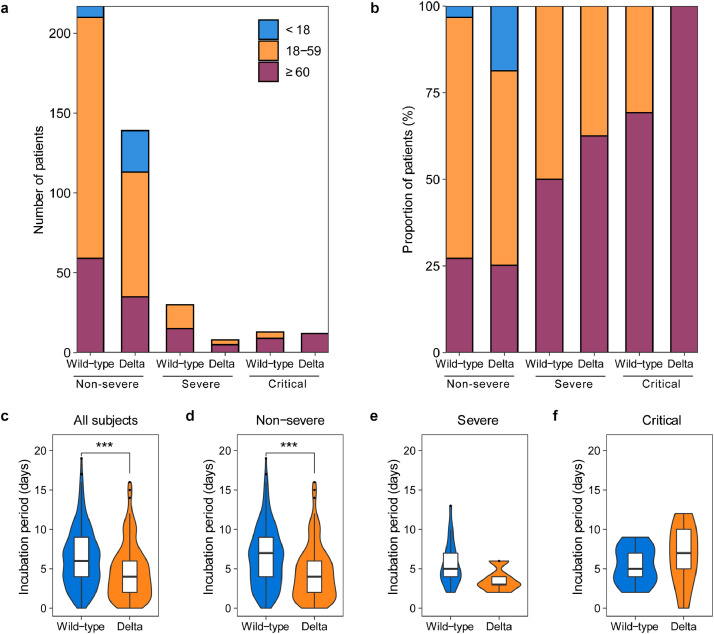
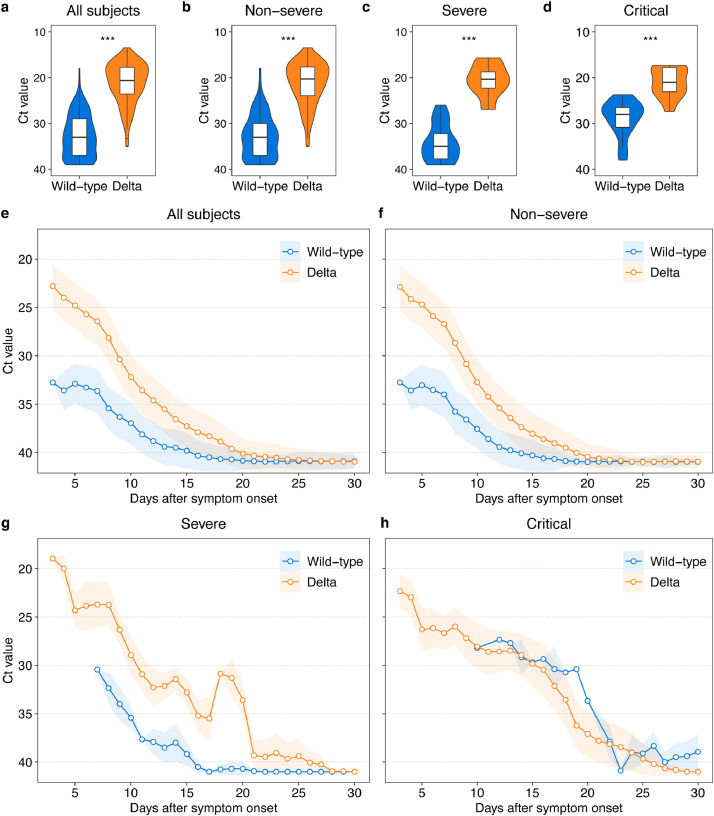
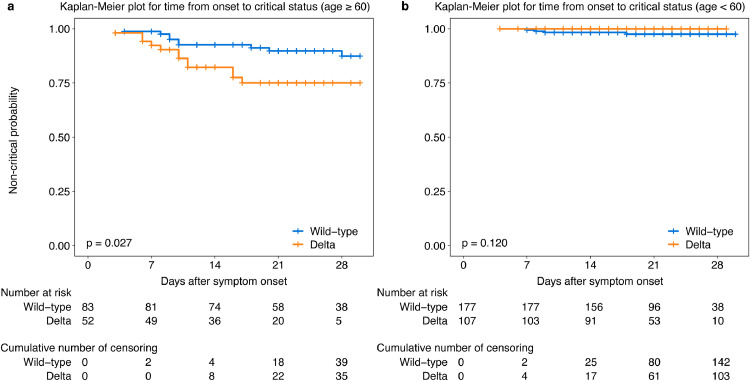
Findings: There were four transmission generations within the first ten days. The Delta VOC yielded a significantly shorter incubation period (4.0 vs. 6.0 days), higher viral load (20.6 vs. 34.0, cycle threshold of the ORF1a/b gene), and a longer duration of viral shedding in pharyngeal swab samples (14.0 vs. 8.0 days) compared with the wild-type strain. In cases with critical illness, the proportion of patients over the age of 60 was higher in the Delta VOC group than in the wild-type strain (100.0% vs. 69.2%, p = 0.03). The Delta VOC had a higher risk than wild-type infection in deterioration to critical status (hazards ratio 2.98 [95%CI 1.29-6.86]; p = 0.01).

Interpretation: Infection with the Delta VOC is characterized by markedly increased transmissibility, viral loads and risk of disease progression compared with the wild-type strain, calling for more intensive prevention and control measures to contain future outbreaks.

Funding: National Grand Program, National Natural Science Foundation of China, Guangdong Provincial Department of Science and Technology, Guangzhou Laboratory.

Keywords: COVID-19; Delta variant; Risk factor; Transmission.


Conflict of interest statement

We declare no competing interests.

Figures

Fig 1
Fig. 1
Epidemiological transmission network of SARS-CoV-2 Delta VOC transmission in Guangzhou. One hundred and fifty-seven infected patients with a clear transmission chain were shown in the network. Each transmission generation is shown in rhombus or circles with different colors. The first-generation patient (rhombus with black solid line, G1) is in the middle. G1 was phylogenetically linked to an imported case (rhombus with red dotted line, G0). Colored arrows indicate different transmission routes. The transmission includes dining together, household, community (chat, encounter, taking the elevator together) and others (work and social contacts). Severe (dotted line) and critical (solid line) patients were labelled with squared shapes. Asterisks indicate patients in or to other cities (For interpretation of the references to color in this figure legend, the reader is referred to the web version of this article.).
Fig 2
Fig. 2
Representative individuals from first to fifth generation. Patient (Pt.) numbers were list to the left. Generations (1st,2nd,3rd 4th,5th Gen) were shown. Timeline of patient clinical symptoms (Mild, Moderate, Severe and Critical) was shown. First symptom (‘*’) indicates the first time point the individual reported illness. First positive (‘#’) and last positive (‘¤’) represent for the first and last time points of viral RNA positive, respectively.
Fig 3
Fig. 3
Age groups and incubation period across severity of illness of patients infected with SARS-CoV-2 wild-type or Delta VOC. Top panel shows absolute counts (a) and proportion (b) of patients in three age groups, including < 18 years, 18–59 years and ≥ 60 years. Bottom panel of the box/violin plot shows the difference of the incubation period between wild-type (Dark blue) and Delta VOC (Earth yellow) across all subjects (c), non-severe (d), severe (e) and critical (f) patients, calculated by the Wilcoxon Test, ***: p < 0.001. In the box plot, the boundary of the box closest to zero indicates the 25th percentile, a black line within the box marks the median, and the boundary of the box farthest from zero indicates the 75th percentile. Whiskers below and above the box indicate the smallest and largest value no further than 1.5 * IQR (inter-quartile range) from 25th percentile or 75th percentile, respectively (For interpretation of the references to color in this figure legend, the reader is referred to the web version of this article.).
Fig 4
Fig. 4
The highest and dynamics of viral load among hospitalized COVID-19 patients infected with SARS-CoV-2 wild-type or Delta VOC. Box/violin plot shows Ct values at highest viral load during hospitalization with their significance compared between wild-type or Delta VOC-infected patients in total (a), non-severe (b), severe (c) and critical (d) patients. In the box plot, the boundary of the box closest to zero indicates the 25th percentile, a black line within the box marks the median, and the boundary of the box farthest from zero indicates the 75th percentile. Whiskers below and above the box indicate the largest and smallest value no further than 1.5 * IQR (inter-quartile range) from 75th percentile or 25th percentile, respectively. To show the dynamics of Ct values of patients infected with wild-type or Delta VOC, arithmetic mean (circle point) and standard error (colored range) is firstly calculated for each individual day, then a moving average of three consecutive days is computed for all subjects (e) and patients with different severity of illness (f–h). The viral load was presented by Ct Value of ORF1a/b gene. P values less than 0.001 is calculated by the Wilcoxon Test and shown as three asterisks (***). Refer to appendix (p3) for patterns of Ct values of N gene (For interpretation of the references to color in this figure legend, the reader is referred to the web version of this article.).
Fig 5
Fig. 5
Kaplan-Meier survival plots for the prognostic factors. The figure displays the Kaplan-Meier plot of time from symptom onset to critical status categorized by virus lineage (Delta VOC vs wild-type) in patients ≥ 60 (a) and < 60 years (b).

References

    1. Update on SARS-CoV-2 variant nomenclature, https://www.who.int/publications/m/item/update-60-sars-cov-2-nomenclatur...
    1. https://www.who.int/director-general/speeches/detail/who-director-genera... 19-2-july- 2021.
    1. https://www.gisaid.org/hcov19-variants/. Accessed on July 28, 2021.
    1. Campbell F., Archer B., Laurenson-Schafer H. Increased transmissibility and global spread of SARS-CoV-2 variants of concern as at June 2021. Euro Surveill. 2021;26 - PMC - PubMed
    1. Sheikh A., McMenamin J., Taylor B., Robertson C. SARS-CoV-2 delta VOC in Scotland: demographics, risk of hospital admission, and vaccine effectiveness. Lancet. 2021;397:2461–2462. - PMC - PubMed