. 2021 Sep 16;3(3):lqab082.
doi: 10.1093/nargab/lqab082. eCollection 2021 Sep.

Allele-specific assembly of a eukaryotic genome corrects apparent frameshifts and reveals a lack of nonsense-mediated mRNA decay

Affiliations

Allele-specific assembly of a eukaryotic genome corrects apparent frameshifts and reveals a lack of nonsense-mediated mRNA decay

Raúl O Cosentino et al. NAR Genom Bioinform. .

Abstract

To date, most reference genomes represent a mosaic consensus sequence in which the homologous chromosomes are collapsed into one sequence. This approach produces sequence artefacts and impedes analyses of allele-specific mechanisms. Here, we report an allele-specific genome assembly of the diploid parasite Trypanosoma brucei and reveal allelic variants affecting gene expression. Using long-read sequencing and chromosome conformation capture data, we could assign 99.5% of all heterozygote variants to a specific homologous chromosome and build a 66 Mb long allele-specific genome assembly. The phasing of haplotypes allowed us to resolve hundreds of artefacts present in the previous mosaic consensus assembly. In addition, it revealed allelic recombination events, visible as regions of low allelic heterozygosity, enabling the lineage tracing of T. brucei isolates. Interestingly, analyses of transcriptome and translatome data of genes with allele-specific premature termination codons point to the absence of a nonsense-mediated decay mechanism in trypanosomes. Taken together, this study delivers a reference quality allele-specific genome assembly of T. brucei and demonstrates the importance of such assemblies for the study of gene expression control. We expect the new genome assembly will increase the awareness of allele-specific phenomena and provide a platform to investigate them.


Figures

Figure 1.
Figure 1.
Haplotype phasing procedure. Short-read error-corrected PacBio reads were used to identify variants and correct errors in the T. brucei Lister 427 Tb427v9 genome assembly. The green, orange, violet and blue blocks on the read and assembly representations indicate the presence of different sequences on variant loci. Then, the distribution of heterozygous variants along the genome and the ploidy of T. brucei Lister 427 clones were analysed. Finally, Hi-C data and raw PacBio reads were used to link variants and reconstruct the haplotypes of the homologous chromosomes.
Figure 2.
Figure 2.
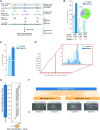
Genome error correction. (A) Error-correction approach. (B) Number of variants identified before (Tb427v9) and after error correction (Tb427v10) of the genome, grouped by variant genotype. The pie chart shows the proportion of SNPs, complex and INDELs among the error-suggesting variants (the sum of ‘Alt1/Alt1’ + ‘Alt1/Alt2’ variants) in Tb427v9. (C) Number of protein-coding genes annotated. (D) Size ratio distribution (log2 scale) of protein-coding genes compared to the T. brucei TREU927 genome assembly. The right panel is a zoom-in to the region selected in red. (E) Alignment dot plot between syntenic orthologs in Tb427v10 (Tb427_070027900) and T. brucei TREU927 (Tb927.7.2330), showing a large repeat-array length difference, illustrated by the number of blue and orange boxes in the gene representations on the axes. (F) Alignment of Tb427_020030800 from Tb427v10 to two contiguous protein-coding genes annotated in the T. brucei TREU927 genome assembly (Tb927.2.5860 and Tb927.2.5870), suggesting the gene was wrongly split in the latter assembly. The lower panel shows the subcellular localization (in green) of the N- and C-terminal tagged versions of Tb927.2.5860 and Tb927.2.5870 (data provided by TrypTag.org).
Figure 3.
Figure 3.
Variant density and LOH regions in the T. brucei Lister 427 genome. (A–E) Heterozygosity from different T. brucei Lister 427 sequencing datasets on selected chromosomal regions of the Tb427v10 genome assembly. In the background, a filled histogram (grey) represents ‘mappability’ (in range 0–100) for short-read sequencing data (see the ‘Materials and Methods’ section). LOH regions are indicated by a black line above the plot. The lower panel shows the location and coding strand of protein-coding genes (grey), pseudogenes (yellow), VSG genes (red) and rRNA genes (green) as vertical lines, and zoom-out representation of the complete chromosome when a smaller region was selected.
Figure 4.
Figure 4.
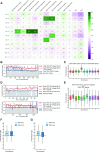
The effect of aneuploidy on gene expression in T. brucei. (A) Median coverage per chromosome for different T. brucei DNA-seq datasets, normalized to genome median and centred at two (to illustrate expected diploidy). In the labels, ‘Tb427’ indicates a Lister 427-derived clone, ‘Tb927’ a TREU927-derived clone, ‘Tbr’ T. brucei rhodesiense and ‘Tbg’ T. brucei gambiense. (B) Normalized coverage density in chromosome 5 for Tb427 BSF WT (Siegel 2014) clone (dark red line) and its median (straight light red line) compared to Tb427 BSF PN221 PacBio clone (dark blue line). The genome median is set to 1 (straight black line). Mappability is shown as a grey filled line (in range 0–1). (C) RNA-seq fold change (log2) pooled by chromosome, from a T. brucei Lister 427 clone triploid for chromosome 5 over a diploid T. brucei Lister 427 clone. (D) Normalized coverage density in chromosome 2 (upper panel) and chromosome 7 (lower panel) for Tb427 PCF WT (Siegel 2013) clone (dark red line) and its median (straight light red line) compared to Tb427 PCF WT (Cross 2010) clone (dark blue line). The genome median is set to 1 (straight black line). Mappability (in range 0–1) is indicated in grey. (E) RNA-seq fold change (log2) pooled by chromosome, from a T. brucei Lister 427 PCF triploid for chromosomes 2 and 7 over a diploid T. brucei TREU927 clone. (F, G) RNA-seq and Ribo-seq fold change (log2) between the same clones as (e), for chromosomes 2 and 7, respectively.
Figure 5.
Figure 5.
Fully phased T. brucei Lister 427 genome. Both alleles are plotted for each chromosome. Protein-coding genes (grey), pseudogenes (yellow), VSG genes (red) and rRNA genes (green) are indicated by vertical lines on top or bottom (depending on the coding strand) of the black lines representing the chromosomal sequence. Variant density is indicated with a blue histogram on top of each chromosomal ‘core’ region. INDELs (>10 bp) are indicated by dark grey lines between the ‘cores’.
Figure 6.
Figure 6.
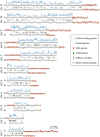
Allele-specific transcript and translation levels in genes with allele-specific PTCs. (A, B) Examples of genes with allele-specific variants leading to a PTC. In the upper panels, the thin pink and blue horizontal lines represent the sequence of the two alleles, while the thicker line on top indicates the ORFs. Variant positions are indicated by black vertical lines and numbered. An asterisk indicates the position of a frameshifting INDEL variant. In green and red vertical lines, start and stop codons are indicated, respectively. The middle panels show RNA-seq and Ribo-seq reads per million counts for both alleles in each of the variant positions. The lower panels show the expected protein size for each allele. Yellow boxes indicate InterPro domains and violet boxes signal peptides.

References

    1. Bertelli C., Greub G. Rapid bacterial genome sequencing: methods and applications in clinical microbiology. Clin. Microbiol. Infect. 2013; 19:803–813. - PubMed
    1. Gordon D., Huddleston J., Chaisson M.J.P., Hill C.M., Kronenberg Z.N., Munson K.M., Malig M., Raja A., Fiddes I., Hillier L.W. et al. . Long-read sequence assembly of the gorilla genome. Science. 2016; 352:6281. - PMC - PubMed
    1. Jain M., Fiddes I.T., Miga K.H., Olsen H.E., Paten B., Akeson M. Improved data analysis for the MinION nanopore sequencer. Nat. Methods. 2015; 12:351–356. - PMC - PubMed
    1. Kaplan N., Dekker J. High-throughput genome scaffolding from in vivo DNA interaction frequency. Nat. Biotechnol. 2013; 31:1143–1147. - PMC - PubMed
    1. Dudchenko O., Batra S.S., Omer A.D., Nyquist S.K., Hoeger M., Durand N.C., Shamim M.S., Machol I., Lander E.S., Aiden A.P., Aiden E.L. De novo assembly of the Aedes aegypti genome using Hi-C yields chromosome-length scaffolds. Science. 2017; 356:92–95. - PMC - PubMed