

A snapshot of a pandemic: The interplay between social isolation and COVID-19 dynamics in Brazil
- PMID: 34541563
- PMCID: PMC8442254
- DOI: 10.1016/j.patter.2021.100349
A snapshot of a pandemic: The interplay between social isolation and COVID-19 dynamics in Brazil
Abstract
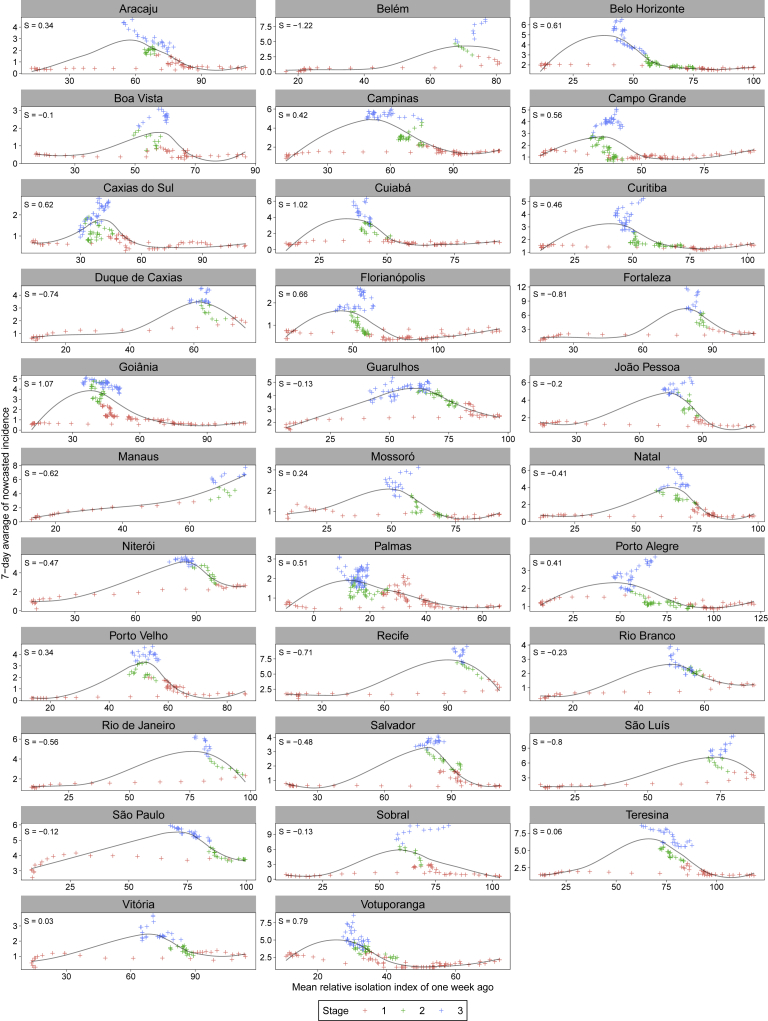
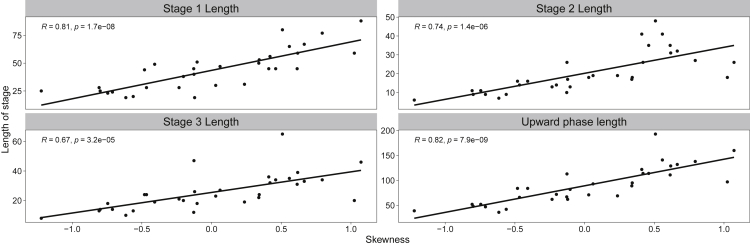
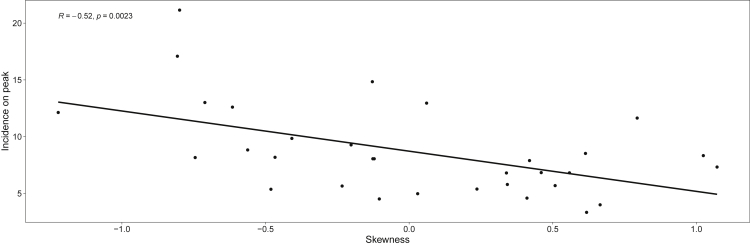
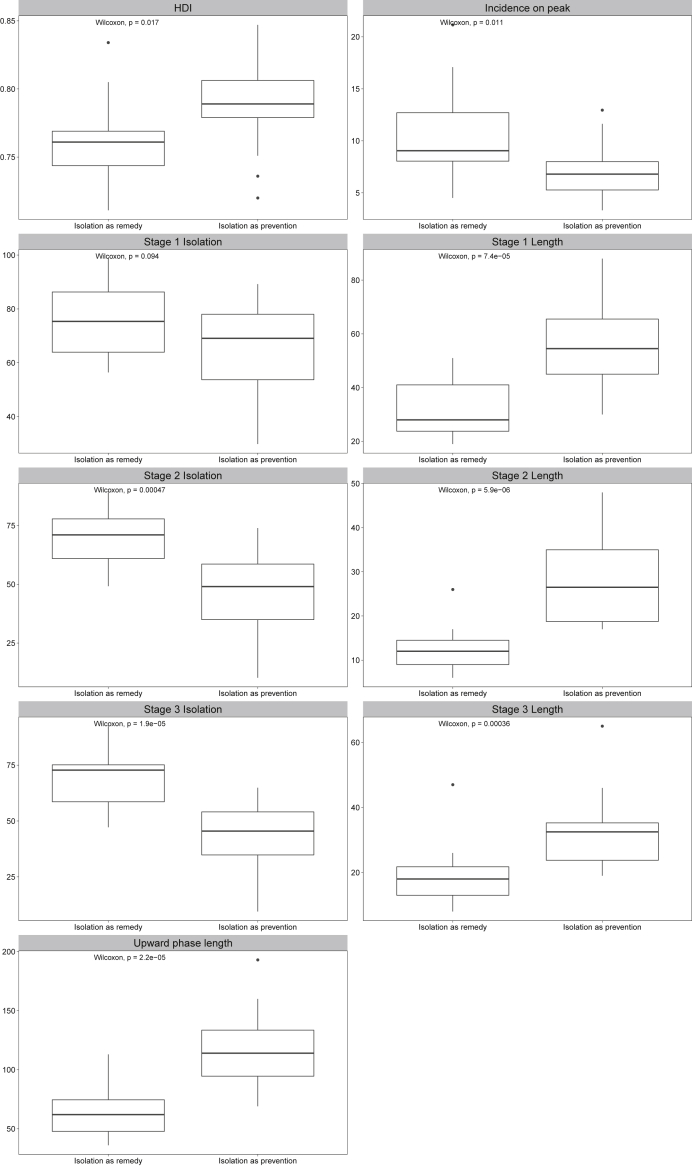
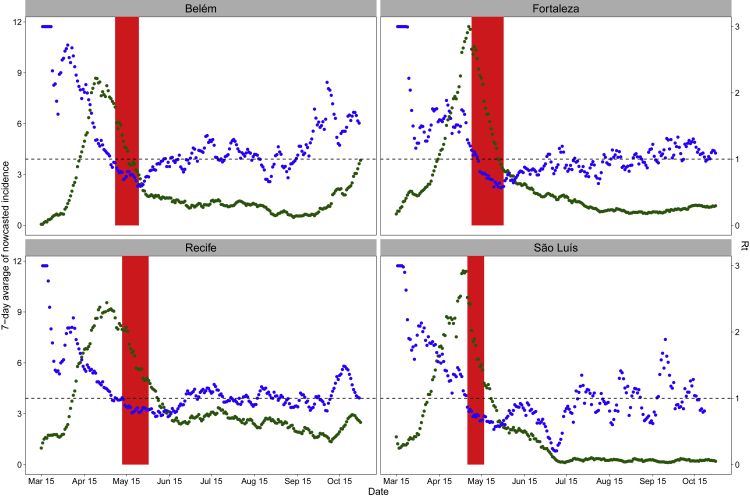
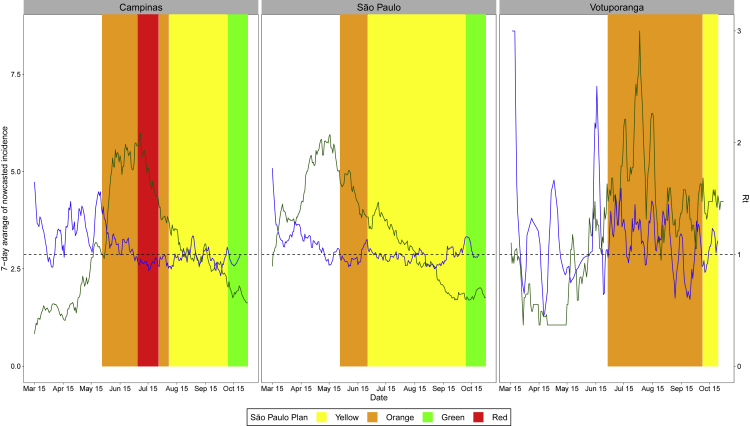
In response to the coronavirus pandemic, governments implemented social distancing, attempting to block the virus spread within territories. While it is well accepted that social isolation plays a role in epidemic control, the precise connections between mobility data indicators and epidemic dynamics are still a challenge. In this work, we investigate the dependency between a social isolation index and epidemiological metrics for several Brazilian cities. Classic statistical methods are employed to support the findings. As a first, initially surprising, result, we illustrate how there seems to be no apparent functional relationship between social isolation data and later effects on disease incidence. However, further investigations identified two regimes of successful employment of social isolation: as a preventive measure or as a remedy, albeit remedy measures require greater social isolation and bring higher burden to health systems. Additionally, we exhibit cases of successful strategies involving lockdowns and an indicator-based mobility restriction plan.
Keywords: COVID-19; human mobility; mobile geolocation; social isolation; spatial-temporal patterns.
© 2021 The Authors.
Conflict of interest statement
The authors declare no competing interests.
Figures
Similar articles
-
Social distancing and living conditions in the pandemic COVID-19 in Salvador-Bahia, Brazil.Cien Saude Colet. 2020 Sep;25(9):3385-3392. doi: 10.1590/1413-81232020259.22142020. Epub 2020 Aug 28. Cien Saude Colet. 2020. PMID: 32876242 English, Portuguese.
-
Human choice to self-isolate in the face of the COVID-19 pandemic: A game dynamic modelling approach.J Theor Biol. 2021 Jul 21;521:110692. doi: 10.1016/j.jtbi.2021.110692. Epub 2021 Mar 23. J Theor Biol. 2021. PMID: 33771612 Free PMC article.
-
Social distancing measures to control the COVID-19 pandemic: potential impacts and challenges in Brazil.Cien Saude Colet. 2020 Jun;25(suppl 1):2423-2446. doi: 10.1590/1413-81232020256.1.10502020. Epub 2020 Apr 22. Cien Saude Colet. 2020. PMID: 32520287 Review. English, Portuguese.
-
Quantifying the Effects of Social Distancing on the Spread of COVID-19.Int J Environ Res Public Health. 2021 May 23;18(11):5566. doi: 10.3390/ijerph18115566. Int J Environ Res Public Health. 2021. PMID: 34071047 Free PMC article.
-
Evidence compendium and advice on social distancing and other related measures for response to an influenza pandemic.Paediatr Respir Rev. 2015 Mar;16(2):119-26. doi: 10.1016/j.prrv.2014.01.003. Epub 2014 Jan 31. Paediatr Respir Rev. 2015. PMID: 24630149 Review.
Cited by
-
Re-emergence of Gamma-like-II and emergence of Gamma-S:E661D SARS-CoV-2 lineages in the south of Brazil after the 2021 outbreak.Virol J. 2021 Nov 17;18(1):222. doi: 10.1186/s12985-021-01690-1. Virol J. 2021. PMID: 34789293 Free PMC article.
-
A multi-scale unified model of human mobility in urban agglomerations.Patterns (N Y). 2023 Oct 17;4(11):100862. doi: 10.1016/j.patter.2023.100862. eCollection 2023 Nov 10. Patterns (N Y). 2023. PMID: 38035194 Free PMC article.
-
Impact of network centrality and income on slowing infection spread after outbreaks.Appl Netw Sci. 2023;8(1):16. doi: 10.1007/s41109-023-00540-z. Epub 2023 Feb 24. Appl Netw Sci. 2023. PMID: 36855413 Free PMC article.
-
Effectiveness of social distancing measures and lockdowns for reducing transmission of COVID-19 in non-healthcare, community-based settings.Philos Trans A Math Phys Eng Sci. 2023 Oct 9;381(2257):20230132. doi: 10.1098/rsta.2023.0132. Epub 2023 Aug 23. Philos Trans A Math Phys Eng Sci. 2023. PMID: 37611629 Free PMC article.
-
Spatiotemporal dynamics of epidemiology diseases: mobility based risk and short-term prediction modeling of COVID-19.Front Public Health. 2024 Jul 3;12:1359167. doi: 10.3389/fpubh.2024.1359167. eCollection 2024. Front Public Health. 2024. PMID: 39022425 Free PMC article.
References
-
- World Health Organization, J Advice on the use of masks in the context of COVID-19: interim guidance. 2020. https://apps.who.int/iris/handle/10665/332293.CCBY-NC-SA3.0IGO
-
- Apple Covid-19 mobility trends reports. 2021. https://covid19.apple.com/mobility
-
- Google Google COVID-19 community mobility reports. 2021. https://www.google.com/covid19/mobility/
-
- Inloco Mapa brasileiro da COVID-19. 2021. https://mapabrasileirodacovid.inloco.com.br/
LinkOut - more resources
Full Text Sources
Research Materials
