. 2021 Jan-Dec;13(1):1973836.
doi: 10.1080/19490976.2021.1973836.

SPI2 T3SS effectors facilitate enterocyte apical to basolateral transmigration of Salmonella-containing vacuoles in vivo

Affiliations

SPI2 T3SS effectors facilitate enterocyte apical to basolateral transmigration of Salmonella-containing vacuoles in vivo

Marcus Fulde et al. Gut Microbes. 2021 Jan-Dec.

Abstract

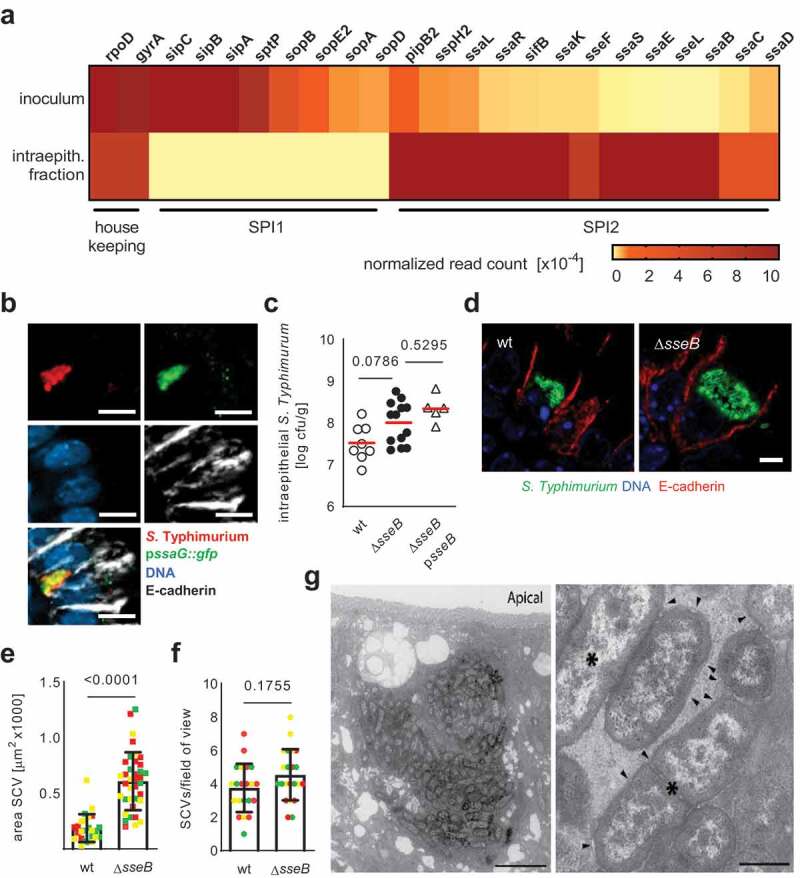
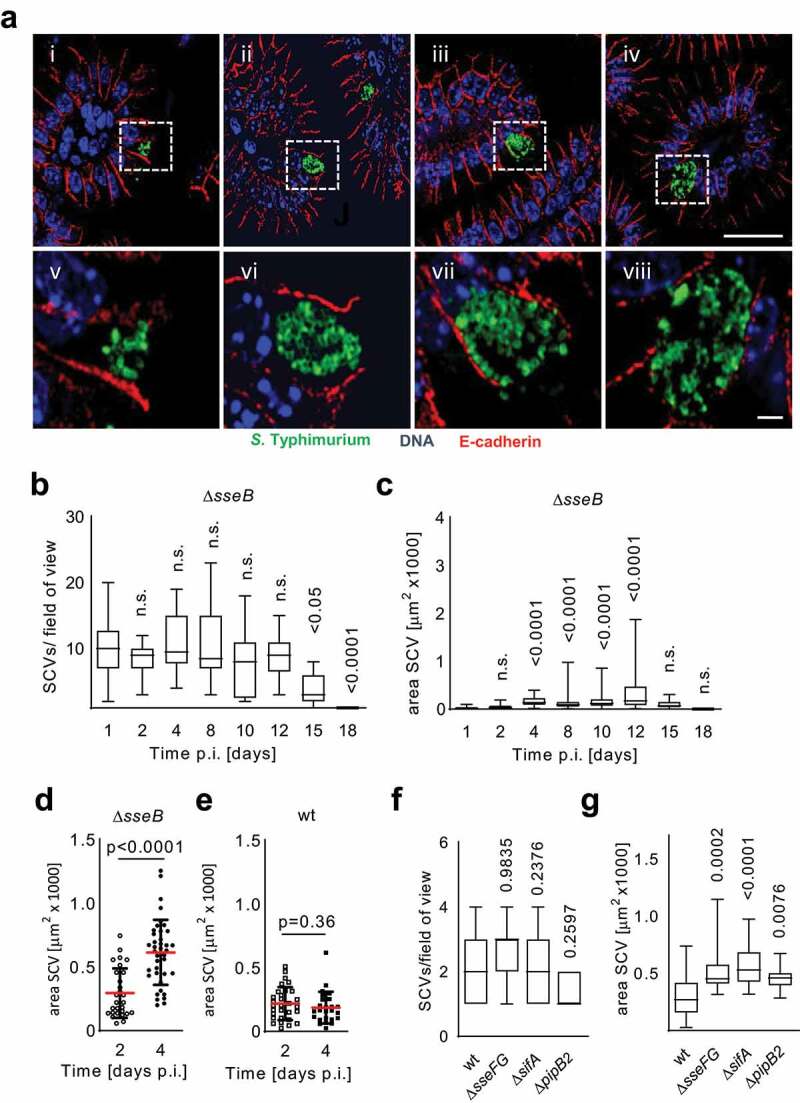
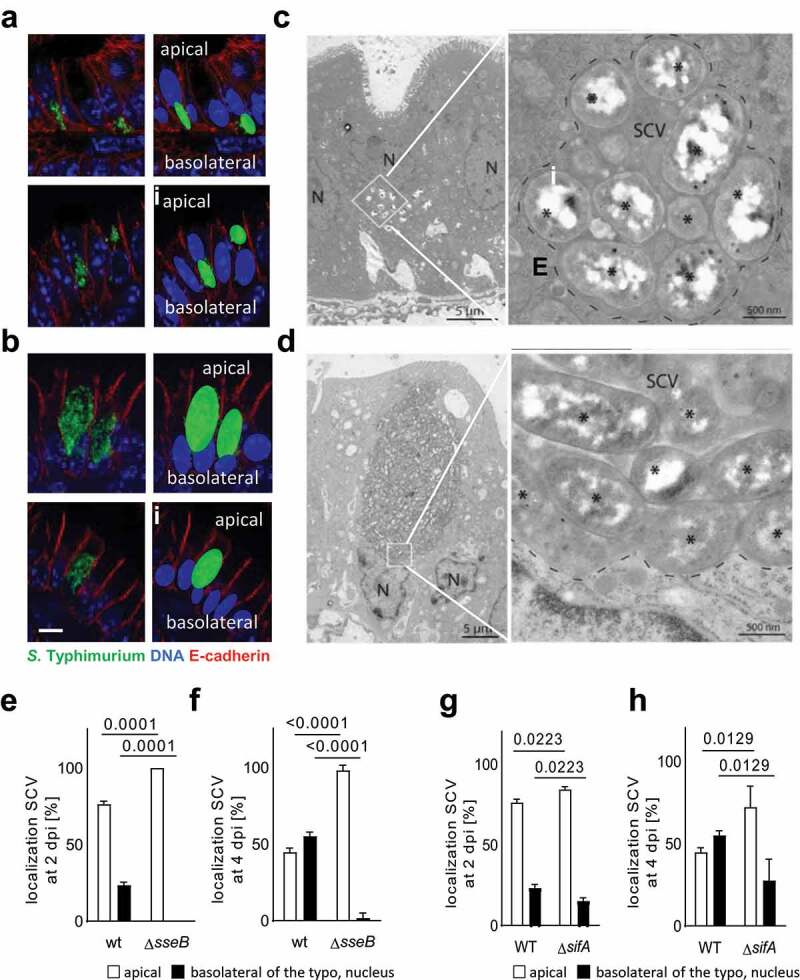
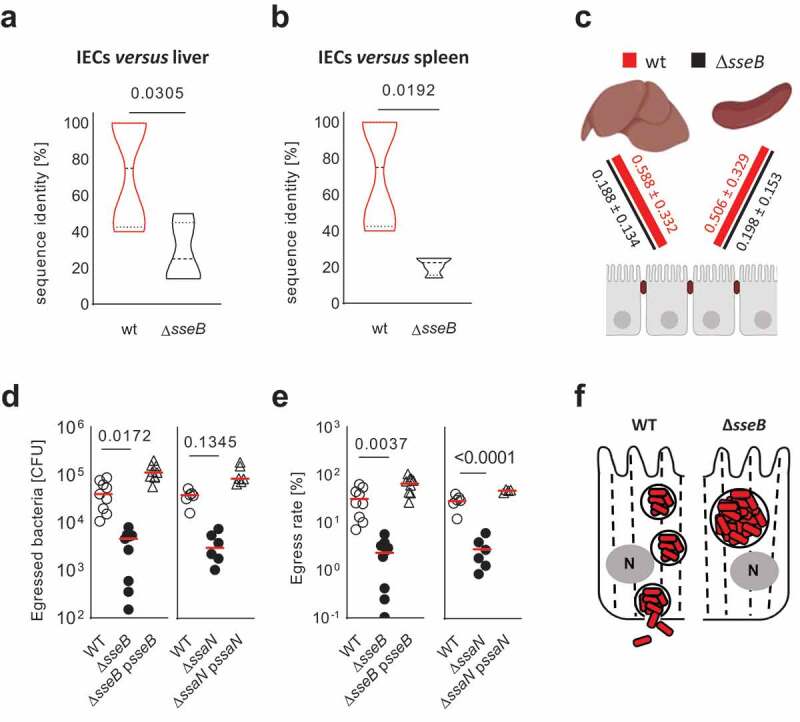
Salmonella pathogenicity island (SPI) 2 type three secretion system (T3SS)-mediated effector molecules facilitate bacterial survival in phagocytes but their role in the intestinal epithelium in vivo remains ill-defined. Using our neonatal murine infection model in combination with SPI2 reporter technology and RNA-Seq of sorted primary enterocytes, we demonstrate expression of SPI2 effector molecules by intraepithelial Salmonella Typhimurium (S. Typhimurium). Contrary to expectation, immunostaining revealed that infection with SPI2 T3SS-mutants resulted in significantly enlarged intraepithelial Salmonella-containing vacuoles (SCV) with altered cellular positioning, suggesting impaired apical to basolateral transmigration. Also, infection with isogenic tagged S. Typhimurium strains revealed a reduced spread of intraepithelial SPI2 T3SS mutant S. Typhimurium to systemic body sites. These results suggest that SPI2 T3SS effector molecules contribute to enterocyte apical to basolateral transmigration of the SCV during the early stage of the infection.

Keywords: Salmonella; Salmonella pathogenicity island 2 (Spi-2); apical to basolateral transmigration; enterocyte; mucosal translocation.


Conflict of interest statement

The authors declare no competing interests.

Figures

Figure 1.
Figure 1.
Formation of enlarged not smaller SCVs by SPI2 mutant S. Typhimurium. (a) normalized sequence read counts (number of reads mapped to a gene divided by the total number of bacterial reads in that library) for selected SPI1 and SPI2 associated genes obtained by RNA Seq analysis of the inoculum and RNA isolated from FACS-sorted S. Typhimurium-positive intestinal epithelial cells at 4 days p.i. with wt S. Typhimurium (for details see Experimental Procedures). (b) Immunofluorescence imaging of wt S. Typhimurium (red) carrying a SsaG-GFP reporter plasmid (green). counterstaining with DNA (blue) and E-cadherin (white). A representative image is shown. Bar, 5 µm. (c) The bacterial load in isolated small intestinal epithelial cells was analyzed by serial dilution and plating at day 4 p.i. with wt, ΔsseB SPI2 T3SS mutant or ΔsseB psseB complemented S. Typhimurium. ANOVA with Bonferroni´s multiple post test; results from n = 6 (wt), n = 11 (ΔsseB) or n = 5 (ΔsseB psseB) individual animals from one (wt and ΔsseB psseB) or two (ΔsseB) litters. Shown are individual data points plus mean. P-values are indicated. (d) Immunostaining for wt and ΔsseB S. Typhimurium in small intestinal tissue sections of mice 4 days p.i. A representative image is shown. Bar, 5 µm. counterstaining with DNA (blue) and E-cadherin (red). Quantification of the size (e) and number (f) of SCVs. One data point represents one SCV (E) or one field of view (F). At least 40 SCVs or 20 fields of view from 3 different animals indicated by individual colors were analyzed. Student’s t-test. Box plots show median, quartiles and extremes. P-values are indicated. (g) Transmission electron microscopy of infected small intestinal epithelial cells 4 days p.i. with ΔsseB S. Typhimurium. Bar, 5 µm (left panel) and 500 nm (right panel). Arrowheads indicate the limiting membrane of the SCV that tightly surrounds bacteria. Asterisks label proliferating bacteria as suggested by the presence of a septum
Figure 2.
Figure 2.
SPI2 mutant S. Typhimurium SCVs continuously increase in size during the course of infection. (a-c) continuous growth of SPI2 T3SS mutant SCVs. One-day old mice were orally infected with 102 CFU ∆sseB S. Typhimurium. (a) small intestinal tissue sections were examined by immunofluorescence at 2 (i), 4 (ii), 8 (iii) and 12 (iv) days p.i. Representative images at 2, 4, 8 and 12 days p.i. (i–iv, bar, 25 µm), and enlarged views (v–viii, bar, 2.5 µm) are shown. (b and c) Small intestinal tissue sections evaluated at 1, 2, 4, 8, 10, 12, 15 and 18 days p.i. for the number (b) and size (c) of SCVs. One data point represents one field of view (B) or one SCV (C). At least 40 SCVs or 20 fields of view from 2 (day 1, 2, 8, 12, 15, 18) or 3 (day 4, 10) different from each one litter were analyzed. Significance was calculated with ordinary one-way ANOVA and Dunnett’s multiple comparison test. The indicated p values compare each time point to day 1 p.i. box and whiskers blots with median, lower and upper quartile and range are shown. P-values are indicated; n.s., not significant. (d and e) One-day-old mice were orally infected with ∆sseB (d) or wt (e) S. Typhimurium and small intestinal tissue sections were examined at day 2 and 4 p.i. by immunofluorescence for the size of SCVs. one data point represents one SCV. The SCV size was determined in at least 40 fields of view in tissue sections from each 3 individual animals from one litter per time point. significance was calculated with the Student’s t-test. Mean and SD are shown. P-values are indicated. (f and g) 1-day-old mice were orally infected with 104 WT or isogenic ΔsseFG, ΔpipB2 or ΔsifA mutants. SCV number (f) and SCV size (g) in intestinal epithelial cells was analyzed at 2 days p.i. At least 30 fields of view (F) or 30 SCVs (G) from 2 (wt, ΔsseFG, ΔsifA) or 3 (ΔpipB2) different animals from each one litter were analyzed. box and whiskers blots with median, lower and upper quartile and range are shown. Significance was tested using ANOVA and Bonferroni’s multiple posttest; the indicated p-values refer to each mutant in comparison to wt S. Typhimurium
Figure 3.
Figure 3.
Altered positioning SPI2 mutant S. Typhimurium SCVs in enterocytes. (a-f) intraepithelial SCV positioning at 4 days p.i. with wt (a and c) or ΔsseB S. Typhimurium (green) (b and d) by immunofluorescence (a and b) or transmission electron microscopy (TEM) (c and d). (A and B) counterstaining of the immunostaining with DNA (blue) and E-cadherin (red). To better visualize the relative intracellular positioning of the SCVs in respect to the nucleus, nuclei (blue) and SCVs (green) are colored in the right panel of A and B. Representative images are shown. bar, 5 µm. (C and D) N, nucleus. White squares in the left panels indicate the area that is ten-fold enlarged in the right panels; broken lines in the right panels indicate completely membrane-enclosed SCVs; stars indicate single bacteria. Bar in the left panel of C and D, 5 µm; bar in the right panel of C and D, 500 nm. (e-h) The position of wt versus ΔsseB (e and f) and wt versus ΔsifA (g and h) SCVs apical (white) or basolateral (black) to the nucleus was categorized 2 (e and g) and 4 (f and h) days p.i. with 102 CFU wt, ΔsseB or ΔsifA S. Typhimurium. At least 30 individual cells from 2 (E and F) or 3 (F and H) different animals from one litter were evaluated. Significance was tested using a 2-way ANOVA with Sidak’s multiple comparison test. Mean ±SD are shown. P-values are indicated
Figure 4.
Figure 4.
Altered population dynamic in vivo and enterocyte egress in vitro of SPI2 T3SS mutant S. Typhimurium. (a and b) violin plots to illustrate the tag sequence identity between intraepithelial wt and ΔsseB S. Typhimurium strains and total liver (a) or spleen (b) tissue from 4 (wt) or 6 (ΔsseB) animals from one litter. This method visualizes the presence/absence of sequence tags in each organ in respect to the total spectrum of sequence tags found in this animal at day 4 p.i. with an equal mixture of all 22 strains in a total of 103 CFU bacteria. Significance was calculated with the Student’s t-test. Median (dashed line), quartile (dotted line) and p-values are shown. (c) Bray-Curtis Index was substracted from 1 for comparison of the similarity between the spectrum of intraepithelial S. Typhimurium strains and the spectrum of S. Typhimurium strains in liver and spleen tissue between wt and ΔsseB S. Typhimurium. (d) number of wt, ΔsseB and ΔssaN as well as complemented ΔsseB(psseB) and ΔssaN (pssaN) S. Typhimurium that egressed at the basolateral side from apically infected polarized intestinal epithelial m-ICcl2 cells within 30 min. Individual data, median, and p-values are indicated. (e) egress rate (%) calculated as total egressed bacteria/intraepithelial bacteria/x100 (see Fig. S1JK). Each data point represents one transwell insert of in total 6–9; data were generated in three independent experiments. One-way ANOVA with Dunnett’s multiple comparisons test. individual data, median, and p-values are indicated. (f) cartoon illustrating the observed block in the transepithelial transport of SCVs generated by SPI2 mutant S. Typhimurium in vivo.

Similar articles

Cited by

References

    1. Ochman H,Groisman EA. Distribution of pathogenicity islands in Salmonella spp. Infect Immun. 1996;64(12):5410–15. doi:10.1128/iai.64.12.5410-5412.1996. - DOI - PMC - PubMed
    1. Yu XJ, McGourty K, Liu M,“Unsworth KE, Holden DW. pH sensing by intracellular Salmonella induces effector translocation. Science. 2010;328(5981):1040–1043. doi:10.1126/science.1189000. - DOI - PMC - PubMed
    1. Arpaia N, Godec J, Lau L, Sivick KE, McLaughlin LM, Jones MB, Dracheva T, Peterson SN,Monack DM, Barton GM. TLR signaling is required for Salmonella Typhimurium virulence. Cell. 2011;144(5):675–688. doi:10.1016/j.cell.2011.01.031. - DOI - PMC - PubMed
    1. Fields PI, Swanson RV, Haidaris CG, Heffron F.. Mutants of Salmonella Typhimurium that cannot survive within the macrophage are avirulent. Proc Natl Acad Sci U S A. 1986;83(14):5189–5193. doi:10.1073/pnas.83.14.5189. - DOI - PMC - PubMed
    1. Leung KY, Finlay BB.Intracellular replication is essential for the virulence of Salmonella Typhimurium. Proc Natl Acad Sci U S A. 1991;88(24):11470–11474. doi:10.1073/pnas.88.24.11470. - DOI - PMC - PubMed

Publication types

MeSH terms

LinkOut - more resources